THIS REPORT CONTAINS ASSESSMENTS OF COMMODITY AND TRADE ISSUES MADE BY
USDA STAFF AND NOT NECESSARILY STATEMENTS OF OFFICIAL U.S. GOVERNMENT
POLICY
-
Date:
GAIN Report Number:
Post:
Report Categories:
Approved By:
Prepared By:
Report Highlights:
On August 16, 2017, The Ministry of Agriculture revised the Indian crop year (ICY) 2016/17
(July-June) grain production higher to a record 275.7 million metric tons (MMT), a marginal increase over the
third advance estimate (May 2017), but more than 4 percent higher than the previous record production
in ICY 2013/14. The MY 2016/17 PSDs for rice, corn, sorghum and millet and 2017/18 PSDs for
wheat and barley have been revised to reflect the latest revisions in the official estimates.
Santosh Kumar Singh
Scott Sindelar
Policy and Program Announcements
Grain and Feed
Grain Voluntary - September 2017
New Delhi
India
IN7112
9/6/2017
Public
General Information:
Government Raises 2016/17 Record Grain Harvest
On August 16, 2017, the MoA released the Fourth Advance Estimate of Food grains for ICY 2016/17,
further raising Indian record grain production to 275.7 MMT from the earlier estimate of 273.38 MMT
(May 2017).
The MoA’s latest projection estimates record production for all major grains (rice, wheat,
corn and pulses). After
faltering for two consecutive marketing years, India’s grain production
recovered strongly in ICY 2016/17 due to a near normal 2016 monsoon, with overall grain production
estimated to rise by nearly 10 percent over last year, and over 4 percent over the previous record crop
year (2013/14). ICY 2016/17 food grain production includes rice, coarse grains, and pulse crops
harvested last fall and this spring (MY 2016/17 in the PSD); and wheat and barley harvest in
March-May, 2017 (MY 2017/18 in the PSD). The PSDs for grains have been adjusted to reflect the updated
official production and planted area estimates. Consumption and ending stocks have been revised to
account for the changes in the production estimates.
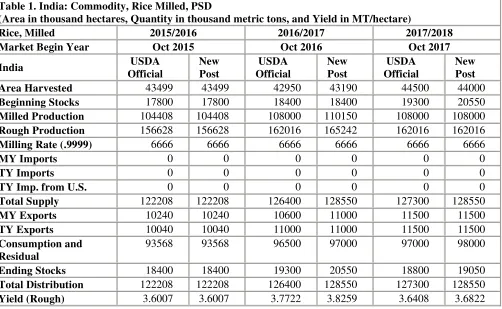
Table 1. India: Commodity, Rice Milled, PSD
(Area in thousand hectares, Quantity in thousand metric tons, and Yield in MT/hectare)
Rice, Milled 2015/2016 2016/2017 2017/2018
Market Begin Year Oct 2015 Oct 2016 Oct 2017
Beginning Stocks 17800 17800 18400 18400 19300 20550
Milled Production 104408 104408 108000 110150 108000 108000
Rough Production 156628 156628 162016 165242 162016 162016
Milling Rate (.9999) 6666 6666 6666 6666 6666 6666
MY Imports 0 0 0 0 0 0
TY Imports 0 0 0 0 0 0
TY Imp. from U.S. 0 0 0 0 0 0
Total Supply 122208 122208 126400 128550 127300 128550
MY Exports 10240 10240 10600 11000 11500 11500
TY Exports 10040 10040 11000 11000 11500 11500
Consumption and Residual
93568 93568 96500 97000 97000 98000
Ending Stocks 18400 18400 19300 20550 18800 19050
Total Distribution 122208 122208 126400 128550 127300 128550
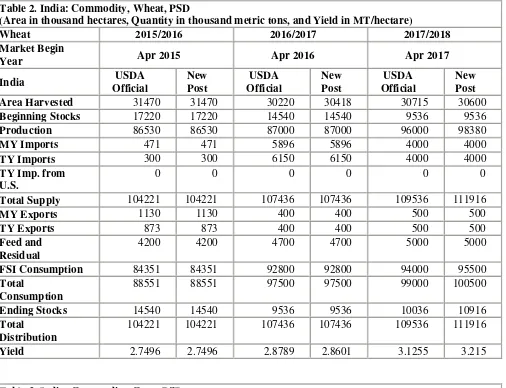
Table 2. India: Commodity, Wheat, PSD
(Area in thousand hectares, Quantity in thousand metric tons, and Yield in MT/hectare)
Wheat 2015/2016 2016/2017 2017/2018
Market Begin
Year Apr 2015 Apr 2016 Apr 2017
Total Supply 104221 104221 107436 107436 109536 111916
MY Exports 1130 1130 400 400 500 500
104221 104221 107436 107436 109536 111916
Yield 2.7496 2.7496 2.8789 2.8601 3.1255 3.215
Table 3. India: Commodity, Corn, PSD
(Area in thousand hectares, Quantity in thousand metric tons, and Yield in MT/hectare)
Corn 2015/2016 2016/2017 2017/2018
Market Begin
FSI Consumption 10000 10000 10200 10400 10200 10200
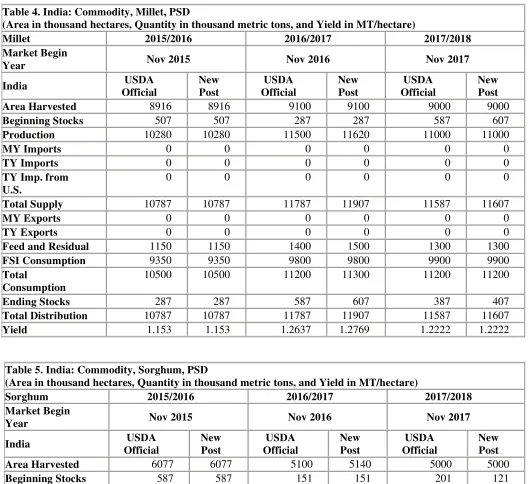
Table 4. India: Commodity, Millet, PSD
(Area in thousand hectares, Quantity in thousand metric tons, and Yield in MT/hectare)
Millet 2015/2016 2016/2017 2017/2018
Market Begin
Year Nov 2015 Nov 2016 Nov 2017
Total Distribution 10787 10787 11787 11907 11587 11607
Yield 1.153 1.153 1.2637 1.2769 1.2222 1.2222
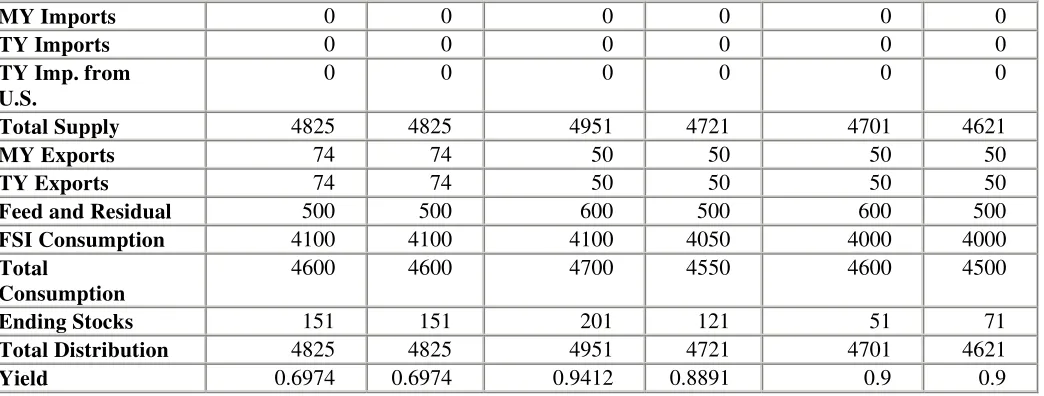
Table 5. India: Commodity, Sorghum, PSD
(Area in thousand hectares, Quantity in thousand metric tons, and Yield in MT/hectare)
Sorghum 2015/2016 2016/2017 2017/2018
Market Begin
MY Imports 0 0 0 0 0 0
Table 6. India: Commodity, Barley, PSD
(Area in thousand hectares, Quantity in thousand metric tons, and Yield in MT/hectare)
Barley 2015/2016 2016/2017 2017/2018
Market Begin