Report of the
Malaysian
National
Neonatal
Registry
2006
A STUDY OF CRITICALLY ILL BABIES IN
NEONATAL INTENSIVE CARE UNITS
Editor:
Irene Cheah Guat Sim
With contributions from:
Alvin Chang Shang Ming, Jimmy Lee Kok Foo, Boo Nem Yun,
Thong Meow Keong, Soo Thian Lian, Hans van Rostenberghe
Published by:
Malaysian National Neonatal Registry Seminar Room, Ward 8B, Level 8 Selayang Hospital
Selayang-Kepong Highway 68100 Batu Caves
Selangor Darul Ehsan Malaysia
This report is copyright. However it may be freely reproduced without the permission of the Malaysian National Neonatal Registry. Acknowledgement would be appreciated. Suggested citation is: Irene Cheah Guat Sim for the MNNR. Report of Malaysian National Neonatal Registry 2006. Kuala Lumpur MNNR 2008
November 2008
© Malaysian National Neonatal Registry, Malaysia Direct Line : (603) 6135 2008
Fax : (603) 6135 2008 E-mail : [email protected]
ACKNOWLEDGEMENT
The Malaysian National Neonatal Registry would like to express our sincere thanks and appreciation to all who have supported and contributed to this report.
We thank the following for their support :
The Ministry of Health, particularly the past Minister of Health, Y.B. Dato’ Seri Dr Chua Soi Lek for his kind support.
Y.B. Tan Sri Dato Seri Dr Hj Mohd Ismail Merican, the Director – General of Health, Malaysia
Dr Lim Teck Onn, the Director, Network of Clinical Research Centre
Members of the “Steering Committee” for their contributions to the registry
Our 29 source data providers from the Government Hospitals and they comprises of doctors and nurses working in the NICU
Staff of Clinical Research Center Hospital Kuala Lumpur, Datamed Computing Sdn Bhd and the ClinResearch for their technical and statistical support
Other sponsors and supporters from the professional bodies, industries and institutions as listed below:
Perinatal Society of Malaysia
PARTICIPATING HOSPITALS 1. Alor Setar Hospital
2. Batu Pahat Hospital
3. Ipoh Hospital
4. Kajang Hospital
5. Keningau Hospital
6. Kuala Lumpur Hospital
7. Likas Hospital
8. Melaka Hospital
9. Miri Hospital
10. Pulau Pinang Hospital
11. Putrajaya Hospital
12. Raja Perempuan Zainab II Hospital
13. Sarawak General Hospital,
14. Seberang Jaya Hospital
15. Selayang Hospital
16. Seri Manjung Hospital
17. Sibu Hospital
18. Sultan Haji Ahmad Shah Hospital
19. Sultanah Aminah Hospital
20. Sultanah Fatimah Specialist Hospital
21. Sultanah Nur Zahirah Hospital
22. Sungai Petani Hospital
23. Taiping Hospital
24. Teluk Intan Hospital
25. Tengku Ampuan Afzan Hospital
26. Tengku Ampuan Rahimah Hospital
27. Tuanku Fauziah Hospital
28. Tuanku Jaafar Hospital
STEERING COMMITTEE
Member Designation and Institution
The late Dato’ Dr Lim Nyok Ling
(Chairperson)
Head of Paediatric Department, Selayang
Hospital
Dr Irene Cheah Guat Sim
Head of Neonatal Unit, Paediatric Institute,
Kuala Lumpur Hospital
Dato’ Dr Jimmy Lee Kok Foo Head of Paediatric Department, Sultan Nur Zahirah Hospital
Dr Soo Thian Lian Head of Paediatric Department, Likas Hospital
Prof. Dr Hans van Rostenberghe Consultant Paediatrician and Lecturer, University Sains Malaysia Hospital
Prof. Dr Thong Meow Keong
Consultant Paediatric Geneticist and
Lecturer,
University Malaya Medical Centre
Dr Anna Padma Soosai
Consultant Paediatrician and
Neonatologist, Tengku Ampuan Rahimah
Hospital
ADVISORY COMMITTEE
Member Designation and Institution
Dr Angeline Wan Seng Lian Head of Paediatric Department, Sultanah Fatimah Specialist Hospital
Dr Amar Singh Head of Paediatric Department, Ipoh
Hospital
Professor Dr Boo Nem Yun Professor of Neonatology, University Kebangsaan Malaysia Hospital
Dr Chan Lee Gaik Head of Paediatric Department, Sarawak General Hospital
Dr Chin Choy Nyok Head of Paediatric Department, Tengku Ampuan Afzan Hospital
Dr Irene Cheah Head of Neonatal Unit, Paediatric
Department, Kuala Lumpur Hospital
Professor Dr Jackie Ho Professor of Neonatology, Perak Medical College
Professor Dr Lim Chin Theam Professor of Neonatology, University Malaya Medical Centre
Dr Lim Teck Onn Director of Clinical Research Centre, Kuala Lumpur Hospital
Dr Leow Poy Lee Consultant Pediatrician, Melaka Hospital
Member Designation and Institution
Dr Mohd Hanifah b. Mohd Jamil Head of Paediatric Department, Raja Perempuan Zainab II Hospital
Dr Hussain Iman b. Hj Mohammad Ismail Head of Paediatric Institue, Kuala Lumpur Hospital
Dr Neoh Siew Hong Head of Paediatric Department, Taiping Hospital
Dr Revathy Nallusamy Head of Paediatric Department, Pulau Pinang Hospital
Dr Soo Thian Lian Head of Paediatric Department, Likas Hospital
Dr Teh Keng Hwang Head of Paediatric Department, Alor Setar Hospital
Dr Tham Pui Ying Head of Paediatric Department, Sultanah Aminah Hospital
LIST OF SITE COORDINATORS
Institution Head of Department Coordinators
Paediatric Department
Alor Setar Hospital Dr Teh Keng Hwang
Dr Teh Keng Hwang Sr Nooraini bt Suhud
Paediatric Department
Batu Pahat Hospital Dr Ahmad Amin
Dr Mazhar Mohd Suud Sr Tan Yoke Keng S/N Lee Son Ai
Paediatric Department
Ipoh Hospital Dr Amar Singh
Dr Nor Azlina bt Mohd Rashid S/N Tan Hai Hong
Paediatric Department Kajang Hospital
Dr Soo Min Hong Sr Lim Beaw
Paediatric Department
Keningau Hospital Dr Khin Thant Sin
Dr Ang Siang Shie Sr Anna Tham
S/N Arbaiyah Hj. Burut
Paediatric Institute
Kuala Lumpur Hospital Dr Hussain Iman b. Hj Mohammad Ismail
Dr Irene Cheah Dr Chee Seok Chiong Dr. Farah Nini
Sr Sudha A/P Krishnan Kutty S/N Vanaja A/P Ramasamy Pillay
S/N Sharifah bt Adam S/N Norrida bt Ibrahim
Paediatric Department
Likas Hospital Dr Soo Thian Lian
Dr Soo Thian Lian Sr. Helen Lajewin S/N Suzie Sulinol
Paediatric Department
Melaka Hospital Dr Kuan Geok Lan
Institution Head of Department Coordinators
Pulau Pinang Hospital Dr Revathy Nallusamy
Dr Revathy Nallusamy S/N Zurina Ahmad S/N Fauziah Sakdin
PaediatricDepartment
Putrajaya Hospital Dr Fuziah bt Md Zain
Dr Fazila Mohd Kutty S/N Mastura Redzuan
Paediatric Department Raja Perempuan Zainab II Hospital
Dr Mohd. Hanifah b Mohd Jamil
Dr Angeline Yeoh Dr Angeline Yeoh S/N Zaiton Mohd Salleh
Paediatric Department
Selayang Hospital Dato’ Dr Lim Nyok Ling
Dato’ Dr Lim Nyok Ling
Institution Head of Department Coordinators
Sr Mary Tang Sing Chuo S/N Ting Meng Ling
Paediatric Department Sultan Haji Ahmad Shah Hospital
Dr Rohani bt Abdul Jalil
Dr Fariq b Miswan S/N Rosemawani Ismail S/N Suriati Mohd Din
Paediatric Department
Sultanah Aminah Hospital Dr Tham Pui Ying
S/N Fouziyah Enas S/N Siti Aminah bt Melan S/N Kamariah Ros
Paediatric Department Sultanah Fatimah Specialist Hospital
Dr Angeline Wan Seng Lian S/N Lon binti Ahmad
Paediatric Department
Dr. Sharifah Huda bt Engku Alwi
S/N Zawahir Abu Zarin S/N Aishah bt Harun
Paediatric Department
Sungai Petani Hospital Dr Choo Chong Ming
Dr Khairul Idzwan S/N Tan Leh Khim S/N Neelavathy a/p Manickham
Paediatric Department
Taiping Hospital Dr. Neoh Siew Hong
Institution Head of Department Coordinators
Sr Sharifah Hanim Bt Syed Hamzah
Tuanku Ja'afar Hospital Dr. Tan Kah Kee
STAFF OF MALAYSIAN NATIONAL NEONATAL REGISTRY
Clinical Registry Manager Jennifer Loong Clinical Registry Assistant Om bt Jantan
Shahirah bt Safian
CRC TECHNICAL SUPPORT STAFF
Director Dr Lim Teck Onn
Epidemiologist Dr Jamaiyah Haniff
Head of ICT Unit Celine Tsai Pao Chien
Database Administrator Lim Jie Ying
Sebastian Thoo
Network Administrator Kevin Ng Hong Heng
Adlan Ab Rahman
Statistician Dr Sharon Chen Won Sun
Lena Yeap
Contents
3.1.3 Levels of Neonatal Care ... 10
3.2 The Mother ...11
3.5.1 Inborn vs Outborn Babies ...14
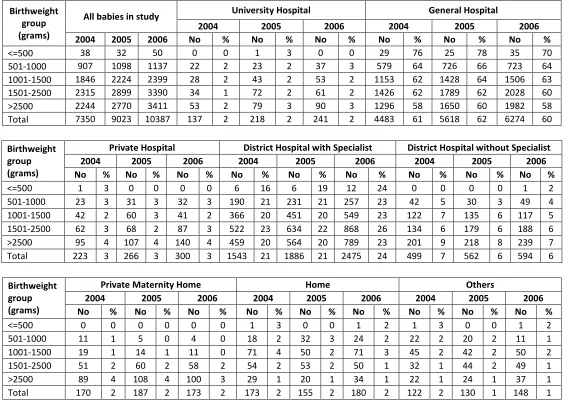
3.5.2 Place of birth ...16
3.5.3 Mode of delivery ...17
3.6 Condition of VLBW babies (BW <1500gm)...17
3.7 Need for Ventilatory Support (VS) ...18
3.8 Morbidity ...20
3.8.1 Specific conditions in relation to respiratory morbidity ...21
3.8.1.1 Respiratory distress ...21
3.8.1.2 Respiratory distress syndrome & exogenous surfactant ...21
3.8.1.3 Chronic lung disease ...23
3.8.1.4 Congenital pneumonia (C Pneu) ...24
3.8.1.5 Meconium aspiration syndrome (MAS)...24
3.8.1.6 Pneumothorax (PTX)...24
3.8.2 Hypoxic ischaemic encephalopathy (HIE) ...24
3.8.3 Neonatal encephalopathy (NE) ...25
3.8.4 Intraventricular haemorrhage...25
3.8.6 Necrotising enterocolitis ...28
3.9 Congenital anomalies...28
3.10 Neonatal infections ...29
3.10.1 Classification: ...29
3.10.2. Infection Rates ...30
3.10.3 Types of infecting organism ...31
3.11 Outcome ...31
3.11.1 Survival according to birthweight and gestational age...31
3.11.2Survival rate according to centres ...33
3.11.2.1 Survival rate of babies of birth weight between 1001-1500 grams ...33
3.11.2.2 Survival of babies of birthweight 501-1000 grams ...35
3.12 Perinatal and neonatal mortality rates ...36
3.13 Discharge...37
4.0 Study Recommendations ...38
5.0 Tables ...39
Table 1. Admissions to each NICU unit by year ...39
Table 2. Case distribution according to gestational age group by year...40
Table 3. Case distribution according to birthweight group by year ...40
Table 4. Ethnicity according to gestational age group (weeks) by year ...41
Table 4a. Ethnicity according to birthweight group, by year...42
Table 5. Use of antenatal steroid according to gestational age group, by year ...43
Table 6. Mean maternal age according to gestational age group, by year ...43
Table 6a. Mean maternal age according to birthweight group, by year ...43
Table 7. Growth status according to gestational age group, by year ...44
Table 7a. Growth status according to birthweight group, by year ...44
Table 8. Gender according to gestational age group, by year ...45
Table 8a. Gender according to birthweight group, by year...45
Table 9. Place of birth according to gestational age group, by year...46
Table 9a. Place of birth according to birthweight group, by year ...47
Table 10. Inborn-Outborn status according to gestational age group, by year...48
Table 10a. Inborn-Outborn status according to birthweight group, by year ...48
Table 11. Multiplicity of births according to gestational age group, by year ...49
Table 11a Multiplicity of births according to birthweight group, by year ...50
Table 12. Mode of delivery according to gestational age group, by year ...51
Table 12a. Mode of delivery according to birthweight group, by year ...52
Table 13. Survival rate according to CRIB score for babies <1500 grams, by year ...53
Table 13a. Mean CRIB score and survival rate according to centre, by year...54
Table 14a. Ventilatory support according to birthweight group, by year ...55
Table 15. Use of CPAP according to gestational age group, by year ...56
Table 15a. Use of CPAP according to birthweight group, by year ...56
Table 16. Use of HFOV according to gestational age group, by year...57
Table 16a. Use of HFOV according to birthweight group, by year ...57
Table 17. Use of Nitric Oxide to gestational age group, by year ...58
Table 17a. Use of Nitric Oxide according to birthweight group, by year...58
Table 18. Use of patient-trigger ventilation to gestational age group, by year...58
Table 18a. Use of patient-trigger ventilation according to birthweight group, by year...58
Table 19. Mean total duration of ventilatory support according to gestational age group, by year ...59
Table 19a. Mean total duration of ventilatory support according to birthweight group, by year ...59
Table 20. Use of antibiotic according to BW group, by year ...1
Table 20. Con’td Use of antibiotic according to BW group, by year...61
Table 21. Use of surfactant according to birthweight group, by year ...61
Table 22. Use of postnatal steroid for CLD according to birthweight group, by year ...62
Table 23. Use of parenteral nutrition according to birthweight group, by year ...62
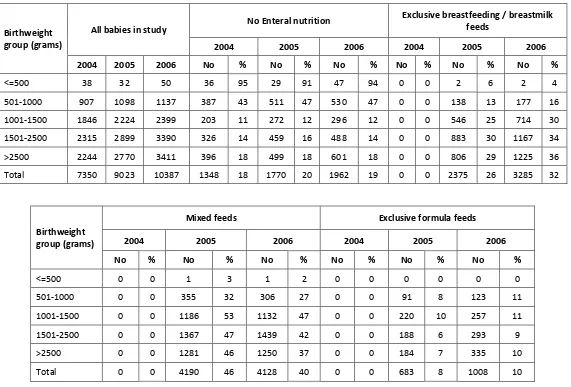
Table 24. Enteral nutrition feeding on discharge according to birthweight group, by year...63
Table 25. ROP screening according to gestational age group by year...64
Table 25a. ROP screening according to birthweight group, by year ...64
Table 26. Cerebral ultrasound scanning according to birth weight group, by year...65
Table 27. Mean Discharge weight according to gestational age group, by year ...66
Table 27a. Mean Discharge weight according to birthweight group, by year...66
Table 28. Mean total duration of hospital stay according to gestational age group, by year ...67
Table 28a. Mean total duration of hospital stay according to birthweight, by year ...67
Table 29.Survival according to gestation (gestational age group), by year ...68
Table 29a. Survival according to birthweight group, by year ...69
Table 30. Place of discharge, if child alive, according to birthweight group 2006 ...70
Table 31. Reasons for transfer to other hospitals according to centres, 2006...70
Table 32. Post-transfer disposition...70
Table 33a. Specific morbidities according to birthweight group, 2006 ...71
Table 33b. Congenital anomalies according to birthweight group, 2006...73
Table 33c. IEM according to birthweight group, 2006...73
Table 34. HIE according to birthweight group, 2006 ...74
Table 35. Mean highest total serum bilirubin according to birthweight group, 2006...74
Table 36. Episodes of confirmed bacterial sepsis according to birthweight group and survival status, 2006. ...75
Table 38. Mortality rate of confirmed fungal sepsis according to birthweight group, 2006...75
Table 39. Supplemental oxygen use according to survival status of birthweight group, 2006 ...76
Table 39a. Supplemental oxygen use according to survival status of gestational age group, 2006 ...76
Table 40. Use of antenatal steroid to centres, 2006 (Inborn) ...77
Table 40a. Use of antenatal steroid to centres, 2006 (Outborn)...78
Table 41. Use of surfactant in Respiratory Distress Syndrome (RDS) according to centres, 2006 ...79
Table 42. Use of Parenteral nutrition (PN) according to centres, 2006...80
Table 43. Pneumothorax according to centres, 2006...81
Table 44. Use of supplemental oxygen on day 28 for VLBW babies according to centres, 2006 ...82
Table 44a. Use of supplemental oxygen at 36 weeks corrected gestation for VLBW babies according to centres, 2006 ...83
Table 45. Cerebral ultrasound scanning (CUS) and intraventricular haermorrhage (IVH)(Babies with BW 501-1500g) according to centres, 2006 ...84
Table 46. Retinopathy of prematurity (ROP) (Babies < 32 weeks gestation) according to centres, 2006..85
Table 47. Retinopathy of prematurity (ROP) (Babies with BW < 1250g) according to centres, 2006 ...86
Table 48. Cephalheamatoma, Sub-aponeurotic haemorrhage, Erb’s palsy and Birth Trauma according to centres, 2006 ...87
Table 49. Necrotising enterocolitis (NEC) (babies with BW 501-1500gm) according to centres, 2006...88
Table 50. Episodes of confirmed bacterial sepsis (exclude fungal sepsis) according to centres, 2006 ...89
Table 50a. Confirmed bacterial sepsis (exclude fungal sepsis) according to centres, 2006 ...90
Table 51. Confirmed bacterial sepsis in very low birthweight babies (501-1500gm) according to centres, 2006 ...91
Table 52. Fungal sepsis in very low birthweight babies (501-1500gm) according to centres, 2006 ...92
Table 53. Perinatal and neonatal death and mortality rate according to centres, 2006...93
Table 54. Survival of extremely preterm (22-27 weeks’ gestation) and...94
very preterm (28-31 weeks’ gestation) according to centres, 2006...94
Table 55. Survival of extremely low birthweight (BW 501-1000gm) and ...95
very low birthweight (BW 1001-1500gm) according to centres, 2006...95
Table 56. Survival of cases with ventilatory support (VS) according to centres, 2006 ...96
Table 57. Duration of hospital stay for babies of BW 501-750 gm according to centres, 2006 ...97
Table 57a. Duration of hospital stay for babies of BW 751-1000 gm according to centres, 2006 ...98
Table 57b. Duration of hospital stay for babies of BW 1001-1250 gm according to centres, 2006 ...99
Table 57c. Duration of hospital stay for babies of BW 1251-1500 gm according to centres, 2006 ...100
Table 57d. Duration of hospital stay for babies of BW 1501-2500 gm according to centres, 2006 ...101
Table 57e. Duration of hospital stay for babies of BW > 2500 gm according to centres, 2006...102
Table 58b. Administration of maternal antenatal steroid to mothers of babies born <1500g according to
centres, 2006 ... 104
Table 59a. Babies with birth weights <1500g with RDS requiring ventilator support according to centres, 2006 ...105
Table 59b. Babies with birthweights <1500g with RDS requiring CPAP only according to centres, 2006 106 Table 60a. Babies with gestation <32 weeks with RDS requiring ventilator support according to centres, 2006 ...107
Table 60b. Babies with gestation <32 weeks with RDS requiring CPAP only according to centres, 2006 108 APPENDIX 1(Data definitions and criteria)... i
APPENDIX 2 (Neonatal Birth census) ... ix
APPENDIX 3 (Case report form) ... xi
APPENDIX 4 (Definition of level of NICU according to function) ... xv
APPENDIX 5 (References)...xvii
FOREWORD
The Malaysian National Neonatal Registry (MNNR) study centres comprise 29 out of 40
Neonatal Intensive Care Units (NICU)’s in government hospitals and one NICU was from a
university hospital. Nearly fifty per cent of deliveries in Malaysia are conducted in the
MNNR hospitals. From this, 61,758 are admitted for neonatal care and 10,387 babies in
2006 fulfilled the MNNR study criteria. Without the immense effort and team work of the
doctors and nurse coordinators from each NICU and the registry staff to collect and
coordinate the data, this study would not have been feasible. Their hard work is much
appreciated. It is hoped that all NICU’s in the study will benchmark their performance
accordingly and continue to strive to provide better care through audit and quality
improvement.
The steering committee thank Tan Sri Datuk Dr Ismail Merican, Dato Dr Zaki Morad, Dr Lim
Teck Onn, Dr Hussain Imam and Dr Goh Pik Pin for their constant support. We extend our
gratitude to the late Dato’ Dr Lim Nyok Ling, the previous Chairman, for having persevered
in the setting up the foundation of this registry.
This annual report has been delayed due to unforeseen circumstances but I am glad to
report that the study on the ‘Outcome of Critically Ill Babies in the Neonatal Intensive Care
Units (NICUs) in Malaysia’ in its third year has gathered sufficient data to permit some level
of analysis of NICU care and the various outcomes, such as survival rates and rates of
screening for retinopathy of prematurity over the three years; and to compare outcomes
such as survival rates, use of antenatal steroids, the rate of complications such as
pneumothorax, chronic lung disease, retinopathy of prematurity across centres, as well as
the use of treatment such as parenteral nutrition and surfactant in the care of preterm
babies by the various centres. Variations in outcome arise from various reasons pertaining
to the data itself as well as variation of referral pattern and resources available. Risk
adjustment would be one of the things to look at for future analysis.
Several papers arising from this data have been presented at national conferences and
several forums. It is also hoped to stimulate further research, including auditing of NICU
care in Malaysia, which will lead to continuous quality improvement in NICU care. The
findings from this database can also be used to produce papers for publication in journals.
We look forward to private and more university-based institutions to join the Malaysian
National Neonatal Registry (MNNR) in order to capture a more comprehensive picture of
the care of critically ill babies in the country.
Dr. Irene Cheah Guat Sim
Chairman
SUMMARY
The study started its recruitment in 2004 and the inclusion criteria involve all preterm
babies below 32 weeks gestational age, those with birth weight below or equal to 1500
grams, all significant congenital anomalies admitted to the NICU, all babies who were
ventilated and all live-born babies who died in the hospital.
In 2006, there were a total of 239,750 births in the 30 participating centres, of which 2,226
were stillbirths and 237,514 were live-births. More than ten thousand (n=10,387) babies in
the level III NICU centres met the study criteria. From this, 3,153 were preterm babies
below 32 weeks gestational age (GA) and 3,586 babies had birth weights of below 1501
grams.
Results:
•
Twenty-five percent (25%) of the study population were small-for-gestational-age
(SGA) and there is an increasing trend in the percentage of SGA babies from
2004-2006.
•
Babies born to
Orang Asli
mothers had the highest risk of fulfilling the study criteria,
followed by
Bumiputra Sarawak
and
Bumiputra Sabah
mothers.
•
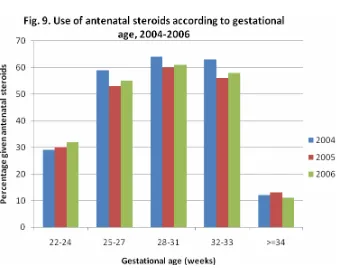
Only 60% of mothers of 25-33 weeks gestation received antenatal steroids in 2006.
There were marked variations (12-90% of preterm babies below 32 weeks GA) in the
use of antenatal steroids across centres. .
•
Seven-thousand three-hundred and six (81.0%) out of 9,023 babies were inborn. For
babies less than 32 weeks gestational age, 2,426 (83.6%) out of 2,902 were inborn.
The overall maternal steroids used were only 55.2% with 60.3% used in inborn
babies and 23.3% in outborn. Inborn babies had a better survival rate particularly
those in the 701-900 birthweight category
•
The Caesarean section rate for very low birthweight (VLBW) babies in the MNNR was
44%, and this was low compared to that of other neonatal networks such as the
Vermont Oxford Network which had a VLBW Caesarean section rate of 69%.
•
The ‘clinical risk index for babies’ (CRIB), revealed a strong correlation of CRIB score
with mortality rates in all three years. Although there was variation in outcomes
between centres for the same mean CRIB score, for each centre, there was an
increase in survival for the same mean CRIB score over the three years.
•
Eighty-two percent of the overall cohort required ventilator support. Seventy
percent of ventilated babies were more than 32 weeks gestation and more than
1500 gram birth weight. The duration of ventilatory support for survivors between
501-1000 grams birthweight (BW) was 20+19 days, for those between 1001-1500
grams, BW was 10+8 days and those of more than 2500 grams had BW of 4+6 days.
•
Other than in the birthweight group 501-1000 grams, less than 50% of the babies
with respiratory distress syndrome (RDS) received surfactant within two hours of
life. There is, however, increasing percentage of babies receiving early surfactant
over the years.
•
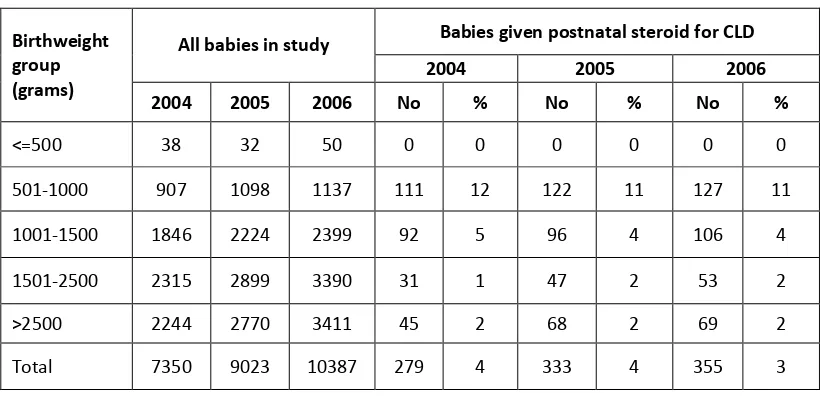
Postnatal steroid for chronic lung disease was given to 10.6% of those with birth
weights <1000 grams and 4.0% of those with birthweights 1001 -1500 grams.
•
Five-hundred and five (4.9%) of the entire cohort developed pneumothorax with
high mortality rates in preterm infants.
•
Nine percent (9.3%) of babies above 2000 grams birthweight were reported to have
hypoxic ischaemic encephalopathy (HIE) - 69.4% had mild or moderate HIE and
30.6% had severe HIE. Severe HIE was more common among the outborn babies
(44.6%) than the in-born babies (27.5%) with HIE, and mortality rates was 70.2% in
those with severe HIE as compared to 10.7% HIE.
•
Twelve percent (12.1%) of babies, between 501-1000 grams BW with ultrasound
(ROP). The rate of babies who had not been screened prior to discharge seems to be
increasing but screening could have been done as an outpatient.
•
Nineteen percent (18.5%) (1922/10387) of infants had congenital anomalies. The
incidence of congenital anomaly was 185 per 1000 births. Amongst infants with
congenital anomalies, the mortality rate was 57.8%.
•
Eleven percent of all babies had one or more episodes of confirmed bacterial sepsis.
In this group, mortality rate was 26.9% in contrast to a mortality rate of 19.6% in
babies without confirmed bacterial sepsis. The infection rate is highest (21%) in the
birthweight group 501-1000 grams followed by 14% in the group of 1001-1500
grams BW.
•
The overall survival to discharge has increased from 77% in year 2004 to 80% in year
2006. Survival of babies up to 31 weeks and up to 1500 grams improved
progressively with increasing gestation and birthweight. Over the last two years,
there is a 10% increase in survival rate for the 701-800 gram birthweight group.
There was marked difference in survival between babies below and above 700 grams
birthweight i.e. from 22% survival rate at 601-700 grams birth weight group to 43%
survival at 701-800 grams birthweight.
•
The survival rate of babies between 1001-1500 grams birthweight, which is the key
performance index for government NICU’s, varied from 74-92% according to centres.
•
The survival rate of babies between 501-1000 grams birthweight varied from 31-65%
Study recommendations include collaboration with Obstetrics and Public Health staff to
•
closely monitor the antenatal care of mothers of
Orang Asli
and
Bumiputra Sabah
and
Sarawak
ethnic groups to reduce the risk of hypoxic ischaemic encephalopathy
•
enhance the use of antenatal steroids and continue with in-utero transfer of high
Report of the Malaysian National Neonatal Registry (MNNR) 2006
1. Organisation of the MNNR
1.1 History
The Malaysian National Neonatal Registry was set up in 2002 to study the outcome of sick
babies admitted to Neonatal Intensive Care Units (NICU’s) in the country. It was well known
that minimum data set and a data collection system at a national level are important to
monitor mortality and morbidity of infants admitted to NICUs.
Since then a pilot study in collaboration with the Clinical Research Centre (CRC) and the
Ministry of Health of Malaysia, from 1
stOctober to 31
stDecember in which 14 centres
participated was done. Two reports were published for the years 2004 and 2005.
The Malaysian NNR aims to:
1.
Determine the frequency and distribution of critically ill neonates in Malaysia. These
are useful measures of the health burden arising from neonatal critical illness and its
care in the country.
2.
To study the mortality and some morbidity outcomes of babies admitted to NICU in
participating hospitals.
3.
To calculate the perinatal, neonatal, and stillbirth mortality rates of inborn babies.
4.
To compare outcomes between various centres.
5.
To develop indicators for standard of care in various areas e.g. ‘Acceptable
septicaemic rates in NICUs’.
6.
To study in further detail the outcome of very low birth weight babies.
7.
Stimulate and facilitate research on neonatal critical illness and its management.
1.2 Structure
The MNNR consists of an Advisory Committee, Steering Committee and administrative staff.
The Advisory Committee consists of heads of department (or their nominee) of each
participating hospital, a few academic neonatologists from the Universities and a clinical
biostatistician and epidemiologist. This committee monitors and directs the functions of
MNNR and it meets at least once a year during a National Neonatal Registry Forum.
The Steering committee consists of nine members, eight of whom were elected. The 9
thwas
appointed for his expertise and involvement in the development of the ‘congenital
anomalies’ section of the registry. This committee is concerned with the general running
and decision making of the Registry and to approve use of its data.
1.3 Funding
The Ministry of Health of Malaysia provided a research grant to ‘Study the outcome of
critically ill babies in NICUs’. Considerable funding was also obtained from the Perinatal
Society of Malaysia. In 2006, some funds were also raised from the organisation of two
MNNR Forums. We thank all involved for their very generous and encouraging support.
2. Data Set
Participating centres in 2006, in alphabetical order:
1.
Hospital Alor Setar
2.
Hospital Batu Pahat
3.
Hospital Universiti Sains Malaysia (HUSM)
4.
Hospital Ipoh
11.
Hospital Likas, Kota Kinabalu
12.
Hospital Manjung
24.
Hospital Sultanah Aminah, Johor Bharu
25.
Hospital Taiping
26.
Hospital Tengku Ampuan Rahimah, Klang
27.
Hospital Tengku Ampuan Afzan, Kuantan
28.
Hospital Teluk Intan
29.
Hospital Temerloh
30.
Hospital Umum Kuching
2.1 Registration criteria
The MNNR audit of critically ill babies admitted to a Neonatal Unit (NNU) included
A. All babies admitted to a Neonatal Unit who
1. had a gestation of <32 weeks i.e. up to 31 weeks + 6 days.
2. had birthweight of 1500 grams and below
3. were ventilated
4. had significant congenital anomalies
.
B. All neonatal deaths (i.e. newborn babies (<28 days) who die in the NNU, delivery room
i.e. Operating Theatre and labour room, and other wards)
Both inborn and outborn babies will be included but outborn babies who expire before
arrival will be excluded. Babies who are admitted to the NNU at a corrected gestation of
> 44/52 will not be considered a neonatal case and hence will be omitted from the
study.
2.2 Data set variables
The variables and their definitions are listed in Appendix 1.
In 2006 the format of Case Report Forms (CRFs) was changed slightly to include name of
hospitals for ex-utero transfer and place of death. Data on all inborn births was also
collected to facilitate calculation on perinatal and neonatal mortality rates of each hospital.
(Appendix 2 Birth Census)
2.3 Data collection
The CRF consisted of four sheets of forms. (Appendix 3: CRF)
Babies discharged /transferred out to non-paediatric wards (e.g. paediatric surgical wards)
in the same hospital or to other hospitals will have only one set of CRFs completed and
readmission of the same babies into the NNU will require a new set of CRFs.
A baby who was transferred between neonatal and paediatric wards under the same
department will be considered to be the same admission and the discharge CRF is to be
completed after complete discharge from the hospital.
3. Results
3.1 Results in general
In 2006, total births in the 30 participating centres were 239,750 of which 2,226 were
stillbirths and 237,514 were livebirths.
A total of 10,387 babies who were admitted (admissions also included outborns who were
not delivered in respective hospitals of the participating centres) met the criteria to be
included in the MNNR (Table 1). Of these 3,153(30.3%) were less than 32 completed weeks
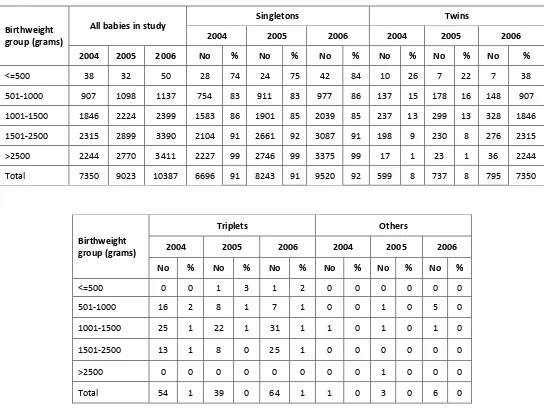
(Table 2) and 3,586 (34.5%) had birthweights of 1500 grams and below. A total of 1,187
babies (11.4%) had birthweight of 1000 grams or less (Fig. 3, Table 3). There were more
babies in the 2006 cohort compared to 2004 and 2005 especially in the higher gestation and
birthweight groups (Figs 1a, 1b and 2). This is largely due to the addition of three additional
NICU’s participating in the MNNR.
While the babies who met the criteria for the study (n=10,387) were generally babies
requiring the most care, they do not include many other babies admitted to the NICUs for
other treatment and observation. The total number of admissions to the 30 centres totaled
61,758 based on census collected concurrently by the NICU’s.
About 5% of total livebirths in
the MNNR hospitals are of birthweight below or equal to 1500 grams. Twenty-eight per cent
(28%) of total livebirths between 1501-2500 grams birthweight and 1.6% of livebirths with
birthweight above 2500 grams met the MNNR criteria.
3.1.1 Growth status
In terms of growth status, 2,600 (25%) of the whole study population was small for
gestational age (SGA < 10
thcentile for gestation according to Lubchenko chart). The SGA
rate for very preterm infants (gestation < 32 weeks) was 18% and VLBW infants (BW
501-1500g) was 36% (Tables 7 and 7a).
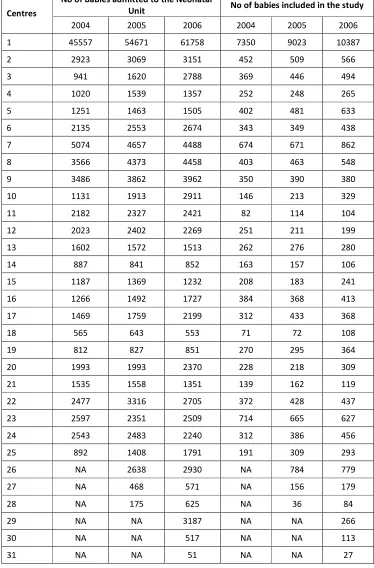
3.1.2 Registrants per unit
The number of admissions and number of babies included in the study from each Neonatal
Unit are as shown in Table 1. The number of babies who met the criteria and was included
in the study ranged from 84 in one centre to 862 in another. These numbers reflected the
size of the centre, the case mix of their patients and the geography and population
distribution of each area.
The relative proportion of babies below 32 weeks’ gestation at birth in the study per center
is shown in Fig. 5.
3.1.3 Levels of Neonatal Care
Care for the newborn is provided at three levels. (See Appendix 4)
Hospitals with a level III NICU provide all three levels of care and are referred to in this
report as tertiary hospitals. Most Level III NICUs are in Ministry of Health hospitals and a few
are in university hospitals. A total of about 40 government and three university hospital
centres in the country provided neonatal intensive care to sick babies in 2006, and 30 of
these NICUs are source data producers (SDPs) of the MNNR- 29 NICU’s in government
hospitals and one NICU attached to an university.
The majority of the state hospitals or larger NICU’s in Selangor offered Level IIIB care in all
aspects except for the availability of High Frequency Oscillatory Ventilation (HFOV) and
nitric oxide and subspecialties in some hospitals. These hospitals would accept the sicker
and smaller babies from the smaller NICU’s in the study although the latter hospitals do
manage the ELBW (extremely low birth weight infants) in smaller numbers. There are
neonatologists in 12 out of 17 of the state hospitals/larger NICU’s.
3.2 The Mother
Ethnicity as identified by the mother was reported as 63.4% Malays, 10.7% Chinese, 7.3 %
Indians, 1.4 % Orang Asli, 5.1% Bumiputra Sabah, 5.6% Bumiputra Sarawak, 0.8% other
Malaysians and 5.8% foreigners (Table 4). Similar case distribution was seen in 2004 and
2005 except for an increased proportion of Bumiputra Sabah (4.2% to 5.1%)
Table 4a shows that a much higher percentage of babies born in the SDP hospitals to Orang
Asli (8.8%) meet the MNNR criteria, i.e. are more ill or of very low birth weight, preterm or
having a significant congenital abnormality; followed by Bumiputra Sarawak, Indian and
Bumiputra Sabah. Although Malay mothers have the largest number of their babies in the
study, it is not an over-representation of the mothers delivering in SDP hospitals (Table 4a,
Fig.6).
Table 4a. Ethnic distribution of livebirths in SDP hospitals
Ethnicity
No. livebirths in SDP hospitals
No. in MNNR
%MNNR
Malays
159,071
6,579 4.1
Chinese
24,551
1,108 4.5
Indian
14,629
761 5.2
Orang asli
1,632
143 8.8
Bumiputra Sabah
10,543
527 5.0
Bumiputra
The mean maternal age in the study group was 29 +/- 7 years(Tables 6 and 6a) and there
was little variation in the maternal age between the gestational and birthweight groups.
(Tables 4 and 4a)
3.3 Use of Antenatal steroids
Corticosteroids are administered to the mother to enhance the maturation of her baby’s
lungs when it is thought she will deliver before 34 weeks’ gestation. The first randomized
controlled trail of steroid use was in New Zealand in 1970 (Liggins & Howie, 1972). A
systematic review reported antenatal steroids to be efficacious in helping to promote
maturation of the lungs and preventing death (Crowley, 2003). This therapy also has other
beneficial effects such as reduction of the incidence of necrotizing enterocolitis, without
harmful effects for mother and baby. The Perinatal Society of Malaysia in collaboration with
the Ministry of Health of Malaysia has recommended that maternal corticosteroids should
be considered before all births at less than 34 weeks in order to improve neonatal
outcomes. (PSM Clinical Practice Guidelines, 1995 updated 2001)
Fig. 8 Percentage of inborn babies < 32 weeks gestation who received antenatal steroids
(other NICU’s)
3.4 The baby
3.4.1 Gender
The proportion of males in the study was 5970/10387 i.e. 57% and females 4370/10387 i.e.
42 %. Sex was indeterminate in 47 babies (0.5%) (Table 8). Relatively more males admitted
into the study implying that babies of the male sex were at higher risk of being critically ill at
birth. Tables 8 and 8a show the gender distribution according to gestational age and
birthweight group. Significantly more male babies than female babies >2500 grams.
birthweight met the MNNR criteria, as with more male babies of term gestation.
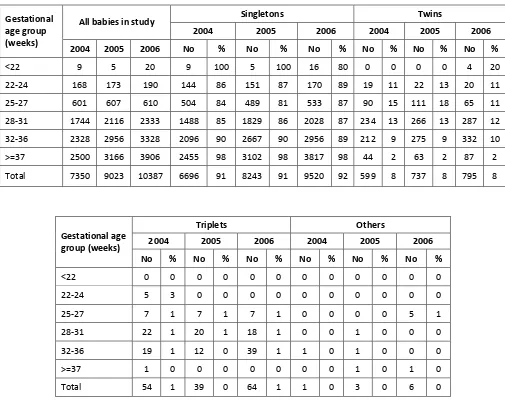
3.4.2 Multiple births
There were 9,520 (92%) singletons, 795 (8%) twins, 64 (1%) triplets in the study. (Tables 11
and 11a)A total of 867 (8.4%) babies in the study were from a multiple birth. Twelve per
cent of preterm infants were from a multiple birth.
3.5 Birth
3.5.1 Inborn vs Outborn Babies
Babies are usually cared for in the hospital of their births. However some high-risk babies
may need to be transferred to a hospital with a level III NICU, if care is being received at a
hospital without NICU facilities. When this risk is anticipated both mother and baby may be
transferred before birth (in-utero), or if risk is not anticipated baby is transferred only after
being born (ex-utero). Transfer is usually made to the nearest NICU with an available bed,
and in most places an escort transport system is practised. Sometimes this transfer may
have to be made to an NICU which is quite far away from the referring unit. It is generally
recommended that all babies <33 weeks should be delivered in an obstetric unit in a
hospital with an NICU.
In this cohort 7,306 (81.0%) out of 9,023 babies were inborn. For babies of <32
weeks gestation 2,426 out of 2,902 (83.6%) were inborn (Table 10a). Fig 10 shows the
inborn-outborn status according to birth-weight groups. Proportionately babies in the lower
birthweight groups were more likely to be inborn.
The overall surfactant usage was only 43.7% with IB 42.3% compared with OB 52.2%
(p value 0.004). Ventilation support (CPAP and ventilation) in IB 72% was lower than OB
82% (p-value 0.000). Continuous Positive Airway Pressure (CPAP) usage for IB (17%) was
higher than OB (10%). For babies ventilated, the median duration of ventilation was similar
between the two groups; IB:5 days (IQR 2-12) and OB:6 days (IQR 3-15). Antibiotic usage
was high (85.6%) with IB 84% versus OB 93% (p = 0.000).
The overall survival for the year 2006 for extremely low birth weight (ELBW) was
46.5% and VLBW 73.1%. Figure 11 shows the survival in birthweight categories in VLBW
babies with IB versus OB babies for the year 2006. The OB had better apparent survival
than IB babies in birthweight categories 501-600, 601-700, 901-1000, 1001-1100 and 1201
to 1300 grams, a pattern similar to that in MNNR 2005 data. It could be explained by
selection bias as MNNR is a hospital and not community based registry. Babies who would
otherwise been transferred out but died before transfer would have been included in the
inborn group whilst the more stable baby transferred would be an outborn. Hence, the
survival for OB babies especially those less than 800 grams or 25 weeks appears to be falsely
higher. Table 10b summarises the survival of IB versus OB babies in which the IB did better
for 1001-1500 grams and VLBW but not for the ELBW. However, once the birthweight
<700g has been excluded from the calculation, the IB babies had better survival in all
birthweight categories particularly in the 701-900 grams birthweight group.
Table 10b - Survival (%) according to Inborn or Outborn status, 2004-2006
ELBW
1001-1500g
VLBW
Year
IB(%)
OB(%) IB&OB IB(%)
OB(%) IB&OB(%) IB(%)
OB(%) IB&OB(%)
2004
39.6
50.9
41.5
85.1
84.0
84.9
69.4
73.6
70.2
2005
44.6
49.4
45.2
86.3
82.3
85.6
71.9
72.6
72.0
2006
46.1
50.0
46.5
86.7
82.9
86.2
73.2
72.5
73.1
2006* 59.0
54.5
58.3
86.7
82.9
86.2
79.6
74.9
78.9
*Survival % for 2006 EXCLUDING birthweight categories <500g, 501-600, 601 to 700g
3.5.2 Place of birth
3.5.3 Mode of delivery
The overall spontaneous vertex delivery rate was 52.0% (5398/10387) and Caesarean
section rate 41.9% (4400/10387). For very preterm (<32 weeks) babies the Caesarean
section rate was 38.8% (1225/ 3153) (Table 12). The Caesarean section rate for VLBW babies
in the MNNR is 44%, low compared to that of other neonatal networks such as the Vermont
Oxford Network which has a VLBW Caesarean section rate of 69%. The Caesarean section
rate is the lowest in babies below 27 weeks gestation which may be a reflection of the less
aggressive intrapartum management of the extremely preterm babies (Fig. 12). One other
possible reason is the late arrival of mothers with poor or no antenatal care to the hospital.
3.6 Condition of VLBW babies (BW <1500gm)
A ‘clinical risk index for babies’ (CRIB) score was performed based on six variables, derived
from routine data recorded within 12 hours of birth. These variables have been found to be
independently associated with hospital deaths. (Appendix 3 CRF) and the score may be used
as a tool for assessing initial risk and comparing performance of neonatal intensive care
units.
The mean CRIB score of babies with BW < 1500gm in 2004-2006 cohorts was 4 +/- 4 and of
overall survival was 72% in 2004, 74% in 2005 and 77% in 2006.
There was a strong correlation of CRIB score with mortality rates in all three years. (Fig 13).
However centre comparison in CRIB score and performance shows some variation in
outcomes among centres with similar scores (Table 13a). Overall, for each centre, there is
an increase in survival for the same mean CRIB score over the three years.
SVD : 52.0%
3.7 Need for Ventilatory Support (VS)
All newborn babies admitted to NICUs with a gestation of < 32 weeks at birth were included
in this study. Of these 2,553/3,153 (81%) received ventilatory support which included
Continuous Positive Airway Pressure (CPAP), Intermittent Mandatory Ventilation (IMV), IMV
+ Patient-Trigger Ventilation (PTV), High Frequency Positive Pressure Ventilation (HPPV),
High Frequency Oscillatory Ventilation (HFOV) and Nitric Oxide (NO) as a single modality or
in combination. More mature babies were included only if they needed VS or they had died.
For these babies (32 weeks and above) the VS rate was 6,011/7,234 (83.1%) (Table 14).
The overall VS support rate was 82.4% (8564/10387).
CPAP alone as a mode of ventilatory support was given to 1,675 (16.1%) of the babies,
highest rate of use (about 23%) being among babies in gestational age group of 32-36
weeks and BW group of 1501-2500 grams (Tables 15 and 15a). Another 2,433 of the total
10,387 (23.4%) babies was supported with CPAP in combination of other VS modes, most
commonly IMV.
HFOV is a specialized form of mechanical ventilation given at 8-15 hertz per second, in
contrast to conventional IPPV which is given at about one breath or less per second.
In all three years, 70% of ventilated babies were more than 32 weeks gestation and birth
weight of more than 1500 grams (Tables 14 & 14a, Fig 17).
3.8 Morbidity
There is a high rate of morbidity amongst babies admitted to a level III NICU. These are
principally associated with preterm births and complications arising in term babies
necessitating ventilatory support.
The criteria for entry into study have selected those babies most at-risk of morbidity and
mortality. The outcomes reported are those identifiable while the baby is in hospital, and
many of these outcomes have also been shown to be predictors of later morbidity.
3.8.1 Specific conditions in relation to respiratory morbidity
3.8.1.1 Respiratory distress
The adaptation to life outside the uterus can cause problems for both preterm and term
babies. Respiratory distress is a major cause of morbidity and accounts for a large
proportion of the use of resources in these sick babies.
For preterm babies who survived, the duration of ventilatory support increased with
decreasing gestational age. Duration of VS for term survivors however was slightly longer
on average (Mean of 5+/- 9 days) compared to borderline preterm babies of 32-36 weeks
gestation. (Mean of 4+/- 6 days) who survived (Table 19).
For very low birth weight babies who survived, the duration of ventilator support was
highest in the birth weight group of 501-1000 grams. The duration was surprisingly low in
the survivors below 500 grams birth weight and this might have been due to their being
small of gestational age (Fig. 18).
3.8.1.2 Respiratory distress syndrome & exogenous surfactant
Respiratory distress syndrome (RDS) was the predominant respiratory diagnosis for babies
in this study, being present in 4,567 out 10,387 (44%), out of whom 4,226/4,567 (92.5%) in
the year 2006 needed ventilatory support (Table 41, Figs. 19,20). Ventilatory support
includes the use of continuous positive pressure ventilation (CPAP) only as well as CPAP
with other modes of ventilation.
Seventy-nine percent of babies with gestation < 32 weeks had RDS, of which 91.1%
(2,269/2,492) and 11.6% (288/2,492) of these babies with RDS received ventilatory support
and CPAP only respectively. (Table 60a and 60b)
Exogenous surfactant is a treatment primarily for RDS and is given soon after birth via the
endotracheal tube. Its efficacy was confirmed by a systematic review (Soll, 2003) and this
treatment in the Malaysian Clinical Practice Guideline (CPG) is recommended for babies
who are ventilated for RDS. In this study, of the 4,226 babies in 2006 who had RDS and
required ventilatory support, 2,386 (56.5%) were treated with surfactant (Table 41, Figs. 19,
20).
3.8.1.3 Chronic lung disease
Chronic lung disease in this study was captured as supplemental oxygen at Day 28 and also
again at 36 weeks corrected age. Among ELBWs, the rates of supplemental oxygen use at
Day 28 and 36 weeks corrected gestation were 18.9% and 5.5% respectively, a drop from
46.2% and 18.3% respectively in 2004. The rates among babies with birthweights 1001-1500
grams were 7.0% and 2.3% at Day 28 and 36 weeks respectively. (Table 39 and 39a)
The effect of postnatal corticosteroids on the combined outcome of death or CP varies with
the level of risk for CLD. With risks for CLD below 35%, corticosteroid treatment significantly
increased the chance of death or CP, whereas with risks for CLD exceeding 65%, it reduced
this chance
2.
On the basis of limited short term benefits, the absence of long term benefits,
and the number of serious short and long term complications, The American Academy of
Paediatrics and the Canadian Pediatric Society published a joint statement in 2002 and
updated in February 2008, that the routine use of systemic dexamethasone for the
prevention or treatment of CLD in infants with VLBW is not recommended. Outside the
context of a randomized controlled trial, the use of corticosteroids should be limited to
exceptional clinical circumstances (e.g., an infant on maximal ventilatory and oxygen
support)
3.
The use of postnatal steroids at the lowest possible dose, if at all, is recommended only for
ventilator dependent babies on high settings where its benefit outweighs the risk of
poorer central nervous system (CNS) outcome and other adverse effects of
dexamethasone.
3.8.1.4 Congenital pneumonia (C Pneu)
There were 2,038 babies with congenital pneumonia of which 246 (12.1%) died (Figure 23).
Twenty-six percent of babies with birthweight of more than 2500 grams were ventilated for
congenital pneumonia. (Table 33a)
3.8.1.5 Meconium aspiration syndrome (MAS)
There were 786 babies with MAS, 139 (17.7%) died (figure 23). Twenty percent of babies
>2500 gm birth weight were ventilated for MAS.
3.8.1.6 Pneumothorax (PTX)
Of the 10,387 infants admitted to the NICUs in the network, 505 (4.9%) of them developed
pneumothorax. All birthweight groups were affected with 42% of the affected infants being
big infants of birthweight >2500g. More than 55% of infants affected were preterm.
Mortality was high as 45.1% of the infants died (Fig. 18). In fact, the more preterm the
infants, the higher the mortality. When compared with infants without pneumothorax,
significantly higher proportions of infants with pneumothorax had meconium aspiration and
were on ventilatory support.
The large number of infants with this preventable condition in
the network warrants further attention to find ways to minimize this problem. Ventilatory
strategies should be reviewed to look into ways to reduce this problem. Prevention
strategies towards meconium aspiration syndrome should also be looked into.
3.8.2 Hypoxic ischaemic encephalopathy (HIE)
Majority (80.4%) of babies admitted with HIE weighed more than 2500g. In heavier babies
weighing more than 4500 grams, more than 25% were admitted because of HIE.
Of the 964 babies with HIE, 69.4% had mild or moderate HIE and 30.6% had severe HIE (Fig.
23). Severe HIE was more common among the outborns (44.6%) than the in-born infants
(27.5%) with HIE. Mortality was highest among babies with severe HIE, as 70.2% of them
died when compared with 10.7% of babies with mild to moderate HIE. When compared with
inborns with HIE, the mortality rate of outborn was higher (inborn 23.2 % versus outborn
40%).
3.8.3 Neonatal encephalopathy (NE)
A smaller number of babies (147) had NE of ‘non-HIE aetiology’ and mortalilty in this group
was 38.8% (Figure 23).
3.8.4 Intraventricular haemorrhage
Ultrasound imaging of the head of very preterm babies is performed to detect both
intraventricular haemorrhage (IVH) and the formation of cysts and ventricular dilatation
(hydrocephalus). An initial ultrasound is generally performed during the first week of life to
detect signs of IVH. These IVHs are graded according to an internationally recognized
method
4. Grade 1 and 2 are milder grades and generally do not affect outcome adversely
while Grade 3 and 4 are not only associated with early morbidity and mortality but are also
markers of possible later disability.
Of the 3,536 babies with BW 501-1500 grams, 2,410 (68.2 %) had CUS. This means a slight
increase from the two previous years (60% and 67.4% for 2004 and 2005 respectively), but it
is still quite far from the targeted CUS for all babies in this weight category (Vermont Oxford
network achieved 91%). The rates of cerebral ultrasound scanning for various birthweight
groups in the MNNR in 2006 are shown in Table 26.
Fig. 23 Frequency of various neonatal conditions and Mortality
0 Survived 3713 277 293 699 92 1106 367 647 1783 90
Among the babies in this birth weight group who underwent cerebral ultrasound scanning
(
CUS), 292 (12.1% versus 9% in the Vermont Oxford network) had Grade 3 or 4 IVH. The
combined mortality rate from Grade 3 and 4 IVH was 54.8% (Table 33). In 2005, IVH grade 3
and 4 were equally common (12.1 %) but the mortality rate for this group of babies was
higher (60.3%). In figure 24, the numbers of babies with grade 1 to grade 4 IVH are
compared between 2006 and the two previous years.
Of all babies receiving ultrasound examination, grade 4 was found in 5.2% in 2006
(compared to 4.1% in 2004 and 4.0% in 2005). This slightly higher percentage of grade 4 IVH
may reflect a higher proportion of the small ELBW receiving active intervention.
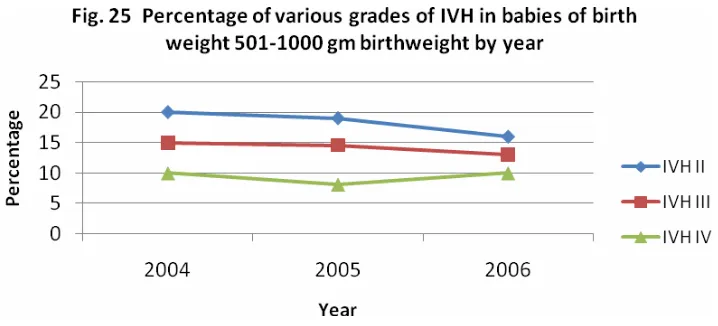
Figures 25 and 26 show the higher incidence of IVH in babies less than or equal to 1000gm
birth weight. There is a downward trend in the percentage of babies screened with grade II
IVH, over the three years. There is not much change in the percentage of higher grades of
IVH amongst the babies who had ultrasound screening for IVH. In 2006, 10% of the ELBW
babies and 3% of the babies of birthweight of between 1001-1500 grams had grade IV IVH.
Further reduction of Grade III and Grade IV IVH is still possible with enhanced neonatal
services.
Fig. 24 Incidence of IVH 2004-2006
0 200 400 600 800 1000 1200 1400 1600 1800
None Grade 1 Grade 2 Grade 3 Grade 4