In the four years since the complete sequence of a genome was first reported1, there has been a dramatic increase in DNA sequence infor-mation for plants. Notably, the Synechocystis PCC6803 genome has been sequenced2; a second photosynthetic prokaryote genome is .40% complete (see Box 1); over one-third of the Arabidopsisgenome sequence is complete (see Box 1); and a genome sequencing project has been initiated for rice3. In addition, ap-proximately 25 000 non-redundant Arabidopsis cDNA sequences are currently available4and EST projects for a wide range of agricultural crops are being contemplated.
How will we make use of this wealth of sequence information? One of the most powerful tools that has recently been devel-oped to bridge the gap between sequence information and functional genomics is DNA microarray technology. Here, we briefly out-line the salient features of this technology and discuss some of its potential applications to plant biology.
An overview of DNA microarray technology
Thus far, two general types of microarrays have been developed: DNA fragment-based microarrays5, and oligonucleotide-based micro-arrays6. Here we focus primarily on the DNA fragment-based microarrays and reference to oligonucleotide-based microarrays is solely to provide contrasting examples. Detailed de-scriptions of the technical aspects of generat-ing and usgenerat-ing DNA microarrays are available7,8, and several groups provide descriptions of the instrumentation, methods and sample micro-arrays via the Internet (Box 1).
DNA fragment-based microarrays
Microarrays are formed by robotically de-positing specific fragments of DNA at indexed locations on microscope slides (Fig.1). The fragments can originate from a variety of sources including anonymous cDNA clones, EST clones, anonymous genomic clones, or DNA amplified from open reading frames (ORFs) found in sequenced genomes. With
currently available technology, it is feasible to array up to 10 000 spots/3.24 cm2. Thus, in theory, all 20 000–25 000 Arabidopsisgenes can be displayed on a standard microscope slide.
Once produced, the microarrays are hy-bridized with fluorescently-labeled mRNA-derived probes (Fig. 1). After removing the unbound probe, the fluorescent probe that has hybridized to DNA fragments on the micro-array is excited by light. The fluorescent sig-nal emitted from each spot is a reflection of the abundance of the corresponding sequence in the original probe. Because the detection is fluorescence based, the signal output is very sensitive, and individual mRNA species can be detected at a threshold of 1 part in 100 000 (Ref. 9) to 1 part in 500 000 (Ref. 10). Also, the signal output has a broad dynamic range, so both weak and strong signals can be monitored on the same microarray. Thus, quantitative information about mRNA levels for a large number of genes can be collected concurrently. Microarray technology is ideally suited for making pair-wise comparisons of samples5,8. Two fluorescent tags, with different excitation and emission optima, can be used to label two
distinct probes (e.g. two mRNA populations from physiologically or genetically distinct samples). The two probes are mixed and al-lowed to hybridize to the same microarray, thereby eliminating any differences associated with the hybridization process (Fig. 1). For each DNA fragment in the microarray, the ratio of fluorescence emission at the two wave-lengths reflects the ratio of the abundance of that sequence in the two probes. A ratio of two or greater is generally accepted as signifi-cant10,11. Improved statistical methods to assess the limits of resolution may refine this estimate.
Advantages and disadvantages to DNA fragment-based microarrays
Oligonucleotide-based microarrays, in par-ticular those produced by photolithography methods, have very high densities (250 000 oligonucleotides/cm2) and are inherently more consistent from array to array in comparison to DNA fragment-based microarrays7,8. The inherent potential of misplacing clones when handling the thousands of clones required to construct DNA fragment-based microarrays can also be avoided with oligonucleotide-based microarrays, because the oligonucleotides are
38
trends in plant science
update
January 1999, Vol. 4, No. 1 1360 - 1385/99/$ – see front matter © 1999 Elsevier Science. All rights reserved. PII: S1360-1385(98)01354-5
DNA microarrays
for studies of
higher plants
and other
photosynthetic
organisms
Box 1. Internet resources for DNA microarrays
Sequencing projects
Web site for the Rhodobacter capsulatussequencing project at the University of Chicago, Dept of Molecular Genetics and Cell Biology, directed by Randal Cox: http://capsulapedia. uchicago.edu
Web site for theArabidopsis thaliana Database: Arabidopsis Genome Initiative (AGI) Totals. The AGI was established in 1996 to coordinate large-scale sequencing efforts: http://genome-www3.stanford.edu/cgi–bin/webdriver?Mlval5atdb_agi_total
Web site listing sequenced organelle genomes at the Entrez browser provided by the National Center for Biotechnology Information, Bethesda, MD, USA (which also builds, maintains and distributes the GenBank Sequence Database): URL: http://www.ncbi.nlm. nih.gov/Entrez/Genome/euk_o.html
DNA microarrays at public institutionsa
Web site for Pat Brown’s Microarray group at Stanford University. This site provides de-tailed protocols and descriptions of the parts required to construct an arrayer and a scanner. Examples of yeast microarray data are also included: http://cmgm.stanford.edu/pbrown/ array.html
Web site from the Technology Development Group of the Stanford Genome Center, directed by Ron Davis:
http://sequence-www.stanford.edu/group/techdev/index.html
Web site for the Microarray group within the National Human Genome Research Institute. Detailed protocols, descriptions of arrayer and scanner design, and analysis software are given. Also, links to commercial vendors are provided:
http://www.nhgri.nih.gov/DIR/LCG/15K/HTML/
Web site for the Microarray group in Lee Hood’s group at the University of Washington, Dept of Molecular Oncology and Development. Descriptions of microarray based approaches under development are given including ink-jet-based methods of in situ oligonu-cleotide synthesis:
http://chroma.mbt.washington.edu/mod_www/
synthesized in situon the basis of gene se-quences obtained directly from sequence data bases. Furthermore, because the sequence that hybridizes in oligonucleotide-based micro-arrays is very short (i.e. 20–25 nucleotides), the hybridization reactions are very sensitive to single nucleotide mismatches, unlike DNA fragment-based microarrays. This makes oligo-nucleotide-based microarrays particularly well-suited to genotyping or resequencing applications12. The major disadvantage of oligonucleotide-based microarrays is that their construction depends on the availability of accurate sequence data. For this reason, the only photosynthetic organisms for which we can contemplate building oligonucleotide-based microarrays at the present time are Synechocystis PCC6803, Rhodobacter capsu-latusand Arabidopsis. Conversely, sequence information is not required for the construc-tion of DNA fragment microarrays, and this type of microarray is more appropriate for the majority of plant species. In comparison to dot blots of clones arrayed on membrane fil-ters, microarrays are more sensitive, exhibit a broader dynamic range and permit simultan-eous analysis of two complex probes (compare Refs 9 and 13). Thus, although dot blots may
be appropriate for small scale, speciality ar-rays, only microarrays can provide genome-scale analyses of gene expression patterns.
Shared data management and analysis One significant implication of DNA micro-array technology is that many identical ar-rays can be produced to serve as a common experimental platform among researchers. If coupled to the development of centralized data bases, researchers will be able to search across multiple data sets for interesting expression patterns. Just as the nucleic acid and protein sequence data bases depend on input from many groups, public microarray expression data bases will similarly stimulate a level of analysis that is not possible with narrowly defined data sets. The development of soft-ware tools to identify groups of co-regulated genes will lead to the discovery of shared pro-moter motifs, signal transduction pathways and transcription factors11. For example, tran-scription factors are key determinants of developmental and physiological processes, and exploitation of gene expression data gen-erated with DNA microarrays will help in identifying targets for genetic manipulation and crop improvement.
Transcript accumulation studies in higher plants
DNA microarray technology allows an inte-grative analysis of gene expression patterns, so that, for the first time, scientists will be able to assess the impact of a specific treatment, environmental factor or developmental stage on all aspects of plant biology. Because the output is quantitative, subtle changes in gene expression can be detected, in addition to the more dramatic changes observed with such techniques as subtractive hybridization and differential display. Moreover, DNA micro-array analysis can be used to identify genes that are unaffected, as well as those that show reduced transcript accumulation (Fig. 2). Such broad-based views of genome-wide gene ex-pression patterns are likely to transform our understanding of basic physiological pro-cesses in plants and to provide new avenues for studying intractable, complex traits, such as heterosis.
Although DNA microarrays offer signifi-cant advantages for gene expression studies, they do have limitations. The current meth-ods of producing probes for eukaryotes rely on significant amounts of poly(A)1RNA. Improvements in protocols that would permit
39
trends in plant science
update
January 1999, Vol. 4, No. 1
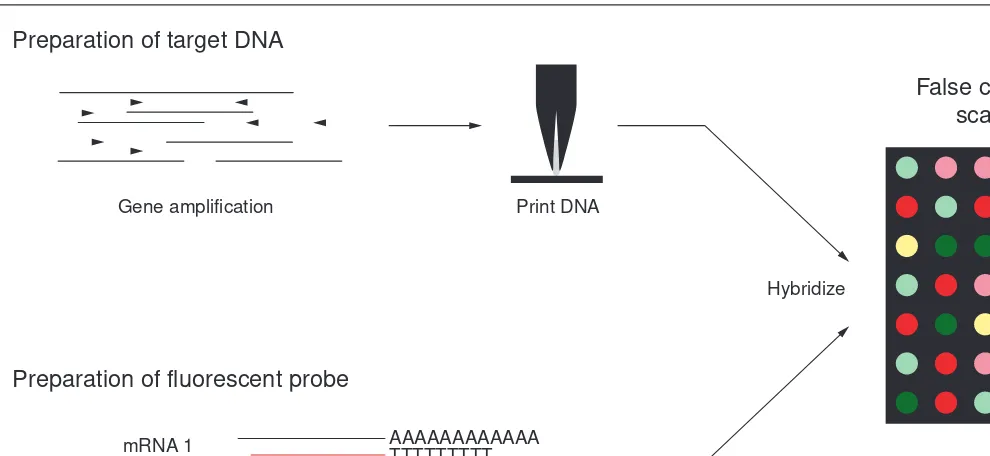
Fig. 1. The principal steps in producing and utilizing DNA microarrays. Target DNAs to be printed on microscope slides are prepared by PCR-amplifying inserts from clones or ORFs from genomic DNA. The PCR products are spotted onto a microscope slide at indexed locations using quills. At present, 10 000 distinct DNA samples (genes) can be spotted on an area of 3.24 cm2. Probes from two independent samples are pre-pared by labeling with fluorescent nucleotides (e.g. Cy3-dCTP and Cy5-dCTP). The two probes are mixed together and hybridized to a micro-array in a small volume under a coverslip. After washing off the unbound probe, the fluorescent signal associated with each element of the microarray is ‘read’ with a dual laser scanning device and images are captured with a photomultiplier tube (PMT). Quantitative values for the signals for each probe and the ratio of signals for the two probes can be calculated using various software programs. Abundant mRNA species are represented by spots on the microarrays that are highly fluorescent and rare mRNA species by spots that exhibit weak fluorescence. The result is often displayed as a false-color image, as depicted in the diagram, in which yellow indicates the two signals which were similar in intensity (i.e. the gene was expressed at similar levels in the two mRNA populations), red indicates that the ‘red’ probe signal was stronger and green indicates that the ‘green’ probe signal was stronger.
False colour image of scanned slide Preparation of target DNA
Preparation of fluorescent probe
Gene amplification
Fluorescent cDNA synthesis mRNA 1
Print DNA
Hybridize
AAAAAAAAAAAA TTTTTTTTT
the use of poly(A)1RNA from small tissue samples or even from single cells would ex-tend the usefulness of the technique. As with northern blots, DNA microarrays provide information about transcript levels, and ad-ditional studies are required to ascertain whether altered transcript levels reflect changes in synthesis or turnover. As with other hybridization-based methods, cross-hybridization among closely related gene fam-ily members may occur, so confounding the analysis of gene expression of individual fam-ily members. Also, not all genes that partici-pate in a process exhibit changes in transcript levels. For example, in some signal transduc-tion pathways, regulatransduc-tion occurs at the level of phosphorylation or dephosphorylation of the gene product. Developments in the com-plementary field of proteomics will provide the tools needed for global analyses of changes in polypeptides14.
Potentially, the DNA microarray technol-ogy is also a powerful tool for new gene dis-covery. One or a few genes are typically used as marker genes for any given plant process. However, with the ability to survey large
numbers of genes, more specific marker genes are likely to be identified. As an example, new heat-shock responsive genes were identified in a survey of 1000 random cDNA clones, sug-gesting that even for well-studied processes new gene candidates can be discovered10. Marker genes may prove useful in studies to monitor plant responses and in screens for mutants that exhibit altered regulation or expression patterns of marker genes.
One challenge facing plant biologists is in assigning functions to the large numbers of genes being identified in the various sequenc-ing projects. Many genes that are currently classified by sequence similarity to known genes remain poorly defined in terms of their specific roles in plant growth and develop-ment. By determining expression patterns of genes across a wide range of developmental and environmental conditions, it may be poss-ible to develop hypotheses about the specific functions of these genes. These hypotheses can then be tested by over- or under-express-ing the gene in transgenic plants and monitor-ing changes in morphology or physiological competence.
Finally, DNA microarrays can be used to screen populations of plants for poly-morphic ‘expression fingerprints’ which, to-gether with the rich genetic resources in many plant species (e.g. natural accessions; trans-genic lines; mutants; near-isotrans-genic lines; and substitution lines) can be used to identify genes or groups of genes involved in specific plant processes. Once a distinct expression fingerprint has been correlated with a com-plex process, such as drought tolerance, this expression fingerprint can potentially be used as a tool to evaluate new genetic materials for the trait in conjunction with phenotypic tests.
The first DNA microarrays were con-structed for Arabidopsis5,9, but DNA micro-array analysis can also be applied to species for which we have no EST or genomic se-quence data7. Microarrays can easily be pre-pared using random clones from normalized cDNA libraries. Clones exhibiting interesting expression patterns can be sequenced and fur-ther characterized. This is a promising strat-egy for gene discovery in exotic species with novel properties.
Transcript accumulation studies in photosynthetic prokaryotes and chloroplasts
Photosynthetic prokaryotes are excellent model systems for DNA microarray analyses because of their relatively small genome size and the wide range of regulatory mutants available. The SynechocystisPCC6803 gen-ome contains 3168 deduced protein coding sequences2and the Rhodobacter capsulatus genome is only three quarters the size of the E. coli genome15. Thus, the construction of DNA fragment microarrays containing en-tire genomic complements of ORFs should be straightforward. These microarrays will be particularly useful for global analyses of gene expression under various environmental con-ditions. Such studies can be conducted using both wild type and known regulatory mutants to discern what portion of any global re-sponse is controlled by a specific regulatory factor. Furthermore, microarray-based gene expression analyses are not limited to or-ganisms with sequenced genomes. The small genome size of photosynthetic prokaryotes allows indexed genomic libraries containing 3–5 kbp inserts to be arrayed; 5000–10 000 spots will typically be sufficient for com-plete coverage of most genomes of this type. Some redundancy will exist in such microarrays, and clones corresponding to spots of interest will need to be sequenced after being identified. However, this is an attractive approach for researchers studying organisms with unique physiological re-sponses but whose genomes have not been sequenced.
40
trends in plant science
update
January 1999, Vol. 4, No. 1
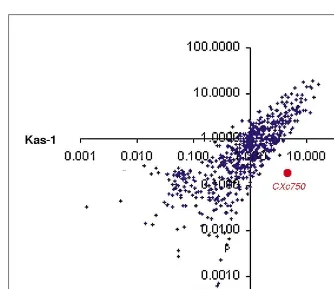
Fig. 2. Scatter plot comparing the mean hybridization signal of 673 genes for two
Arabidopsisaccessions, Columbia (n53) and Kas-1 (n54). Probes were prepared from poly(A)1RNA from rosette leaves. The hybridization signals are plotted on a log-log scale. Although the majority of genes are expressed at similar levels in the two accessions, a small number of genes exhibit variation in expression levels between Columbia and Kas-1. Two such genes are highlighted in red. CXc750 is a pathogen-inducible gene that has been reported previously to be expressed in uninfected Columbia22
To date, sequencing projects have been completed for 13 higher plant chloroplast genomes16, and three plant and two Chlamy-domonas spp. mitochondrial genomes (see Box 1). The small number of ORFs that such genomes typically contain can easily be examined on DNA fragment microarrays. Many key photosynthetic complexes consist of components that are encoded by both the chloroplast and nuclear genomes. DNA microarrays would allow transcripts from each chloroplast ORF to be analysed relative to the expression patterns of their nuclear-encoded counterpart. The regulation of gene expression in developing and mature chloro-plasts is known to occur at both transcriptional and post-transcriptional levels17 and micro-arrays will be useful in determining tran-script levels of chloroplast genes under a variety of developmental stages and environ-mental conditions. Similar kinds of experi-ments could be envisioned for mitochondrial genes. In addition, several chloroplast and mitochondrial mRNAs undergo complex splicing events, including trans-splicing18. The nature and relative frequency of these events could potentially be monitored with DNA microarrays19.
Speculative applications
A range of applications of DNA fragment-based microarrays have been described8. The technique can also be used in a ‘reverse Southern’ procedure to identify gross DNA polymorphisms in various genetic materials. For example, segments altered in deletion or substitution lines can be determined using comprehensive DNA microarrays. Such an approach would be helpful in characterizing collections of mutants and assessing more global changes in genome structure in natu-ral populations. One caveat is that this ap-plication is likely to be limited to organisms with smaller genomes20. In addition, the in-sertion sites of transposable elements or T-DNAs can potentially be ascertained using DNA microarrays7. Finally, microarrays constructed of genomic fragments might be used in south-western experiments with fluorescently-labeled DNA binding proteins to determine candidate target genes for the binding proteins.
Conclusion
At present, researchers often have only a limited knowledge of areas of plant biology beyond their immediate field of study. How-ever, growth and development is an inte-grative process that reflects the genotype and life history of a plant. We anticipate that DNA microarray technology will revolutionize our understanding of plant processes by providing a global perspective of responses to environ-mental and developenviron-mental changes.
Most applications outlined in this article are based on determining transcript accumulation patterns. However, it is likely that DNA microarray technology and its uses will evolve rapidly over the coming years as better instru-ments for preparing microarrays and better software programs for analysing data from microarrays are developed.
Acknowledgements
We would like to thank our colleagues at Stanford for providing us with access to their equipment and for their advice. In addition, we would like to thank the many plant researchers with whom we have discussed the DNA microarray technology. Their questions, concerns and suggestions have framed the arguments presented in this article. Carnegie Institution of Washington publication #1400. This work was sup-ported in part by the Carnegie Institution of Washington, NSF, US-DOE and the USDA.
References
1Fleischmann, R.D. et al.(1995) Whole-genome random sequencing and assembly of
Haemophilus influenzaeRD, Science269, 496–512
2Nakamura, Y. et al.(1998) Cyanobase, a WWW database containing the complete nucleotide sequence of the genome of Synechocystissp. strain PCC6803, Nucleic Acids Res.26, 63–67
3Sasaki, T. (1998) The rice genome project in Japan, Proc. Natl. Acad. Sci. U. S . A.95, 2027–2028
4Rounsley, S.D. et al.(1996) The construction of Arabidopsis expressed sequence tag assemblies, Plant Physiol. 112, 1177–1183
5Schena, M. et al.(1995) Quantitative monitoring of gene expression patterns with a
complementary DNA microarray, Science 270, 467–470
6Lipshutz, R.J. et al.(1995) Using oligonucleotide probe arrays to access genetic diversity, BioTechniques19, 442–447
7Lemieux, B., Aharoni, A. and Schena, M. (1998) DNA chip technology, Mol. Breed. 4, 277–289
8Eisen, M.B. and Brown, P.O. DNA arrays for analysis of gene expression, Methods Enzymol. (in press)
9Ruan, Y., Gilmore, J. and Conner, T. (1998) Towards Arabidopsis genome analysis: monitoring expression profiles of 1400 genes using cDNA microarrays, Plant J.15, 821–833
10Schena, M. et al.(1996) Parallel human genome analysis: microarray-based expression monitoring of 1000 genes, Proc. Natl. Acad. Sci. U. S. A. 93, 10614–10619
11DeRisi, J.L., Iyer, V.R. and Brown, P.O. (1997) Exploring the metabolic and genetic control of gene expression on a genomic scale, Science278, 680–686
12Wang, D.G. et al.(1998) Large-scale identification, mapping and genotyping of single-nucleotide polymorphisms in the human genome, Science 280, 1077–1082
13Desprez, T. et al.(1998) Differential gene expression in Arabidopsis
monitored using cDNA arrays, Plant J. 14, 643–652
14Pennington, S.R. et al. (1997) Proteome analysis: from protein characterization to biological function, Trends Cell Biol.7, 186–173
15Vlc˘ek, C. et al. (1997) Sequence of a 189-kb segment of the chromosome of Rhodobacter capsulatusSB1003, Proc. Natl. Acad. Sci. U. S. A.94, 9384–9388
16Korab-Laskowska, M. et al.(1998) The organelle genome database project (GOBASE), Nucleic Acids Res.26, 138–144
17Gruissem, W. (1989) Chloroplast gene expression: how plants turn their plastids on, Cell56, 161–170
18Wissinger, B., Brennicke, A. and Schuster, W. (1992) Regenerating good sense: RNA editing and transsplicing in plant mitochondria, Trends Genet. 8, 322–328
19Giege, P. et al. (1998) An ordered Arabidopsis thalianamitochondrial cDNA library on high-density filters allows rapid systematic analysis of plant gene expression: a pilot study, Plant J.15, 721–728
20Shalon, D., Smith, S.J. and Brown, P.O. (1996) A DNA microarray system for analysing complex DNA samples using two-color fluorescent probe hybridization, Genome Res.6, 639–645
21Marshall, A. and Hodgson, J. (1998) DNA chips: an array of possibilities, Nat. Biotechol.16, 27–31
22Aufsatz, W. and Grimm, C. (1994) A new, pathogen-inducible gene of Arabidopsisis expressed in an ecotype-specific manner, Plant Mol. Biol. 25, 229–239
41
trends in plant science
update
January 1999, Vol. 4, No. 1
David M. Kehoe
Dept of Biology, Indiana University, Bloomington, IN 47405, USA
Per Villand and Shauna Somerville*
Dept of Plant Biology, Carnegie Institution of Washington, Stanford, CA 94305, USA
*Author for correspondence