11 (2001) 69 – 87
Pre- and post-1987 crash frequency domain
analysis among Pacific Rim equity markets
Kenneth L. Smith *
Department of Economics,Finance,and Banking,Kelce College of Business,Pittsburg State Uni6ersity, Pittsburg,KS66762,USA
Received 12 February 1999; accepted 16 February 2000
Abstract
This paper uses the method of cross spectral analysis to examine pre- and post-1987 crash comovements among several Pacific Rim markets. The results support increased post-crash comovements among the markets. Each of the pairwise median coherences was greater in the post-crash period. The same is true for the post-crash mean coherences, with one exception. The nonparametric Wilcoxon Z statistics indicate that the pre- and post-crash coherences were drawn from different populations in seven of the eight pairwise market comparisons. Phase lead results indicate that the post-crash phase leads in four of the eight pairwise comparisons were smaller than in the pre-crash period, while post-crash phase leads did not fall in any of the market comparisons. © 2001 Elsevier Science B.V. All rights reserved.
JEL classification:G15
Keywords:Cross spectral analysis; Equity comovements; Diversification
www.elsevier.com/locate/econbase
1. Introduction
Increased world trade has intensified the interest in the integration of world equity markets. Along with increased trade, increases in communications and capital flows have contributed to the globalization of business activity. It has long been a tenet of investment that international diversification can reduce risk in portfolios. Increasing equity market integration tends to reduce this diversification,
* Tel.: +1-316-2354592; fax: +1-316-2354578. E-mail address:[email protected] (K.L. Smith).
K.L.Smith/J.of Multi.Fin.Manag.11 (2001) 69 – 87 70
reducing the benefit of reduced risk. The question is, ‘Are equity market movements around the world disparate enough to provide the diversification benefit?’ Even though trade, communications, and capital flows have tended to make the world ‘smaller’, to what extent is international equity diversification a benefit to investors? There are now many articles, using differing methods, which examine the comovement of equity markets around the world. One of the most used methods is the ARCH/GARCH family of models, which test for volatility spillovers. Darbor and Deb (1997) used bivariate GARCH models (December 1989 through December 1992) to conclude that each bivariate pair (Japan/Canada, UK/Canada, US/ Canada, UK/Japan, US/Japan, UK/US) of markets showed evidence of ‘transitory correlation’. Only the US/Japan pair indicated a lack of ‘permanent correlation’. Employing the trivariate EGARCH model, Koutmos and Booth (1995) found price spillovers from New York to Tokyo and London, and from Tokyo to London. Susmel and Engle (1994) used a bivariate ARCH model with hourly data and found volatility spillovers last, ‘only an hour or so’. Theodossiou and Lee (1993) employed the multivariate GARCH-M model to find volatility spillovers among a subset of five markets (US, UK, Canada, Germany, and Japan) from January 1980 to December 1991. Hamao et al. (1990) used a trivariate GARCH model with daily data (April 1985 to March 1988) to test for volatility spillovers from New York, London, and Tokyo. They presented evidence of volatility linkages. Booth et al. (1997) employed a trivariate VAR to investigate volatility spillovers in US, UK, and Japanese equity index futures markets. These results indicated that volatility in the US and UK markets is a reaction to shocks from the other markets, supporting the argument that these markets are becoming more interdependent. The Japanese stock index futures markets appear somewhat more isolated.
Other methods, which focus on price spillovers, have been used as well to study market linkages. Koch and Koch (1991) estimated an eight market (Japan, Aus-tralia, Hong Kong, Singapore, Switzerland, West Germany, UK, and the US) simultaneous equations model for three separate years: 1972, 1980, and 1987. They found evidence of, ‘several clusters of markets that display substantive interaction on the same day’. Brocato (1994) estimated six market (US, UK, Canada, Ger-many, Hong Kong, and Japan) VARs: one for the early 1980s and another for the latter years of the 1980s. His variance decompositions yielded many linkages among these markets, with the US role diminishing post-March 1984. Eun and Shim (1989) estimated a nine market (US, UK Canada, France, Germany, Switzerland, Hong Kong, Japan, and Australia) VAR and concluded that a substantial amount of ‘interdependence’ existed among these markets: 1980 – 1985.
5-year subperiods. The final test compared the correlation matrices for two 7.5-year subperiods. They rejected the null hypothesis that correlation matrices are the same over shorter periods (1.5- and 3-year subperiods), but were not able to reject that the longer term (5- and 7.5-year subperiods) correlation matrices are the same. In both of these studies, longer term comovements were more correlated, making diversification more applicable in the near term. The results reported below, using cross spectral analysis, lend support to this conclusion.
Institutional changes made following the crash period make 1987 a breakpoint from which pre- and post-crash observations can be compared. Lindsey and Pecora (1998) detailed the domestic regulatory changes to make the markets more efficient. Internationally, markets around the world have recognized the need for greater coordination in regulation and have taken steps to ensure cooperation. Accord-ingly, there are several papers which use this breakpoint to compare pre- and post-1987 crash comovements. Masih and Masih (1997) employed a battery of tests to determine if comovements increased in the post-1987 period. They reported, using Granger causality tests, that since the crash the US market has led other markets (Canada, UK, Germany, France, and Japan). Their vector error correction model and variance decomposition tests indicated that the German and UK markets have become more dependent on shocks from other markets in the post-crash period. Arsanapalli and Doukas (1993) used cointegration tests to show that comovements among UK, German, French, and Japanese markets increased post-1987. Jeon and Von Furstenburg (1990) employed a four market (US, UK, German, and Japan) VAR analysis to conclude that, ‘The degree of international comovements in stock price indexes has increased significantly since the crash of October 1987’.
Most of the above studies used time series methods to investigate market comovements. Granger and Morgenstern (1970) were the first researchers to apply frequency domain methods to comovements among equity markets. Hilliard (1979) estimated mean coherences among ten markets (US, Amsterdam, Frankfurt, Lon-don, Milan, Paris, Sydney, Tokyo, Zurich, and Toronto). He concluded that ‘intra-continental’ prices moved together, with little ‘inter-continental’ comovements.
pre-K.L.Smith/J.of Multi.Fin.Manag.11 (2001) 69 – 87 72
and post-crash samples are used, would the lack of causality continue to hold? Smith et al. (1993) have shown that, using a rolling Granger causality test, somewhat greater causality existed after the crash (their sample ends in June 1991). Even more high frequency data are now available to study the issue of both pre-and post-crash comovements. Smith (1999) used cross spectral analysis along with a longer sample period. He found increased coherence among six major equity markets, particularly among the three European markets studied (UK, Germany, and France). Most pre-/post-crash research described above has focused on the G-7 (or a subset of the) markets (e.g. see Darbor and Deb (1997), Masih and Masih (1997) and Smith (1999)).1
It is the purpose of this paper to investigate these pre-/post-correlations for Pacific Rim markets. This study includes two markets that are not part of the Group of Seven. Cross spectral analysis is applied to eight pairwise combinations of coherence and phase leads from data for Australia and Hong Kong, as well as the US, Canada, and Japan.
2. Data
The individual stock market indexes are constructed from country data compiled by Morgan Stanley International Capital Perspectives. The raw stock data for each of the country markets consist of the daily value-weighted composite index level. Each index is composed of stocks that broadly represent the stock compositions in the different countries. All indexes are normalized to unity at a common date (January 1, 1970=100). Each normalized stock market level is converted to a rate of return with the transformation ln(Pi,t)−ln(Pi,t−1) (=Ri,t for the ith country), where Pi,t and Pi,t−1 are the levels of the index (using closing prices) in periods t
and t−1, respectively, for the ith country. The data are measured in local currencies. Measuring the indexes in dollar terms would weaken the measurement of equity market integration by including exchange rate movements. Additionally, funds are now able to effectively hedge exchange rate movements. (For other studies using local currencies see Hamao et al., 1990; Malliaris and Urrutia, 1992; Theodossiou and Lee, 1993; Koutmos and Booth, 1995).
The pre-crash sample runs from August 18, 1980 through May 29, 1987. The post-crash period runs from March 8, 1988 through December 16, 1994. Data were available from May 1987 through March 1988. The period surrounding the crash is omitted from the sample. This is due to the volatility during this period. This division in the sample is not completely arbitrary, given the institutional changes to the exchanges following the 1987 crash.
A problem arises when markets around the world open and close sequentially on any given day. The Asian markets close first. As of December 1987, Japan opens first at 16:30 h and closes first at 23:30 h eastern standard time. Australia follows
by opening at 17:00 h, closing at 12:00 h. Hong Kong opens at 19:00 h, while closing at 01:30 h. These markets overlapped in terms of the trading day in real time. Canada and the US market were both open simultaneously from 09:30 to 16:00 h. The problem arises when shocks to the US and Canadian markets originate in the Asian markets. In calendar time this is measured as a contempora-neous shock, yet in real time this shock occurs with several hours of lag time. Kayha (1997) shows that covariances between non-contemporaneous markets are somewhat upwardly biased. While noting this to be the case, any bias which exists is exhibited in both the pre- and post-1987 crash period.
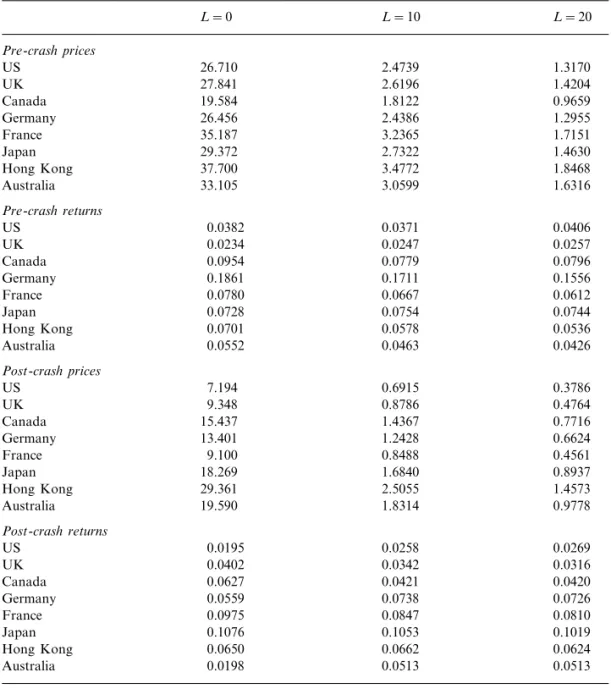
The data must be stationary to perform the appropriate analysis. Kwiatkowski et al. (1992) have shown that a test for stationarity adds to the robustness of conclusions regarding unit root. This test is important due to the low power of Dickey – Fuller tests in rejecting the null hypothesis of unit root. These results are reported in Table 1. Using the KPSS test, stationarity is rejected for the price series, while stationarity cannot be rejected for the return series.
3. Cross spectral analysis
Cross spectral analysis transforms time domain data into the frequency domain. This presents an alternative method to investigate pre- and post-crash correlations among Pacific Rim equity markets. (See Harvey (1994), pp. 235 – 240) for a detailed development of how the coherences and phase leads were estimated.) The estimated coherency spectrum between markets i and j for various frequencies is given by
wˆij=
h.ij(v) (h.ii(v)h.jj(v))
1/2 allv (1)
where hiiand hjj (i"j) are the autospectrum estimated from
h.ii(v)=
Two tools from cross spectral analysis are used: coherence and phase lead. While coherence estimates the correlation in cross spectral analysis, the phase lead indicates which variable leads (lags). Due to Euler Relations and DeMoire’s Theorem the coherence can be written as
h.ij=cˆij+iqˆij (3)
where the quantitiescijandqijare the cospectrum and quadrature, respectively. Eq. (3) may also be written as,
hij= %
s= −
Rij(s)(cos(vs)−isin(vs)) (4)
where the first term on the right hand side of Eq. (4) is the cospectrum and the second term is the quadrature.
K.L.Smith/J.of Multi.Fin.Manag.11 (2001) 69 – 87 74
8(v)=tan−1(
cij/ −iqij). (5)
The phase lead is measured in radians. A coefficient near zero indicates that the variables are in phase; they increase (decrease) simultaneously at a particular frequency. A phase lead of 180° (p) results when the variables are moving inversely
Table 1 1))Stt−s. The null hypothesis of stationarity is rejected if the test statistic is greater than the critical value.
at a particular frequency. Further, a positive phase value indicates that the input variable leads the output variable, while a negative phase value indicates that the input variable lags. Even numbered figures plot the pre- and post-crash phase leads for each of the pairwise markets examined in this study. The input variable is listed first in the title in each figure.
Greater coherence between the markets tends to reduce the benefits of interna-tional diversification. As mentioned above, both Meric and Meric (1989) and Taylor and Tonks (1989) showed that diversification is greater in the short run (high frequency), falling over longer periods (low frequency). The coherence results reported below are consistent with these conclusions and offer an alternative method to test the robustness of these results.
Phase leads can also indicate the degree of benefit of diversification. If markets are out of phase, the benefit of diversification is greater. Diversification is reduced to the extent that markets are in phase (markets are coincidental). Results reported below show that the markets tend to be out of phase at high frequencies, rising at longer frequencies. Thus, benefits of diversification accrue over shorter periods, while falling over longer periods.
4. Results for north American and western pacific markets
Table 2 displays the correlations and peak coherences for the pre- and post-crash periods, as well as the nonparametric Wilcoxon Z statistic which tests whether the pre- and post-crash coherences are drawn from the same population. The correla-tions for any period or pairwise markets are not high. The largest pairwise correlation is 0.2053 for the Japanese/Hong Kong post-crash period. The lowest correlation is that of US/Australia, 0.0183. The frequency domain peak coherences are also shown in Table 2. The largest peak overall coherence is 0.5818 for the pre-crash Canadian/Australian pair of markets. The lowest peak coherence is 0.2415 for the Japanese/Hong Kong pre-crash period.
The descriptive statistics for the coherences are also displayed in Table 2. Both the mean and median coherences are greater in the post-crash period, with one exception. The only case in which the post-crash mean is lower is the Canadian/ Australian mean coherence (0.2747 in the pre-crash, 0.2371 in the post-crash period). The Wilcoxon Z statistics, which test the null that the coherences are drawn from the same population, reject the null in every pairwise combination of markets, except the Australian/Hong Kong pair.2 While the mean and median
coherences are not particularly high, these statistics provide evidence that the post-crash coherences are distinctly higher than the pre-crash coherences.
Variance, skewness, and excess kurtosis statistics are provided in Table 2. These statistics indicate that the coherences, for both periods, are characterized by varying degrees of skewness and excess kurtosis.
K
Correlations, descriptive statistics for coherence, and WilcoxonZbstatistica
Pre- and post-1987 crash
0.0873 0.0183 0.1715 0.1072 0.2053 0.1676 0.1680 0.4010 0.5093 0.3461 0.5818 0.2415 0.3338 0.3665
Peak coherence 0.3141
0.1860 0.2482 0.1714 0.1771 0.1502 0.1667 0.1877 Mean coherence
0.2371
0.2250 0.2659 0.2259 0.2044 0.2108 0.1913 0.1981 0.4035 0.1476 0.0554 −0.1369
0.1542 % Increase in mean coh 0.2097 0.0713 0.3180
0.1616 0.2106 0.1473 0.1749 0.1699
0.0105 0.0145 0.0061 0.0054 0.0017 0.0064 0.0052 Variance
0.0114
0.0093 0.0111 0.0051 0.0091 0.0065 0.0041 0.0076 0.10 −0.10 0.64**
aThe top number in each cell is the statistic for the pre-1987 crash period. The bottom number in each cell is the statistic for the post-1987 crash period.
bThe WilcoxonZstatistic tests the null that the coherences for the two periods are drawn from the same population.
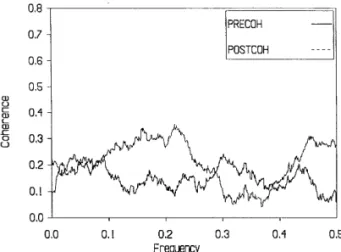
Fig. 1. Coherence between US and Hong Kong indexes: pre- vs. post-crash.
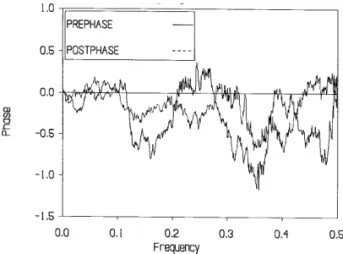
Fig. 2. Phase between US and Hong Kong stock indexes: pre- vs. post-crash.
Fig. 1 shows the coherences between the U.S. and Hong Kong markets before and after the 1987 crash. Generally, the coherence is quite low at high frequencies for both periods, rising at lower frequencies. The peak pre- and post-crash coherences (both about 0.4) occur right around frequency of 0.1 (10 days). Visually, there appears not to be much difference between the coherences for the two separate periods. However, the mean post-crash coherence is greater (0.2203 vs. 0.1751) and the WilcoxonZstatistic (−8.16) rejects that the coherences are drawn from the same population. This evidence indicates that the post-crash coherence is somewhat greater than those of the pre-crash period.
K.L.Smith/J.of Multi.Fin.Manag.11 (2001) 69 – 87 78
leads the Hong Kong market. The US market leads the Hong Kong market at high frequencies and maintains a long lead until a frequency of about 0.25 (4 days). Beyond this frequency the lead of the US market diminishes. The lead at frequency 0.25 is about 3.4 radian, falling to 1 radian by frequency 0.2 (5 days). Beginning with a frequency of 2.0 both markets gradually move toward a pattern where the leads are reduced. In the post-crash period the US leads at all frequencies, gradually moving into phase with the Hong Kong market at low frequencies.
The pre- and post-crash US/Australian coherences are plotted in Fig. 3. As with Fig. 1, the coherences between the US and Australian markets are low at high frequencies, gradually rising at lower frequencies. Peak coherences occur beyond a frequency of 0.1 (10 days). The mean coherences for the two periods show that the average coherence is somewhat greater in the post-crash period (0.2659 vs. 0.2482). Again, the Wilcoxon Z statistic (−4.25) indicates that these data are drawn from distinct populations.
Fig. 3. Coherence between US and Australian indexes: pre- vs. post-crash.
Fig. 5. Coherence between Canadian and Japanese indexes: pre- vs. post-crash.
Fig. 6. Phase between Canadian and Japanese stock indexes: pre- vs. post-crash.
The phase lead of the US over the Australian market is shown in Fig. 4. There is no discernable difference between the two periods. The US leads over all frequencies with the markets being out of phase at high frequencies gradually moving into phase at low frequencies.
The coherences for the Canadian and Japanese markets are plotted in Fig. 5. Coherences for both periods do not rise above 0.35, although there appears to be somewhat greater coherence (as in Figs. 1 and 3) in the post-crash period for most frequencies. The post-crash mean coherence is greater (0.2259 vs. 0.1714), with the Wilcoxon Z(−14.8) showing distinct distributions.
K.L.Smith/J.of Multi.Fin.Manag.11 (2001) 69 – 87 80
Coherences between the Canadian and Hong Kong markets are plotted in Fig. 7. The pattern is similar to other coherence movements among other pairwise Pacific Basin markets. That is, the coherence is low at high frequencies, rising at lower frequencies. Peak coherences for both periods occur at about frequency 0.1 (10 days). Again, visually there does not appear to be much difference between the pre-and post-crash coherences at all frequencies. However, the mean post-crash coher-ence is greater (0.2044 vs. 0.1771). Additionally, the Wilcoxon Z statistic (−4.83) indicates that the two samples are drawn from different populations.
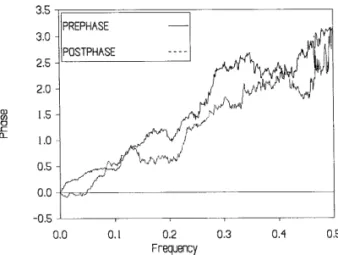
Fig. 8 shows the phase lead for both periods between the Canadian and Hong Kong markets. The Canadian market leads at all frequencies, with a greater phase lead at high frequencies. Unlike the other pairwise phase diagrams, the movement of the phase lead does not gradually decrease from high frequencies to low frequencies. The Canadian/Hong Kong pre-crash phase lead declines from fre-quency 0.5 to about 0.35, rising to about frefre-quency 0.2, thereafter falling.
Fig. 7. Coherence between Canadian and Hong Kong indexes: pre- vs. post-crash.
Fig. 9. Coherence between Canadian and Australian indexes: pre- vs. post-crash.
Fig. 10. Phase between Canadian and Australian stock indexes: pre- vs. post-crash.
Pre- and post-crash Canadian/Australian coherences are displayed in Fig. 9. The familiar pattern emerges, low coherence at high frequencies with rising coherence at longer frequencies. Results from Table 2 indicate that the post-crash median coherence is greater (0.2432 vs. 0.2106), while the post-crash mean coherence is lower (0.2371 vs. 0.2747). This is the only pair of markets where the mean and median pre- and post-crash statistics give differing results. The WilcoxonZstatistic (4.40) suggests that the coherences are drawn from different populations.
Fig. 10 plots the phase lead of the Canadian over the Australian market at each frequency for both periods. This lead is quite high (about 3.0 radian) at high frequencies, indicating that the series are moving inversely. However, the lead diminishes at longer frequencies. This pattern emerges for both periods.
K.L.Smith/J.of Multi.Fin.Manag.11 (2001) 69 – 87 82
obvious from Figs. 1, 3, 5, 7 and 9, the fourth row of Table 2 shows the percentage increases in the mean coherence between the two periods. These percentage increases are 21% (US/Hong Kong), 7% (US/Australia), 32% (Canada/Japan), and 15% (Canada/Hong Kong). The Canada/Australian coherence combination is the only statistic which indicates a shift to a lower mean coherence in the post-crash period. These statistics are consistent with the results of the Wilcoxon Zstatistics. The phase statistics for the North American markets relative to the Western Pacific region consistently show alternating significant leads of the North American market over the Western Pacific markets at high frequencies, with the lead falling at longer frequencies. Beyond a frequency of 0.2 (5 days) there is very little difference between the pre-and post-crash phase leads. This is in contrast to the phase relationships among the Western Pacific markets (discussed below).
5. Results for western pacific region
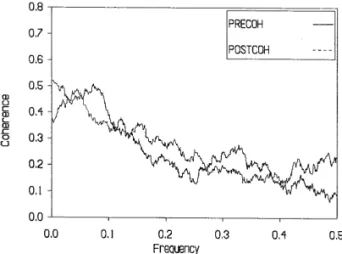
The pre- and post-crash coherences for the Japanese and Hong Kong indexes are shown in Fig. 11. The post-crash peak, mean, and median coherences are greater than pre-crash coherences. Additionally, the Wilcoxon Zstatistic (−17.2) strongly rejects the null that the pre- and post-crash coherences are drawn from the same population. The visual evidence is not so convincing. The post-crash coherence is greater at low frequencies (0.5 – 0.4), lower at intermediate frequencies (0.4 – 0.3), and again higher at lower frequencies (beyond about 0.3). However, the statistical analysis strongly suggests that the post-crash coherences are greater.
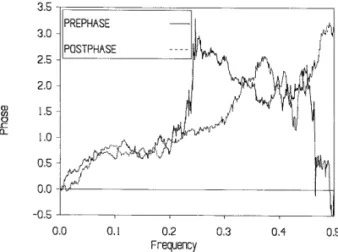
The Japanese/Hong Kong phase lead is plotted in Fig. 12. Initially, at high frequencies the Hong Kong market leads the Japanese market. At about a frequency of 0.38 (3 days) the Japanese market begins to lead, with several ‘switches’ beyond a frequency of 0.2 (5 days). This pattern is consistent across both periods. It is noteworthy that these leads, whether Japanese or Hong Kong, are
Fig. 12. Phase between Japanese and Hong Kong stock indexes: pre- vs. post-crash.
Fig. 13. Coherence between Japanese and Australian indexes: pre- vs. post-crash.
short. At a frequency 0.3 (about 3 days) the pre-crash lead peaks at only 1 radian. The largest lead of the Hong Kong market is in the pre-crash period at a frequency of 0.4 (2.5 days).
Coherence between the Japanese and Australian markets are displayed in Fig. 13. Visually, there appears to not be much to distinguish the low pre- and post-crash coherences, particularly at frequencies beyond 0.2 (5 days). However, both the post-crash mean and median are greater. The Wilcoxon Z statistic from Table 2 indicates differing populations. The pre-crash coherence is not statistically signifi-cant at about a frequency of about 0.3.3
3The statistical significance of the coherences is testing using theFtest, (2mwˆ ij(v)r
2/(1−wˆ ij(v)r
K.L.Smith/J.of Multi.Fin.Manag.11 (2001) 69 – 87 84
Fig. 14 shows the phase lead between the Japanese and Australian markets. At high frequencies, there is a dramatic difference between the two periods. In the post-crash period the lead of the Japanese market is greatly reduced. Indeed, at very high frequencies the Australian market leads. The spike in the pre-crash phase lead at about a frequency of 0.3 is due to the lack of statistical significance in the pre-crash coherence noted above.
Fig. 15 plots the coherences between the Australian and Hong Kong indexes. The pattern is similar in that the coherences, for both periods, are low at high frequencies, rising at lower frequencies. There is something unique to this pairwise comparison of the two markets. From Table 2, the Wilcoxon Z statistic cannot reject that the coherences are drawn from different populations. This is the only pairwise comparison where this is true. These data clearly indicate that the pre- and post-crash coherences are statistically indistinguishable.
Fig. 14. Phase between Japanese and Australian stock indexes: pre- vs. post-crash.
Fig. 16. Phase between Australian and Hong Kong stock indexes: pre- vs. post-crash.
The phase lead for these markets is shown in Fig. 16. The leads are short, with the Hong Kong market leading at most frequencies. The Hong Kong market leads by no more than 1 radian at a pre-crash frequency of about 0.35.
The coherences among the Western Pacific markets are not as great as those that include the North American markets. From Table 2, the pre-crash peak coherences for these markets range from 0.2415 (Japan/Hong Kong) to 0.5818 (Canada/Aus-tralia). However, the mean coherences of these markets rise in the post-crash period by 40 (Japan/Hong Kong), 15 (Japan/Australia) and 6% (Australia/Hong Kong). Again, these results are consistent with the Wilcoxon Z statistics, indicating a significant upward shift in the distribution of coherences from the pre- to post-crash period.
K.L.Smith/J.of Multi.Fin.Manag.11 (2001) 69 – 87 86
6. Conclusions and implications
Several studies have examined the comovement of equity markets. Greater comovement reduces the benefit to the investor from international diversification of portfolios. A number of methods (testing both price and volatility spillovers) have been used in these studies, from Granger causality tests, to VARs, to cointegration analysis, to volatility models (GARCH/EGARCH). In the literature, the October 1987 crash seems to be a convenient breakpoint from which to compare pre- and post-crash comovements among the markets.
One result from this paper is that the benefits from diversification are more likely to accrue to international investors at high frequencies (shorter periods). Both techniques used, coherence and phase leads, show that diversification is a short term concept. However, although coherence increases at longer frequencies, the peak coherence is only in the range of 0.3 – 0.5 (see Table 2) indicating that some diversification benefits may still be realized. The phase lead results also indicate that the benefits of diversification are more of a short term phenomenon.
This paper uses the method of cross spectral analysis to examine pre- and post-crash comovements among several Pacific Rim markets. The results support increased post-crash comovements among the markets. Each of the pairwise median coherences was greater in the post-crash period. The same is true for the post-crash mean coherences, with one exception. In support of this conclusion, the nonparametric Wilcoxon Zstatistics indicate that the pre- and post-crash coherences were drawn from different populations in seven of the eight pairwise markets comparisons.
Thus, the cross spectral results for the Pacific Rim markets are consistent with previous research, using various methods (see Jeon and Von Furstenburg, 1990; Arsanapalli and Doukas, 1993; Masih and Masih, 1997; Smith, 1999) in finding increased comovements among world equity markets. The robustness of this claim is strengthened when various methods reach the same conclusion. Pacific Rim equity markets are becoming increasingly interdependent. As trade increases, costs of communication fall, capital flows become less restrictive, and market interdependence appears to rise. The implication of this research is that benefits to investors from international diversification may not be as great today as in previous periods. Of course, this research does not suggest that there is no longer any benefit to such diversification.
Acknowledgements
The author would like to thank an anonymous referee and Ike Mathur for helpful comments.
References
post-October 1987 period. Journal of Banking and Finance 17, 193 – 208.
Booth, G. G., Chowdhury, M., Martikainen, T., Tse, Y., 1997. Intraday volatility in international stock index futures markets: meteor showers or heat waves? Management Science 43, 1564 – 1576. Brocato, J., 1994. Evidence on adjustments in major national stock market linkages over the 1980s.
Journal of Business Finance & Accounting 21, 643 – 667.
Darbor, S., Deb, P., 1997. Co-movements in international equity markets. The Journal of Financial Research 20, 45 – 58.
Eun, C.S., Shim, S., 1989. International transmission of stock market movements. Journal of Financial and Quantitative Analysis 24, 241 – 256.
Fischer, K.P., Palasvirta, A.P., 1990. High road to a global marketplace: the international transmission of stock market fluctuations. The Financial Review 25, 371 – 393.
Granger, C.W.J., Morgenstern, O., 1970. Predictability of Stock Market Prices. DC Heath and Co, Lexington, MA.
Hamao, Y., Masulis, R.W., Ng, V., 1990. Correlations in price changes and volatility across interna-tional stock markets. Review of Financial Studies 3, 281 – 307.
Harvey, A.C., 1994. Time Series Models, 2nd edition. MIT Press, Cambridge.
Hilliard, J., 1979. The relationship between equity indices on world exchanges. Journal of Finance 34, 103 – 114.
Jeon, B.N., Von Furstenburg, G.M., 1990. Growing international co-movement in stock price indexes. Quarterly Review of Economics and Business 30, 15 – 30.
Kayha, E., 1997. Correlation of returns in non-contemporaneous markets. Multinational Finance Journal 1, 123 – 135.
Koch, P.D., Koch, T.W., 1991. Evolution of dynamic linkages across daily national stock indexes. Journal of International Money and Finance 10, 231 – 251.
Koutmos, G., Booth, G.G., 1995. Asymmetric volatility transmission in international stock markets. Journal of International Money and Finance 14, 747 – 762.
Kwiatkowski, D.P., Phillips, C.B., Schmidt, P., Shin, Y., 1992. Testing the null hypothesis of stationarity against the alternative of unit root: how sure are we that economic time series have a unit root? Journal of Econometrics 54, 159 – 178.
Lindsey, R.R., Pecora, A.P., 1998. Ten years after: regulatory developments in the securities markets since the 1987 market break. Journal of Financial Services Research 13, 283 – 314.
Malliaris, A.G., Urrutia, J.L., 1992. The international crash of 1987: causality tests. Journal of Financial and Quantitative Analysis 27, 353 – 364.
Masih, A.M.M., Masih, R., 1997. Dynamic linkages and the propagation mechanism driving major international stock markets: an analysis of the pre- and post-crash eras. Quarterly Review of Economics and Finance 37, 859 – 885.
Meric, I., Meric, G., 1989. Potential gains from international portfolio diversification and inter-temporal stability and seasonality in international stock market relationships. Journal of Banking and Finance 13, 627 – 650.
Najand, M., 1996. A causality test of the October crash of 1987: evidence from Asian stock markets. Journal of Business Finance and Accounting 23, 439 – 448.
Priestley, M., 1981. Spectral Analysis and Time Series. Academic Press, London.
Smith, K.L., 1999. Major world equity market integration a decade after the 1987 crash: evidence from cross spectral analysis. Journal of Business Finance & Accounting 26, 365 – 392.
Smith, K.L., Brocato, J., Rogers, J.E., 1993. Regularities in the data among major equity markets: evidence from Granger causality tests. Applied Financial Economics 3, 55 – 60.
Susmel, R., Engle, R.F., 1994. Hourly volatility spillovers between international equity markets. International Journal of Money and Finance 13, 3 – 25.
Taylor, M.P., Tonks, I., 1989. The internationalisation of stock markets and the abolition of U.K. exchange contral. Review of Economics and Statistics 71, 332 – 336.