Full Terms & Conditions of access and use can be found at
http://www.tandfonline.com/action/journalInformation?journalCode=cbie20
Download by: [Universitas Maritim Raja Ali Haji] Date: 18 January 2016, At: 19:18
Bulletin of Indonesian Economic Studies
ISSN: 0007-4918 (Print) 1472-7234 (Online) Journal homepage: http://www.tandfonline.com/loi/cbie20
Survey of recent developments
Chris Manning & Raden M. Purnagunawan
To cite this article: Chris Manning & Raden M. Purnagunawan (2011) Survey of recent developments, Bulletin of Indonesian Economic Studies, 47:3, 303-332, DOI: 10.1080/00074918.2011.619048
To link to this article: http://dx.doi.org/10.1080/00074918.2011.619048
Published online: 16 Nov 2011.
Submit your article to this journal
Article views: 873
View related articles
ISSN 0007-4918 print/ISSN 1472-7234 online/11/030303-30 © 2011 Indonesia Project ANU DOI: 10.1080/00074918.2011.619048
SURVEY OF RECENT DEVELOPMENTS
Chris Manning Raden M. Purnagunawan
Australian National University Padjadjaran University, Bandung
SUMMARY
There is a growing conidence in policy, business and inance circles about Indonesia’s abil-ity to withstand global economic and inancial shocks, and a renewed belief in domestic sources of growth. Despite uncertainty in Europe and slower than expected recovery in the US, Indonesia is well placed for moderately high growth in the medium term, and economic stability in the shorter term. At the end of June 2011, foreign reserves were at a record high, inlation was down, annual growth was steady at 6.5%, and investment – especially foreign direct investment (FDI) – was up signiicantly.
Consumer price inlation had fallen to just below 5% by August, from double-digit lev-els earlier in the year. This was due partly to low food prices and success in sterilising the effects of capital inlows. However, turmoil in international markets led to a sharp fall in the Indonesia stock exchange index and a mild currency depreciation in August– September, prompting central bank intervention in the foreign exchange market. Fiscal policy has remained conservative, aiming for a balanced budget by 2014. However, the government has still not moved to reduce growing fuel and energy subsidies.
While the service sectors have continued to record high rates of growth, there has been a revival of manufacturing in 2011. This is partly underpinned by strong inlows of FDI, and is especially evident in the labour-intensive textiles, clothing and footwear industries after a decade of stagnation. Multinationals have announced plans to expand operations in Indonesia in the past six months to take advantage of new tax incentives. Overseas inves-tors have also been attracted by Indonesia’s growing middle class – a result partly of higher rural incomes driven by the commodity boom outside Java.
Some recent ministerial announcements about initiatives to promote domestic indus-try have a protectionist lavour. A cabinet reshufle in October may signal a more dirigiste approach to industrial policy – especially the shifting of internationally respected econo-mist Mari Pangestu from the trade portfolio to that of tourism and creative economy.
One important outcome of recent growth has been falling unemployment rates. How-ever, youth unemployment remains a major problem, and efforts to overcome it have been fragmentary. A recent ban on overseas migration of domestic helpers (maids) seems certain to add to labour supply pressures among young people.
The government is now considering how to mobilise its large population base, abundant natural resources and strategic location to play a greater role in the world economy. These assets are central to the ambitious ‘Master Plan’ for longer-term development (2011–25), announced in May. It focuses on developing the resource-rich Outer Island regions, with massive investments in energy and ‘connectivity’ to link the major centres and islands with each other, and centres with their hinterlands. Funding (to come mainly from the private sector), implementation and coordination are all major challenges.
Keywords: growth, economic policy, industrial policy, labour, migration, economic planning
INTRODUCTION
The launching of the Master Plan for the Acceleration and Expansion of Indo-nesian Economic Development (known as MP3EI) by President Susilo Bambang Yudhoyono (SBY) in May 2011 symbolised a growing conidence among policy makers, politicians and business people in Indonesia’s economic future, and at the same time pointed to a revival of economic nationalism. In some respects, the atmosphere resembles the heady days of the late Soeharto era, when there was growing conidence in cooperation between big business and the state to promote economic transformation.1 The Asian inancial crisis (AFC) put those ambitions on hold with a jolt. For nearly a decade after the AFC and the accompanying regime change, the nation moved forward with conidence politically. Economic policy makers, in sharp contrast, were seeking to put to rest the trauma of the sudden and deep economic disruption of 1998. International investors in turn were wary of Indonesia, with its radically different and contested political environment and the massive changes in political and administrative arrangements heralded by decentralisation from 2001.
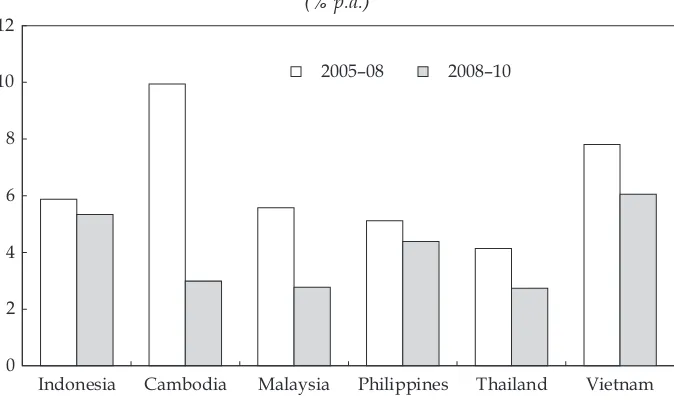
The revived conidence can be attributed to a number of factors. Economic recovery from the AFC and its aftermath had been consolidated by the mid-2000s. Although somewhat adversely affected by the global inancial crisis (GFC) of 2008–09, growth has maintained a gradual upward trend through to 2011. Indo-nesia’s recent GDP growth has been more stable than that of its peers in the region, even though it has been less rapid than that of its Southeast Asian neighbour Viet-nam (igure 1), and much slower than that of China and India. SBY’s re-election in 2009 followed Indonesia’s joining the G-20 leaders forum in 2008.2 For the irst time, Indonesia was being seriously discussed as a candidate to join the BRICS (Brazil, Russia, India, China and South Africa), the irst tier of large developing countries (Thee 2010). In 2011, Indonesia became chair of ASEAN, and in 2013 it will chair APEC for the irst time since 1994. Further, buoyant commodity prices and Indonesia’s rich supply of natural resources, in great demand in Japan, China and India, have provided some insurance against the immediate negative effects of the slower than expected recovery in the US and the debt crisis in Europe.
There is a second, more subtle dimension to this growing conidence, also relected in the tenor of the Master Plan. First, while public documents clearly acknowledge that its economic fortunes are inter-twined with those of the East Asian and world economies, there is a strong feeling that Indonesia’s economy is now large and prosperous enough for domestic resources, both human and physi-cal, to play a more dominant role in national development and industrial growth. Several factors have been at play here. While exports have continued to grow quite strongly, a return to moderately high growth has been achieved without reli-ance on a single export commodity (or set of commodities) acting as the engine of growth – a role played by oil in the 1970s and by labour-intensive manufacturing exports in the 1980s, and in the 1990s until the AFC. The small communications
1 At this time economic growth and investment rates were high by regional standards; Indonesia also chaired a ground-breaking APEC leaders meeting in 1994, afirming the country’s place as a signiicant regional power in economic and political affairs.
2 In 2009, Indonesia had the third highest economic growth rate in East Asia (4.5%), after China and Vietnam.
and utilities (electricity, water and gas) sectors have been Indonesia’s fastest growing sectors for several years, and growth in the non-tradables sector has been more than twice that in tradables for most years since the crisis. Investment has recovered somewhat in the past three years (OECD 2010). Inluential policy makers, politicians and business people have concluded from the experience of the GFC that heavy dependence on the global economy can be costly in terms of extreme luctuations in total demand, and this has reinforced a belief in the importance of domestic sources of growth.
In his introduction to the Master Plan, President Yudhoyono referred to this national self-conidence and ambition for the future:
The Republic of Indonesia is a nation blessed with almost all of the prerequisites for transformation into a great economic power. With its abundant natural resources, large, productive and young population and strategic access to the global mobility network, these assets and access empower Indonesia to establish itself in its rightful place among the leading economies of the world.
From an economic standpoint, the potency of these national assets is relected in the absolute size of Indonesia’s growing middle class, especially in the second half of the past decade. According to one estimate, the middle class grew by over 50%, from 80 to 130 million, in just seven years (2003–10) (World Bank 2011a: 37–41).3 This has already meant a substantial increase in the consumption of consumer durables such as television sets, motor-cycles and cars. But it also signals a signiicant shift in consumption patterns to higher-quality services (such as health care, education,
3 This igure is based on a broad deinition of the middle class, covering all households earning more than $2 per capita per day. The number of households with a daily income per capita of $4–6 has grown especially fast in both urban and rural areas (the absolute numbers are roughly equivalent in both).
FIGURE 1 Average Growth of Real GDP for Selected Countries in Southeast Asia (% p.a.)
Indonesia Cambodia Malaysia Philippines Thailand Vietnam 0
2 4 6 8 10 12
2005–08 2008–10
Source: ADB (2011).
information technology and leisure activities) and the use of more sophisticated inancial services, including insurance and social security (ADB 2010).4
Thus Indonesian policy makers appear quietly conident that the national economy should be able to weather the impact of most shocks. Indeed, Indonesia seems to have beneited from global uncertainty, with investors discovering it as something of a safe haven, as well as a longer-term prospect.
This is not all good news, however. While there is no indication of a planned sudden shift away from Indonesia’s open stance on both trade and investment, there are some signs that international investors are being lured to Indonesia partly because of its growing, and potentially more protected, domestic market. Moreover, the increased conidence within Indonesia does not appear to arise from improved competitiveness at home. Rather, there is a conidence in the beneits of greater cooperation between big business and government (‘Indonesia Inc.’) in promoting economic growth by mobilising capital domestically and raising value added at home (the latter through selective tax and trade policies that target cer-tain industries, and that focus on the domestic processing of natural resources). One legitimate question is whether this new more dirigiste approach (discussed further below) will be consistent with the higher economic growth targets of 7–8% that the government has set itself in the medium to longer term.
Thus the Master Plan does lag a change in emphasis that has been evolving over the past couple of years within the economic policy team, especially since the departure of former inance minister Sri Mulyani Indrawati (Baird and Wihardja 2010: 144–6). We examine some of its features below, after irst looking at recent developments in the economy and in industry and trade policy, and their implica-tions for the labour market.
MACROECONOMIC DEVELOPMENTS AND POLICY
In the second and third quarters of 2011, Indonesia could hardly have been better prepared for what is now almost certain to be a sharper downturn in the world economy in 2011 and 2012, and a slower recovery, than had been expected earlier in the year. At the end of the second quarter (Q2) of 2011, foreign reserves reached a record high at just under $120 billion, inlation was down to below 5%, invest-ment (especially FDI) was up signiicantly and growth was steady at 6.5% year on year. Macroeconomic policy makers are not ignoring the potential impact of another global recession. However, Indonesia seems likely to have been relatively little affected in the immediate to medium term by the August news of a slower than expected US recovery, and the unresolved debt crisis in Europe (The Econo-mist, 6/8/2011: 32).
Growth
GDP growth remained steady in Q2 2011 (table 1a), despite the poorer perfor-mance of some sectors, especially mining and quarrying, in the past quarter (table 1b). Growth of 6.5% year on year, similar to that recorded in Q1, suggests that the quarterly year-on-year growth rates for 2011 may have moved up into the
4 ADB (2010, part I) explores some of the changing consumption patterns of the middle class in Asia, and includes data for Indonesia.
6.5–7% range, one percentage point above the range recorded for the four quarters of 2010 (5.5–6.0%). Whether these new growth rates can be sustained in the short to medium term will depend on what happens in Europe and the US in the next 3–6 months.5
A clear trend is now emerging in the form of a revival of growth in manufactur-ing – already commented on by Suryadarma and Sumarto (2011) – and in tradables more generally. Agricultural production has also been steady, partly because of a
5 In light of these developments, the World Bank has already down-graded its 2011 growth forecast for Indonesia from 6.7 to 6.3% (World Bank 2011c: 5).
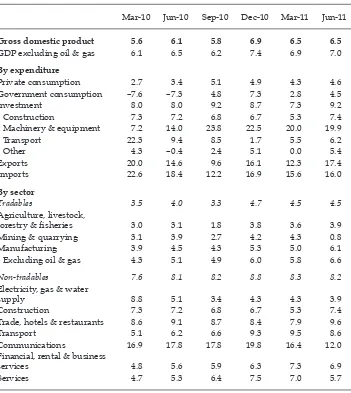
TABLE 1a Components of GDP Growth (2000 prices; % year on year)
Mar-10 Jun-10 Sep-10 Dec-10 Mar-11 Jun-11
Gross domestic product 5.6 6.1 5.8 6.9 6.5 6.5
GDP excluding oil & gas 6.1 6.5 6.2 7.4 6.9 7.0
By expenditure
Private consumption 2.7 3.4 5.1 4.9 4.3 4.6
Government consumption –7.6 –7.3 4.8 7.3 2.8 4.5
Investment 8.0 8.0 9.2 8.7 7.3 9.2
Construction 7.3 7.2 6.8 6.7 5.3 7.4
Machinery & equipment 7.2 14.0 23.8 22.5 20.0 19.9
Transport 22.3 9.4 8.5 1.7 5.5 6.2
Other 4.3 –0.4 2.4 5.1 0.0 5.4
Exports 20.0 14.6 9.6 16.1 12.3 17.4
Imports 22.6 18.4 12.2 16.9 15.6 16.0
By sector
Tradables 3.5 4.0 3.3 4.7 4.5 4.5
Agriculture, livestock,
forestry & isheries 3.0 3.1 1.8 3.8 3.6 3.9
Mining & quarrying 3.1 3.9 2.7 4.2 4.3 0.8
Manufacturing 3.9 4.5 4.3 5.3 5.0 6.1
Excluding oil & gas 4.3 5.1 4.9 6.0 5.8 6.6
Non-tradables 7.6 8.1 8.2 8.8 8.3 8.2
Electricity, gas & water
supply 8.8 5.1 3.4 4.3 4.3 3.9
Construction 7.3 7.2 6.8 6.7 5.3 7.4
Trade, hotels & restaurants 8.6 9.1 8.7 8.4 7.9 9.6
Transport 5.1 6.2 6.6 9.3 9.5 8.6
Communications 16.9 17.8 17.8 19.8 16.4 12.0
Financial, rental & business
services 4.8 5.6 5.9 6.3 7.3 6.9
Services 4.7 5.3 6.4 7.5 7.0 5.7
Source: CEIC Asia Database.
good main rice harvest in Q1 2011.6 The disaggregated data show that food recov-ered from its poor showing in 2010, plantation crop growth was up in the irst half of 2011 and isheries grew strongly. In manufacturing, the biggest surprise in 2011 has been a revival of the textiles, clothing and footwear (TCF) industries after a decade in the doldrums: this sector grew by an average of 9% (year on year) in the irst half of 2011, compared with barely 1% in 2010. It is reported that Chinese and other international investors have turned their attention to these labour-intensive
6 Nevertheless there is concern about the potential impact of resurgent infestation of the rice crop by the brown planthopper or wereng (box 1).
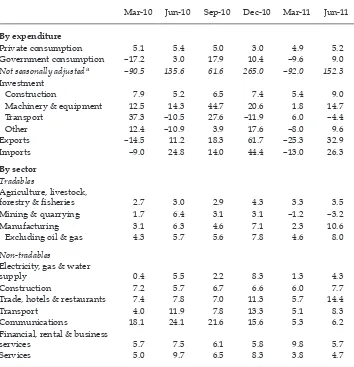
TABLE 1b Components of GDP Growth
(2000 prices; seasonally adjusted;a % quarter on quarter, annualised rates)
Mar-10 Jun-10 Sep-10 Dec-10 Mar-11 Jun-11
By expenditure
Private consumption 5.1 5.4 5.0 3.0 4.9 5.2
Government consumption –17.2 3.0 17.9 10.4 –9.6 9.0
Not seasonally adjusteda –90.5 135.6 61.6 265.0 –92.0 152.3 Investment
Construction 7.9 5.2 6.5 7.4 5.4 9.0
Machinery & equipment 12.5 14.3 44.7 20.6 1.8 14.7
Transport 37.3 –10.5 27.6 –11.9 6.0 –4.4
Other 12.4 –10.9 3.9 17.6 –8.0 9.6
Exports –14.5 11.2 18.3 61.7 –25.3 32.9
Imports –9.0 24.8 14.0 44.4 –13.0 26.3
By sector Tradables
Agriculture, livestock,
forestry & isheries 2.7 3.0 2.9 4.3 3.3 3.5
Mining & quarrying 1.7 6.4 3.1 3.1 –1.2 –3.2
Manufacturing 3.1 6.3 4.6 7.1 2.3 10.6
Excluding oil & gas 4.3 5.7 5.6 7.8 4.6 8.0
Non-tradables
Electricity, gas & water
supply 0.4 5.5 2.2 8.3 1.3 4.3
Construction 7.2 5.7 6.7 6.6 6.0 7.7
Trade, hotels & restaurants 7.4 7.8 7.0 11.3 5.7 14.4
Transport 4.0 11.9 7.8 13.3 5.1 8.3
Communications 18.1 24.1 21.6 15.6 5.3 6.2
Financial, rental & business
services 5.7 7.5 6.1 5.8 9.8 5.7
Services 5.0 9.7 6.5 8.3 3.8 4.7
a Quarter-on-quarter growth is typically distorted by seasonal factors. The data in this table have been seasonally adjusted so as to remove these distortions.
Source: CEIC Asia Database.
BOX 1 ThreaTsTO rice PrOducTiOn
On 5 November 1986, in response to Indonesia’s most serious brown planthopper (bph) infestation, which had resulted in the loss of over a million tonnes of rice, then President Soeharto issued a Presidential Instruction (Inpres 3/1986) banning 57 named resurgence-causing pesticides, and initiated the irst stages of integrated pest management. Combined with the introduction of a new variety of resistant rice, IR 64, this Inpres effectively provided Indonesia with the basis for more than two decades of steadily increasing rice production without serious pest problems. Rice production climbed from 37.7 million tonnes in 1986 to 66.4 million tonnes in 2010.
The brown planthopper (Nilaparvata lugens [Stål]) has been a scourge on rice in Asia since the beginnings of the Green Revolution. It is a tiny fast-breeding insect that combines high fertility with high mobility, allowing it to invade rice ields with ease. Females can produce 400 eggs in a single generation of 20 days, and every alternate generation becomes mobile and can take light. In large numbers, the hopper can destroy a rice crop in a single day, producing what is called ‘hopperburn’. In addition, the bph is the carrier of two virulent rice viruses: Grassy Stunt and Ragged Stunt. Losses from these viruses can often be worse than direct hopperburn.
Spraying pesticides rarely obliterates an entire bph population. Instead, spraying ‘selects’ hoppers capable of developing resistance. Thus pesticides that may initially be effective invariably lose their effectiveness as hopper populations mutate. Scientiic studies have shown that some pesticides can actually increase hopper fertility. Far more seriously, pesticides destroy the natural enemies of the bph, which can feed upon hopper eggs embedded in the rice stems. Without such predators, the bph populations can grow with no constraint, and reach outbreak proportions.
Farmers who have little understanding of the chemical compounds they are using often mix a cocktail of pesticides that can mute the effect of the individual components, making them even less effective on the insects. Similarly, under heavy pesticide use the bph can mutate rapidly to overcome resistance bred into rice varieties. Since 1967, Indonesia has introduced dozens of resistant varieties that have subsequently lost their resistance.
Since 2005 Indonesia has dramatically increased its reliance on pesticides. With this has occurred a breakdown of resistance in previously resistant rice varieties, including IR 64. Since 2010, there have been serious outbreaks of bph infestation across Java. Particularly severe outbreaks have taken place in the rice baskets of Jember, Lamongan, Pati–Kudus, Klaten–Boyolali–Sukoharjo (with spillover to Yogyakarta), Subang– Indramayu and Lebak, with both hopperburn and widespread virus infestation occurring. Crop losses in these high-production areas have been notable.
A consistent response to date has been to increase the use of pesticides. Other measures necessary to break the cycle of the bph require curtailment of the successive planting of rice, and the substitution of secondary crops in place of rice. A fallow period followed by synchronised planting over a wide area has so far been dificult to achieve. All of these measures have the effect of reducing future rice production.
For the moment, Indonesia has only one possibly resistant rice variety, Inpari 13, which is now being introduced in Java. However, the release of Inpari 13 in Polanharjo, Klaten, has been accompanied by massive prophylactic pesticide spraying. It is impossible to know how resistant this variety will be, since such mass spraying is likely to do more harm than good. More generally, under present conditions, it is impossible to predict the prospects for future rice production.
James J. Fox Australian National University
industries in Indonesia as wages have begun to escalate in southeastern China. For example, Indonesia’s footwear industry association reports that the value of exports grew by more than 50% in 2010, and was on target to grow by another 20–30% in 2011, although spokespeople were nervous about the possible impact of a global downturn in 2012 (Investor Daily, 14/09/2011).
Growth rates of processed food, beverages and tobacco have also bounced back (to just under 7% in the irst half of 2011), after a poor showing in 2010. At the same time, quite high recent growth in both total investment and investment in machin-ery and equipment (table 1a) supports the picture of a reasonably robust expansion in more capital-intensive industries in both manufacturing and mining.
Service sectors continue to record high rates of growth, still led by the rapid expansion of communications (although growth of the latter declined to 12% in Q2 2011). Indonesians are among the world’s largest users of mobile phones, Facebook (second largest user) and Twitter (largest user). This, together with crea-tive talents channelled into design activities associated with computers, has been identiied frequently in the media as a strong contributor to the country’s com-parative advantage in service-related activities. Non-tradables sector growth is still well above that of tradables, and growth in other non-tradables sectors such as transport remains strong. But the gap between tradables and non-tradables has narrowed somewhat in the past six months.
Investment and exports
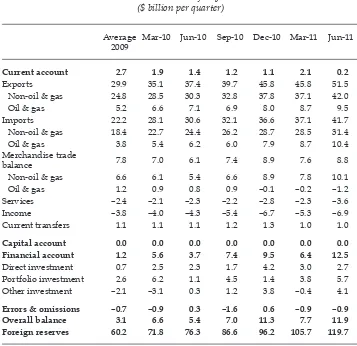
Investment grew strongly at over 9% in Q2 2011, up from 7% in Q1, and it contin-ued to expand much faster than consumption (table 1a). Partly this can be attrib-uted to continuing high rates of capital inlow, much of it FDI. From Q1 2010, realised direct investment recorded by Bank Indonesia (BI) had begun to rise quite steeply, picking up after the GFC. The quarterly average rose from a paltry $0.7 billion in 2009 to around $2.7 billion in 2010, and $2.9 billion in the irst half of 2011 (table 2). FDI continues to be dominated by manufacturing but has also been signiicant in mining and, surprisingly, the trade sector (table 3), including hotels and restaurants.
According to data on investment approvals from the Investment Coordinating Board (Badan Koordinasi Penanaman Modal, BKPM), capital-intensive sectors in manufacturing (chemicals, base metals and machinery) were the main targets of FDI, although some projects were directed into more labour-intensive industries such as electronics. Big multinationals such as Toyota and Nissan have announced plans in the past six months to expand operations in Indonesia. While they may be attracted by Indonesia’s export potential, its large domestic market seems to have been a major consideration in announcements by industry spokespeople. Toyota, for example, recently announced that its goal was primarily to expand its already large presence in the domestic market, but it also signalled a secondary objective of expanding exports into the Asia Paciic region (Jakarta Post, 14/09/2011). Other companies such as Hyundai and Hankook Tire are similarly reporting a mix of out-put directed to the domestic market as well as for exporting (World Bank 2011b: 25). This resurgence of FDI in Indonesia is a positive sign, and perhaps evidence of a mood change, given the pessimism about the domestic investment environment and the poor investment and output record in manufacturing for most of the post-AFC period (Thee and Negara 2010: 287–9). While appreciation of the exchange
TABLE 2 Balance of Payments ($ billion per quarter)
Average 2009
Mar-10 Jun-10 Sep-10 Dec-10 Mar-11 Jun-11
Current account 2.7 1.9 1.4 1.2 1.1 2.1 0.2
Exports 29.9 35.1 37.4 39.7 45.8 45.8 51.5
Non-oil & gas 24.8 28.5 30.3 32.8 37.8 37.1 42.0
Oil & gas 5.2 6.6 7.1 6.9 8.0 8.7 9.5
Imports 22.2 28.1 30.6 32.1 36.6 37.1 41.7
Non-oil & gas 18.4 22.7 24.4 26.2 28.7 28.5 31.4
Oil & gas 3.8 5.4 6.2 6.0 7.9 8.7 10.4
Merchandise trade
balance 7.8 7.0 6.1 7.4 8.9 7.6 8.8
Non-oil & gas 6.6 6.1 5.4 6.6 8.9 7.8 10.1
Oil & gas 1.2 0.9 0.8 0.9 –0.1 –0.2 –1.2
Services –2.4 –2.1 –2.3 –2.2 –2.8 –2.3 –3.6
Income –3.8 –4.0 –4.3 –5.4 –6.7 –5.3 –6.9
Current transfers 1.1 1.1 1.1 1.2 1.3 1.0 1.0
Capital account 0.0 0.0 0.0 0.0 0.0 0.0 0.0
Financial account 1.2 5.6 3.7 7.4 9.5 6.4 12.5
Direct investment 0.7 2.5 2.3 1.7 4.2 3.0 2.7
Portfolio investment 2.6 6.2 1.1 4.5 1.4 3.8 5.7
Other investment –2.1 –3.1 0.3 1.2 3.8 –0.4 4.1
Errors & omissions –0.7 –0.9 0.3 –1.6 0.6 –0.9 –0.9
Overall balance 3.1 6.6 5.4 7.0 11.3 7.7 11.9
Foreign reserves 60.2 71.8 76.3 86.6 96.2 105.7 119.7
Source: CEIC Asia Database.
TABLE 3 Share of Foreign Direct Investment by Sector, 2005–11 (%)
2005 2006 2007 2008 2009 2010 Semester 1
2010 2011
Mining 15 7 26 39 27 16 14 30
Manufacturing 63 34 33 25 32 42 51 34
Finance 9 21 19 21 3 0 –1 3
Trade 1 8 3 12 2 21 23 13
Other 12 30 19 3 37 21 13 20
100 100 100 100 100 100 100 100
Source: Bank Indonesia.
rate may have hampered competitiveness, other factors are clearly working to Indonesia’s advantage. For example, a JETRO (Japan External Trade Organiza-tion) study of irms in the Asia Paciic region suggests that rising wages in both China and Vietnam, in textiles, transport and electronics, are likely to increase the attractiveness of Indonesia as a destination country (World Bank 2011b: 26).7 Uncertainty of labour supply also seems to have been a major consideration in the decisions of investors moving from China.
Domestic investment realisation, which accounts for 2–3 times the value of for-eign investment recorded by BKPM, has also grown rapidly over the same period, after collapsing in 2008 during the GFC.8 Here the focus in Q2 of 2011 was on pri-mary industries, food and plantation crops (mainly oil palm), paper, base metals and transport.
Domestic and foreign investments have been encouraged by growth in rural incomes in the resource-abundant regions outside Java, which in turn have bene-ited from rising commodity prices over the past few years. A perceptive article in the Wall Street Journal (Bellman 2011) describes the impact of higher prices of palm oil, cocoa, rubber and coal on sales of consumer durables such as motor-cycles and television sets, as well as on improved housing. Relecting an important develop-ment for consumer goods companies, Bellman quotes a Unilever spokesperson as saying that the Outer Islands will soon constitute half the company’s sales, the large majority of which have been on Java in the past. Unilever’s president director is quoted as saying: ‘Rural areas are getting richer from plantations and natural resources, the money is spreading’.
In Q2 2011, exports picked up, growing by 17.4% on an annual basis (table 1a), although more recent data announced by the Central Statistics Agency (BPS) point to a 5% decline in July compared with the previous month and then a recov-ery in August. The biggest gains were in oils and fats (mainly oil palm products), minerals (mainly coal) and chemicals. The rapid growth in exports of coal and oil palm over the past ive years in particular has shifted the locus of export activities away from Java, where the once dynamic labour-intensive TCF industries had been growing quite slowly for a decade before the recent recovery (McLeod 2011).
In discussions of the potential impact on Indonesian exports of slower world economic growth in the next couple of years, Mari Pangestu, the former trade minister (replaced on 18 October), has drawn attention to planned trade promo-tion efforts to diversify exports, especially to Africa, where Indonesia already has a foothold through oil and gas exports to South Africa (Jakarta Post, 7/9/2011).9
7 The study reports US dollar wages to be 40% lower in Indonesia than in China, and the gap was only slightly smaller with India and the Philippines (JETRO 2010: 51). Wage indi-ces from the Economist Intelligence Unit point to much more rapid increases in real wages in China from 2005 than in a selection of East Asian countries, including Indonesia and Vietnam (World Bank Economic Sector, Jakarta, work in progress on Indonesia’s manufac-turing sector).
8 The BKPM igure for domestic investment is itself a gross under-estimate, since BKPM data cover only larger investors.
9 The focus of these efforts is to be on the more rapidly growing ‘South’ economies. For an overview of South–South trade and investment ties, see Jha and McCawley (2011).
Inlation, exchange rates and monetary policy
Global economic and inancial instability and uncertainty intensiied in August– September, just when Indonesia’s growth rate had recovered to pre-GFC levels. While well placed in many respects to weather the storm, Indonesia is not immune to its effects, with short-term capital outlows impacting on the stock market and the exchange rate in August and September. The troubles in Europe, Japan and the US were also predicted to affect commodity prices, although most had already begun to fall in the irst quarter of 2011, after the recovery in world prices from the GFC during most of 2010.
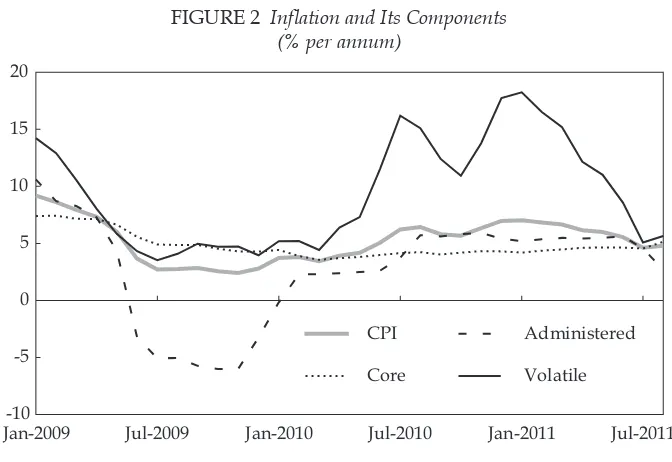
The consumer price index (CPI) continued to slow through the second quarter of 2011, after rising sharply in late 2010 owing to food price hikes. It rose only very slightly in the Ramadan month of August (igure 2). The decline continued to be driven by falling food prices (which accounted almost entirely for the fall in ‘volatile’ inlation shown in igure 2), and was helped by a still healthy stockpile of just under one million tonnes of imported rice. Administered price inlation remained steady until July, relecting to a considerable extent the government’s decision to keep the main subsidised prices (fuel and energy) stable during 2011. ‘Core inlation’ has gradually increased, exceeding 5% for the irst time in two years; this is reportedly connected with sharply rising gold prices, and with some pass-through of other international prices to the general index.
There do not seem to be major threats from domestic supply for food prices over the rest of 2011. But increases in world prices need to be monitored closely, given the signiicant impact that rice price increases can have on ‘poverty basket’ inlation (World Bank 2011b: 16).
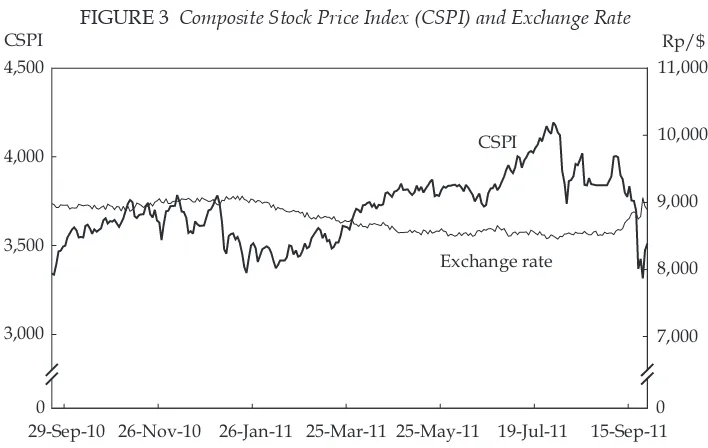
Inlation has remained low despite continuing high levels of capital inlow and an exchange rate that remained relatively stable at around Rp 8,500/$ over the three months to August (igure 3). The turmoil in international markets
Jan-2009 Jul-2009 Jan-2010 Jul-2010 Jan-2011 Jul-2011 -10
-5 0 5 10 15 20
CPI
Core
Administered
Volatile
FIGURE 2 Inlation and Its Components
(% per annum)
Source: CEIC Asia Database.
contributed to a light to the dollar; a sell-off of shares especially by foreign own-ers; and a sharp fall in the value of the rupiah in September. The exchange rate had strengthened to Rp 8,800/$ by the end of the month (after depreciating to above Rp 9,000/$), with BI reportedly intervening in the market to slow the slide in its value (Jakarta Globe, 14/9/2011).10
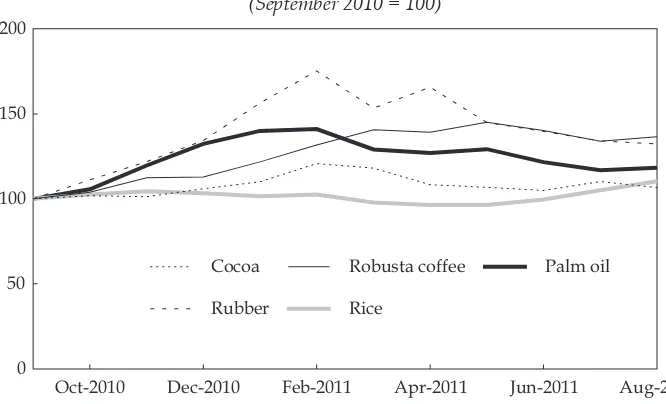
A number of factors appear to have contributed to inlation’s low level by Indonesian standards. The government continued to sterilise the effects of capital inlow through the issue of Bank Indonesia Certiicates (SBIs). Following sharp commodity price rises through 2010 and early in 2011, the prices of oil, coal, palm oil, cocoa and coffee had begun to plateau or decline by mid-2011 (igures 4a and 4b). The price of oil fell appreciably in early August, following news of signii-cantly slower growth prospects in the US and mounting problems in Europe, but remained reasonably steady through September. Coal, copper and nickel prices fell by close to 5–10% from January to June, as did the prices of palm oil and cocoa, while rubber prices fell even more steeply from their peak in February.
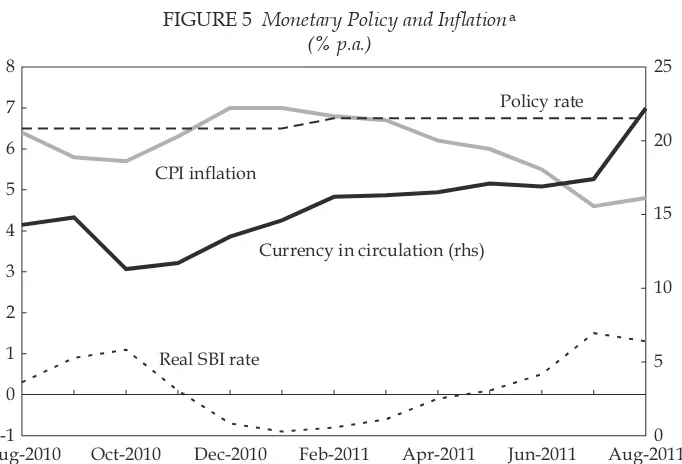
Money supply growth (proxied by currency in circulation) remained steady within a 15–20% band year to year during the irst seven months of 2011 (igure 5), although it rose sharply in August–September. Lower inlation led the real SBI rate back into positive territory around March 2011. Given these relatively stable conditions, it was no surprise that BI decided in September to keep interest rates on hold, at 6.75%, for the sixth successive month. However, in light of jittery mar-kets through into October, it took the decision to reduce the policy rate by 25 basis points in the second week of October.
Through the irst two quarters of 2011, the balance of payments shows strong growth in trade and capital inlows (table 2). However, turbulence on markets
10 The rupiah fell less in nominal terms than several other regional currencies in August– September (World Bank 2011c: 8).
29-Sep-2010 26-Nov-2010 26-Jan-2011 25-Mar-2011 25-May-2011 19-Jul-2011 15-Sep-20110
3,000 3,500 4,000 4,500
0 7,000 8,000 9,000 10,000 11,000
CSPI Rp/$
29-Sep-10 26-Nov-10 26-Jan-11 25-Mar-11 25-May-11 19-Jul-11 15-Sep-11 CSPI
Exchange rate
FIGURE 3 Composite Stock Price Index (CSPI) and Exchange Rate
Sources: Indonesia Stock Exchange; Paciic Exchange Rate Service.
abroad spilled over to stock exchanges worldwide, with quite large falls being registered in Europe and the US, and to a lesser extent in Asia. Indonesia has not been immune from these movements. After peaking at slightly over 4,000 in early August, the composite stock price index declined quite sharply from early September, to 3,300, as a result of sell-offs by fund managers (Jakarta Post, 28/09/2011). It recovered slightly at the end of the month to just over 3,500 (igure 3). These falls, while signiicant, were not out of line with similar move-ments in other regional stock market indices (World Bank 2011c: 8).
Oct-2010 Dec-2010 Feb-2011 Apr-2011 Jun-2011 Aug-2011 0
50 100 150
Coal Copper
Crude oil Gold
Nickel
FIGURE 4a International Prices of Selected Mineral and Petroleum Commodities (September 2010 = 100)
Source: Index Mundi, <http://www.indexmundi.com/commodities/>.
Oct-2010 Dec-2010 Feb-2011 Apr-2011 Jun-2011 Aug-2011 0
50 100 150 200
Palm oil
Rice
Robusta coffee
Rubber Cocoa
FIGURE 4b International Prices of Selected Agricultural Commodities (September 2010 = 100)
Source: Index Mundi, <http://www.indexmundi.com/commodities/>.
While Indonesia is in good shape to face immediate threats of a slowdown in the world economy, one major gap has been regulations on the authority to deal with an unexpected bank failure. The Financial System Safety Net (Jaring Pengaman Sistem Keuangan, or JPSK) Law, designed to provide authority for government oficials to act under such circumstances, has been delayed for several years and had not been passed by the parliament by late October 2011. Several commenta-tors have been urging the government and the parliament to give its passage high priority, to ensure that policy makers have adequate protection to enable them to take quick decisions to stabilise any situation that threatens inancial market and macroeconomic stability. This legislation is considered critical in light of the politi-cal fallout in 2009–10 from the controversial 2008 decision to bail out Bank Century (Baird and Wihardja 2010; Patunru and Von Luebke 2010: 10–12). There is concern that without it senior decision makers may be unwilling to make a similar call in the event of a future banking collapse.11
The 2012 budget
The president presented the draft budget for 2012 to parliament on 16 August. There were no big surprises. Spending is planned to rise 7.4% to Rp 1,400 trillion, lagging a decline in the deicit to 1.5% of GDP, down from the revised 2011 budget estimate of 2.1% (table 4). This seems a tiny spending increase, given population
11 See, for example, M. Chatib Basri in an opinion piece in Kompas, 29/9/2011.
Aug-2010-1 Oct-2010 Dec-2010 Feb-2011 Apr-2011 Jun-2011 Aug-2011 0
1 2 3 4 5 6 7 8
0 5 10 15 20 25 Policy rate
CPI inflation
Currency in circulation (rhs)
Real SBI rate
FIGURE 5 Monetary Policy and Inlationa (% p.a.)
a Currency in circulation is used as the indicator of money supply in preference to base money because of the distorting impact of occasional changes in banks’ minimum reserve requirements on the effective supply of base money; currency is the major component (about 75%) of base money. The growth rate shown has been smoothed based on 3-month moving averages to clarify the underlying
trend. The real SBI (Bank Indonesia Certiicate) rate is approximated by the nominal rate less the con
-temporaneous CPI (consumer price index) inlation rate.
Source: CEIC Asia Database.
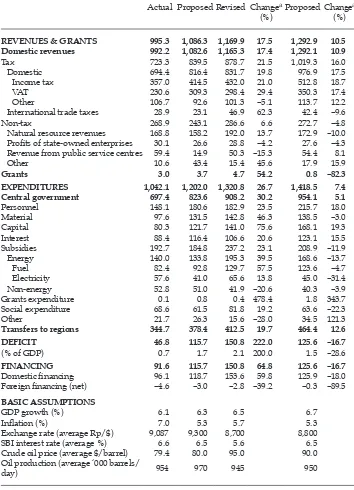
TABLE 4 Budgets for 2009, 2010 and 2011
REVENUES & GRANTS 995.3 1,086.3 1,169.9 17.5 1,292.9 10.5
Domestic revenues 992.2 1,082.6 1,165.3 17.4 1,292.1 10.9 Tax 723.3 839.5 878.7 21.5 1,019.3 16.0
Domestic 694.4 816.4 831.7 19.8 976.9 17.5
Income tax 357.0 414.5 432.0 21.0 512.8 18.7
VAT 230.6 309.3 298.4 29.4 350.3 17.4 Other 106.7 92.6 101.3 –5.1 113.7 12.2
International trade taxes 28.9 23.1 46.9 62.3 42.4 –9.6
Non-tax 268.9 243.1 286.6 6.6 272.7 –4.8 Natural resource revenues 168.8 158.2 192.0 13.7 172.9 –10.0
Proits of state-owned enterprises 30.1 26.6 28.8 –4.2 27.6 –4.3 Revenue from public service centres 59.4 14.9 50.3 –15.3 54.4 8.1
Other 10.6 43.4 15.4 45.6 17.9 15.9
Grants 3.0 3.7 4.7 54.2 0.8 –82.3
EXPENDITURES 1,042.1 1,202.0 1,320.8 26.7 1,418.5 7.4
Central government 697.4 823.6 908.2 30.2 954.1 5.1 Personnel 148.1 180.6 182.9 23.5 215.7 18.0 Material 97.6 131.5 142.8 46.3 138.5 –3.0 Capital 80.3 121.7 141.0 75.6 168.1 19.3
Interest 88.4 116.4 106.6 20.6 123.1 15.5
Subsidies 192.7 184.8 237.2 23.1 208.9 –11.9 Energy 140.0 133.8 195.3 39.5 168.6 –13.7
Fuel 82.4 92.8 129.7 57.5 123.6 –4.7
Electricity 57.6 41.0 65.6 13.8 45.0 –31.4 Non-energy 52.8 51.0 41.9 –20.6 40.3 –3.9
Grants expenditure 0.1 0.8 0.4 478.4 1.8 343.7
Social expenditure 68.6 61.5 81.8 19.2 63.6 –22.3
Other 21.7 26.3 15.6 –28.0 34.5 121.3
Transfers to regions 344.7 378.4 412.5 19.7 464.4 12.6
DEFICIT 46.8 115.7 150.8 222.0 125.6 –16.7
(% of GDP) 0.7 1.7 2.1 200.0 1.5 –28.6
FINANCING 91.6 115.7 150.8 64.8 125.6 –16.7
Domestic inancing 96.1 118.7 153.6 59.8 125.9 –18.0
Foreign inancing (net) –4.6 –3.0 –2.8 –39.2 –0.3 –89.5
BASIC ASSUMPTIONS
GDP growth (%) 6.1 6.3 6.5 6.7
Inlation (%) 7.0 5.3 5.7 5.3
Exchange rate (average Rp/$) 9,087 9,300 8,700 8,800
SBI interest rate (average %) 6.6 6.5 5.6 6.5
Crude oil price (average $/barrel) 79.4 80.0 95.0 90.0
Oil production (average ‘000 barrels/
day) 954 970 945 950
a The 2011 change is the difference between the revised 2011 budget and the 2010 ‘actual’ igure; the
2012 change is the difference between the proposed 2012 budget and the revised 2011 budget.
Source: MOF (2011).
growth and inlation, and the need for public spending on infrastructure and social sectors. As the table suggests, the proposed budget announced in August often bears a weak relationship to the revised budget, since the government habit-ually proposes a conservative budget plan to parliament.
Nevertheless, the conservative budget plan for 2012 is in line with the presi-dent’s commitment to achieving a balanced budget by 2014. Based on the budget assumptions, subsidies are planned to fall by an ambitious 12%, and the fuel sub-sidy by almost 5%. This does not factor in any direct reduction in the subsub-sidy, with anticipated cuts being due largely to better management of fuel rationing and the development of alternative fuels.12 The main factor driving the projected fall in total subsidies is a planned increase in electricity prices of 10%. The government has yet to gain approval for this from the parliament (which in 2010 denied a gov-ernment request for a 15% price increase in the proposed 2011 budget).
Capital spending is slated to rise by a signiicant 19%. Besides the standard allocation for roads and bridges, the budget makes provision for a tiny increase of 150 km of new railways and 14 new airports, and also apportions a signiicant share for the maintenance of 36,000 km of roads and over 100 existing airports. Airports appear to have been given priority in the context of a strong focus on connectivity in the Master Plan. Civil service salaries are to be increased by 10% (a real increase of around 5%), and transfers to the regions by 13%.13 Financing is projected to be funded mainly through quite large increases in tax revenues (both income taxes and VAT collections), complemented by small increases in net gov-ernment bond issues (by 6%, accounting for around 10% of total revenue).
Three points should be noted in regard to next year’s budget. First, its growth forecast of 6.7% now appears optimistic, given trends in the world economy. There has already been talk of reducing it to 6.5%, but the government may need to be preparing for possibly larger falls in annual GDP growth in 2012, to closer to 6%, or even lower in a worst-case scenario. Given that commitments to salaries and subsidies account for a large share of the total budget, this would mean cut-ting planned capital expenditure and putcut-ting many pressing infrastructure needs on hold for another year (and also delaying some of the key spending projected in the Master Plan), unless the budget deicit was allowed to increase.14
Second, slow disbursements in capital spending continue to plague develop-ment programs. While the president is said to be putting pressure on ministers to speed up spending, only 27% of total capital spending had been disbursed in the irst eight months of 2011, according to the inance minister.15
12 The latter strategies were already part of the policy package in the 2011 budget, but ap-pear unlikely to affect the consumption of subsidised fuel (McLeod 2011).
13 The inance ministry is considering the option of offering early retirement to a portion of the 20% of civil servants aged over 50, in an attempt to free up more money for capital expenditures (Jakarta Post, 19/8/2011).
14 However, a major world recession would result in a signiicant fall in international oil prices, and hence reduce the burden of the fuel subsidy.
15 Economist Haryo Aswicahyono, cited in the Jakarta Post (13/09/2011), highlighted the importance of understanding the reasons for the slow speed of allocations to the regions: in areas such as education, spending is often delayed intentionally by regional governments, who gain revenue from irst depositing the funds in bank accounts.
Finally, the cost of energy subsidies was almost 40% higher in the revised than in the proposed 2011 budget (rising from Rp 134 to Rp 196 trillion). This was associated with both the increase in world oil prices (and hence the value of subsidy to consumers of subsidised premium fuel), and parliament’s refusal to permit an increase in electricity prices. The government’s failure to act on fuel subsidies is severely limiting its ability to promote longer-term development through increased spending on public works. As previous surveys have noted, this approach, in turn, puts structural pressure on the supply side of the economy and contributes to a ‘high-cost’ economy.
In the context of tight political constraints, the president’s commitment to cut the budget deicit to zero in 2014 is likely to squeeze spending on public works even more. Several agencies in Jakarta have calculated how a balanced budget might be achieved by raising fuel and energy prices, the revenue from which could be used to compensate losers (especially the poor) as well as freeing up money for spending on public works.16 This signiicance of the squeeze is even the greater, given the ambitious targets for capital spending under the Master Plan (see below).
INDUSTRY POLICY: A MORE DIRIGISTE STANCE
The government has announced a number of moves towards greater interven-tion in industry and trade policy in recent months. We consider recent policy announcements or proposed policies in four areas. The irst relates to tax incen-tives, the second to protection of domestic salt producers, the third to protection of local luxury goods producers, and the fourth to the regulation of domestic processing of natural resources, speciically of thermal coal. These illustrate two dimensions of economic policy and policy making: a tendency towards rather easy options involving direct support for domestic industry or particular sectors and investors, and signs of some disharmony in policy directions within the eco-nomics team under coordinating minister Hatta Rajasa.
On 15 August the inance minister, Agus Martowardojo, announced the intro-duction of a 5–10 year tax holiday for companies investing at least Rp 1 trillion (approximately $117 million). Not only are the tax incentives selective, giving a boost to large investors; they also focus on downstream and capital-intensive investors. The tax incentive regulation covers ive key sectors: base metals; oil reining; petrochemicals; machinery; and telecommunications equipment. The minister also announced (subject to presidential approval) a revision of tax allow-ances for irms investing a minimum of Rp 500 billion (approximately $55–60 mil-lion), contingent on the employment of a minimum number of workers.17 The Korean multinational Posco (a steel maker), Kuwait Petroleum (with a mooted
16 One such calculation notes that without a reduction in expenditure on subsidies, a bal-anced budget could be achieved only by a freeze on nominal material, capital and social spending.
17 The incentives are to be offered if the irm satisies a list of other criteria such as oper-ating in an isolated environment; collaboroper-ating with small and medium enterprises; and supporting the Master Plan. Establishing ground rules is likely be dificult, and the overall administration of such tax breaks is likely to be corruption prone.
investment of $6–7 billion) and Hankook Tire (interested in investing $353 million) were all mentioned explicitly in the media as contenders for the tax concessions (Jakarta Globe, 10–11/9/2011).18 Clearly the government was upbeat about the announcements. To quote Gita Wirjawan, then Investment Coordinating Board chair and now the new trade minister, echoing the enthusiasm of industry minis-ter Hidayat: ‘The impact will be huge. They can help us reach our 2011 investment target’ (Jakarta Globe, 16/08/2011: 1).
Several reports noted the enthusiasm of automotive companies to take advan-tage of the new tax incentives. An article entitled ‘Indonesia’s dream to become an auto nation’ (Globe Business, 20–21/08/2011) reports that General Motors and Peugeot are planning to revive assembly of automobiles in Indonesia; Tata is planning new investment; Toyota, Nissan and Suzuki are planning expansion of existing plants; and Daihatsu and BMW have already expanded their plants. An industry spokesperson suggested optimistically that it would take Indonesia only two years to overtake Thailand in terms of sales. Thailand has been the dominant producer in the region for more than a decade, producing twice as many vehicles as Indonesia annually (around 1.5 million), with half or more targeted for export. Understandably, several economists expressed doubts about the predicted ben-eits of the tax incentives, despite enthusiasm in the business community for the new regulations. In response to excited statements in the media about how the incentives would encourage industries like automobiles to make their regional base in Indonesia, Fauzi Ichsan, economist with the Standard and Chartered Bank, was less sanguine. To replace Thailand as the region’s number one auto producer, he suggested, ‘would take improvement in infrastructure and this will take a long time. … Without infrastructure to create a production base capable of exports, Indonesia can’t compete as a major player at the global level’ (Globe Busi-ness, 20–21/08/2011).19
Given that a thriving component parts sub-sector is already well established in Thailand, it is not clear that Indonesia could compete on a signiicant scale in international or regional markets. One fear is that, if irms do relocate to Indo-nesia, high domestic costs will prevent them from competing internationally, and thus they will remain oriented mainly to the domestic market and create a power-ful lobby for protection. Indonesian consumers will then be robbed of access to cheaper products from Thailand and other neighbouring countries.
While consistent with the foreign investment law, the resort to discriminatory tax policies as a means of promoting industry opens the door further to lobbying by business on a range of fronts, and smacks of dirigiste policies based on ‘pick-ing winners’, which have rarely been successful in Indonesia.20 While small and
18 It is reported that some 40 Korean companies are planning to set up plants to sup-port the operations of Posco, which has established a joint venture with Krakatau Steel in Cilegon, Banten (Jakarta Post, 27/08/2011).
19 Similar views were expressed, more generally, by economist Purbaya Yudhi Sadewa of the investment bank Danareksa, who argued that ‘… the old hurdles like transportation costs, electricity availability and the cost of doing business are the key issues for manufac-tures to return to their glory days’ (JakartaGlobe, 12/9/2011).
20 Another selective tax policy to promote Indonesian industry was announced earlier in 2011, with a proposal for additional taxes on imported ilms to protect the domestic indus-try (Online Asia Times, 19/07/2011).
medium enterprise activity is promoted through other policies, critics will not miss the focus on larger irms in the new tax holiday regulations, or the fact that the incentives are more likely to be taken up by foreign investors.
A second issue that came to a head in September 2011 was the decision of the Coordinating Minister for Economic Affairs to ban salt imports for consumption for the rest of 2011 (Jakarta Globe, 31/1/2011; 22/3/2011, 13/04/2011; Jakarta Post, 9/8/2011). Indonesia produces 1.2–1.6 million tonnes of salt a year, far less than the national consumption of 4–5 million tonnes. A government regulation bans imports one month before and after the normal harvest of salt in August–October each year, but the trade minister had permitted imports earlier in the year owing to reported shortages in the domestic market.
In August, the Minister for Maritime Affairs and Fisheries (MAF), Fadel Moham-mad, took the unusual step of impounding imported salt in several warehouses in Banten, only to ind that the Ministry of Trade had permitted the imports.21 MAF is aiming for self-suficiency in salt production in 2014, and is providing assistance to small salt producers across the country, and especially to poorer farmers in Eastern Indonesia, to achieve this goal. The Ministry of State Enterprises is also involved in providing support (reportedly of $50 million) for PT Garam, a major salt producer but a reportedly ailing state enterprise. The government hopes PT Garam will play the role of managing salt stocks in much the same way as Bulog manages rice stocks. Yet several reports suggest that the poorly managed PT Garam is not in a position to take on this role. Achieving self-suficiency in salt will be dificult unless private businesses are permitted to compete with PT Garam in purchasing and marketing. What was remarkable about the public debate during the Banten dispute was the almost exclusive focus on production self-suficiency, without any attention to the quality and price of domestic salt provided to Indonesian consumers.
On September 2011, industry minister Hidayat announced the possible imposi-tion of taxes on luxury goods such as the BlackBerry, in response to the decision of the BlackBerry’s producer, the Canadian irm Research in Motion (RIM), to set up a factory in Penang (Malaysia) (Jakarta Globe, 8/09/2011). RIM has been seeking to expand operations in Southeast Asia, where Indonesia is the major market for the BlackBerry, accounting for some 75% of all sales in the region, and reportedly almost 10 times the annual sales of 400,000 in Malaysia.
Then BKPM chair Gita Wirjawan appeared perplexed by the decision. He asked why RIM had chosen Malaysia over Indonesia when Indonesia was the com-pany’s major market, and speculated that perhaps one reason was Indonesia’s demand that RIM set up a data centre in Indonesia. It is not hard to answer his question. Penang has been a world centre for electronics and electronic service activities for nearly three decades, whereas Indonesia has had a chequered record in attracting multinational electronics irms because of poor infrastructure and lack of supporting industries.22 While the luxury tax is still at the proposal stage,
21 The conlict was inally resolved in September through the intervention of the Coor-dinating Minister for Economic Affairs, Hatta Rajasa, but not before an unseemly public dispute.
22 There is a history of tension between RIM and the government, with the latter pressur-ing the company to establish service and repair units in Indonesia durpressur-ing 2010 (Jakarta Post, 14/1/2011). For an account of factors contributing to the success of the electronics industry in Penang, see Athukorala (2011) and Soejachmoen (forthcoming).
it relects the ever-present tension between Indonesia’s commitment to an open economy – championed by the recently replaced trade minister and ostensibly supported by the president – and the more protectionist leanings of several other cabinet ministers.
Finally, the dificulty of implementing the provisions on domestic processing of natural resources in Law 4/2009 on Mineral and Coal Mining has been high-lighted in connection with the regulation on thermal coal processing.23 The latest draft of a ministerial instruction mandating the treatment of low-quality coal is reported to impose additional costs on some producers. Increased shipping and production costs resulting from the regulation (and the likelihood of more strin-gent processing regulations affecting a larger number of producers in the future) could well result in reduced exports and revenue from the sector.24 The industry is still set to thrive in the short to medium term. However, uncertainty about the directions and timing of changes in the regulatory framework have created an impression of ad hoc policy making. If passed, the regulation is likely to affect seri-ously at least one major importer of low-grade thermal coal (Cowhig 2011).
By themselves, these developments certainly do not signal a retreat from an open, competitive economy. Some of them relect typical policy tensions between different ministries that are inevitable in a vibrant democracy, and are a manifes-tation of the competition between nationalist and internationalist sentiments that is common to many countries. But there is a sense among internationally oriented observers that the economics team in SBY’s second cabinet has been less commit-ted to a coherent set of trade and investment strategies than that of the irst SBY cabinet, when Sri Mulyani and Boediono oversaw policy directions. The current economics coordinating minister, Hatta Rajasa, has shown himself to be adroit at managing conlicts between his ministers when issues come to a head. However, there is an impression that economic policy is less predictable and more vulnera-ble to inluence from business and interest groups than in the immediate past. The ‘removal’ of Mari Pangestu from the trade ministry in October and her replace-ment by Gita Wirjawan suggests that the dirigistes may have won out, at least for the present. It may also be true that the old adage that ‘good times make for bad policies’ applies to Indonesia in the current fairly benign economic environment.
LABOUR MARKETS AND MIGRATION
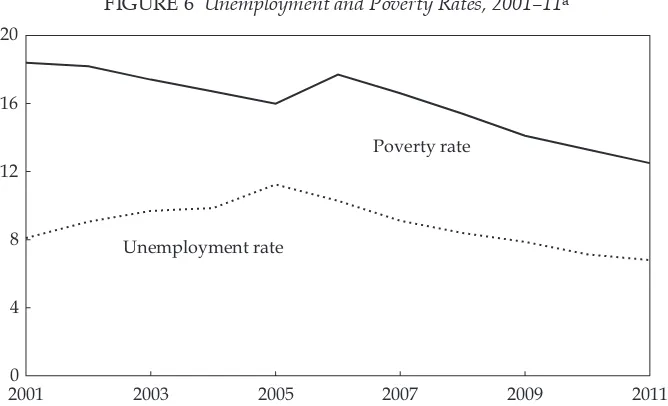
Despite the favourable macroeconomic picture, controversy persists about whether labour market conditions have really improved, or whether the improvement is signiicant enough to impact on productivity, wages and, ultimately, poverty. The oficial data suggest that, in aggregate, labour market conditions in Indonesia have picked up in the last ive years.25 The unemployment rate declined steadily, by almost one percentage point per annum, from 11.2% in November 2005 to 7.1% in
23 For a discussion of Law 4/2009,see Gandataruna and Haymon (2011).
24 The regulation’s proposed restrictions on exports of coal with less than a speciic calo-riic (energy) value are likely to make Indonesian exports less competitive with Australian coal exports for expanding Indian and Chinese markets(Alford 2011).
25 Unless otherwise stated, data cited in this section are taken from the National Labour Force Surveys (Sakernas) conducted each August by BPS.
August 2010, uncannily falling at almost the same rate as poverty (igure 6).26 The much higher youth unemployment rate (ages 15–24) was reported to have fallen from 33% to 21% during the same period, a fall of similar magnitude in relative terms (table 5). At the same time, total employment grew on average at 2.7% per annum (outpacing the growth of the working age population by 1%), supported by growth in manufacturing and in community, social and personal services. Mean-while, the share of employment in agriculture declined during this period, espe-cially among youth (from 41% in 2005 to 32% in 2010). By 2010, services employed more workers than agriculture, reversing their relative positions ive years earlier.
On the other hand, the informal sector still absorbed 60% of employment in 2010, only slightly down from the 2005 level. More than one-third of all workers were working less than 35 hours per week in 2011, and working shorter hours was involuntary for almost half (the rest were part-time workers). At the same time the number of casual workers outside agriculture continued to increase signiicantly, rising by 30% in 2005–09, at a time when the number of regular workers barely increased. BPS data from the wages survey suggest that real wages in manufac-turing have not risen since 2004 (Papanek 2011).27 The labour market experienced
26 See Suryadarma and Sumarto (2011) for details on poverty. Unemployment consists mainly of persons without work but looking for work, and discouraged workers without work who did not look for work because they did not expect to ind a job (BPS, Sakernas, August 2010).
27 Analysis by Papanek (2011) based on the farmers’ terms of trade data shows, however, that agricultural wages rose over the past three years (after falling during the period of rice price instability in 2008). See also World Bank Economic Sector, Jakarta, work in progress, cited above (which shows quite small real wage growth in Indonesia).
2001 2003 2005 2007 2009 2011
0 4 8 12 16 20
Poverty rate
Unemployment rate
FIGURE 6 Unemployment and Poverty Rates, 2001–11a
a All Sakernas data are for the August round of the survey except for 2011, which is based on the February round.
Source: BPS, Susenas (National Socio-Economic Survey) and Sakernas (National Labour Force Survey), various years.
additional pressures because of a government ban on sending domestic workers to Saudi Arabia, which is likely to affect younger female workers in particular (box 2).
Youth unemployment
More importantly, although youth unemployment has dropped signiicantly from its 2005 level, the rate is still far higher than the overall unemployment rate (table 5) and higher than in neighbouring countries.28 Recent political turmoil in Egypt and other Middle Eastern countries has highlighted the seriousness of this: arguably, one of the main triggers for the fall of Hosni Mubarak in Feb-ruary 2011 was high youth unemployment and the poor-quality jobs that were available for young Egyptians (Economist, 10/9/2011). The Middle East crisis has turned the Indonesian government’s attention to its own unemployed youth and the quality of jobs available to them.
Some have argued that unemployed youth in Indonesia are relatively educated youth from middle-class families who can generally afford to spend more time searching for a better job in a segmented labour market (Manning and Junankar 1998). It is also argued that a mismatch between demand and supply of youth
28 In 2008/09, youth unemployment in the Philippines, Malaysia and Cambodia was 13.9%, 12.3% and 10.5%, respectively. In Vietnam and Thailand it was below 5%, much lower than Indonesia’s 2010 rate of 21% (ADB 2010).
TABLE 5 Labour Market Conditions
All Ages (15+) Youth (15–24)
2005 2010 2005 2010
Working age population (million) 158 172 42 41
Participation rate (%) 67 68 53 49
Unemployment rate (%) 11 7 33 21
Employed population (million) 94 108 15 16
Formal sector (%)a 37 40 41 46
Informal sector (%)a 63 60 59 54
Urban (%) 40 42 39 44
By major sector
Agriculture (%) 44 38 41 32
Industry (%) 19 19 26 25
Services (%) 37 42 34 43
100 100 100 100
a The formal sector includes all wage employees (regular and casual), and self-employed people in the non-agricultural sector who engage family workers. The informal sector covers all family work-ers, self-employed people who do not engage family workwork-ers, and self-employed people working in agriculture who engage family workers.
Source: BPS, Sakernas (National Labour Force Survey).
workers is a major source of high youth unemployment. Di Gropello, Kruse and Tandon (2011) found that the skills of most young Indonesians, especially recent graduates, are below the level employers require – especially their Eng-lish language skills, but also creative talent and computing and other technical skills. The large proportion of secondary school graduates among unemployed youth is consistent with both the ‘middle-class’ and the ‘mismatch’ arguments. Even among young Indonesians who are already working, around one-third are under-employed, especially in rural areas. These patterns have been evident throughout the past decade, pointing to a long-term problem that needs to be tackled.
In 2005, in response to the high youth unemployment rate and skills mismatch, the Ministry of National Education announced a plan to aim for an enrolment ratio of 30:70 for general senior secondary schools (Sekolah Menengah Umum, SMUs) to vocational senior secondary schools (Sekolah Menengah Kejuruan, SMKs) by 2015, reversing the ratio in 2005, which favoured the SMUs (World Bank 2010). However, according to one authoritative source, the plan has recently been informally shelved. This was probably a good decision, because there are
BOX 2 MigranT WOrkersandThe saudi MOraTOriuM
Another recent pressure point in Indonesia’s labour market is a ban from 1 August 2011 on all new contracts for migration of domestic workers to Saudi Arabia. The decision was triggered when an Indonesian maid was beheaded there, just four days after the president had committed Indonesia to the International Convention on Domestic Workers (Kompas, 18/6/2011). The incident intensiies pressure on the government to deal seriously with mistreatment of domestic workers abroad, long a controversial issue in the public domain.
While the moratorium applies only to domestic workers, its labour market impact will still be considerable, Saudi Arabia being the largest destination of Indonesian domestic workers after Malaysia. An estimated 15–20 thousand workers are sent to Saudi Arabia per month. They contribute around 5% of Indonesia’s total remittances of Rp 60 trillion (Jakarta Post, 11/6/2011; Jakarta Globe, 1/8/2011).
In anticipation of the immediate impact, the government plans to allocate Rp 1.4 trillion ($162.5 million) from the National Program for Community Empowerment for training and education programs targeting women, especially in the cities and regions most affected by the moratorium (Jakarta Post, 11/6/2011). Staff of the National Agency for the Placement and Protection of Indonesian Migrant Workers (Badan Nasional Penempatan dan Perlindungan Tenaga Kerja Indonesia, BNP2TKI) suggest that sending skilled manpower abroad in government-to-government (G-to-G) programs will help ill the gap created by the moratorium.
However, major supply constraints remain in providing skills for the international market. For example, the G-to-G program with Japan to supply 1,000 nurses and care workers, initiated in 2008, had placed only 791 nurses and care workers by June 2011 (BNP2TKI 2011). Although Indonesia has many nursing academies and health polytechnics, the gap is large between the quality demanded and that supplied for overseas employment, even before language and cultural differences are considered. The loss of remittances from overseas work is likely to have a signiicant impact on the families involved and their regions, and on national foreign exchange earnings from migration, for some years to come.
no strong connections yet between industry and vocational schools – a necessary condition for the success of a vocational system at secondary school level.29 Inter-national evidence suggests that most skills for the workplace are best acquired after secondary school (Adams 2007). Furthermore, the wage premium for voca-tional over general school graduates is small, and has decreased in recent years, especially for males (Newhouse and Suryadarma 2011), and there is no strong evidence of a shift in demand by students for vocational rather than general (aca-demic stream) schooling (Di Gropello, Kruse and Tandon 2011).
The revitalisation of vocational training centres (balai latihan kerja, BLK) has also been proposed as a long-term solution for the provision of informal educa-tion (Di Gropello, Kruse and Tandon 2011). However, few observers regard this as feasible, because most BLKs are in poor condition, especially since decentralisa-tion: regional governments have generally been reluctant to provide funding for these centres, formerly managed by the Ministry of Manpower and Transmigra-tion (World Bank 2010). Furthermore, the cost-effectiveness of some of the ‘suc-cessful’ BLKs has been questioned; several were found to produce limited output for a high cost (some turning out only a handful of graduates each year). In some cases, their costs per person were even higher than those of tertiary institutions.
The government regulates the certiication of skills under Law 13/2003 on Manpower, and Government Regulation 23/2004 on the National Professional Certiication Board (Badan Nasional Sertiikasi Profesi, BNSP) sets out the proce-dures for establishing and certifying national skill standards. The implementation of this regulation has created some major problems, especially for skills that need to meet international standards. According to the Manpower Law, the BNSP is the only body that can set national competency standards, and the Ministry of Man-power and Transmigration jealously guards this monopoly. In some cases, rather than fully adopting existing international standards that already apply in Indo-nesia, BNSP re-examines and re-assesses them, often seriously delaying the certi-ication process (as in the case of the certicerti-ication of seafarers already recognised by the International Maritime Association). Furthermore, many irms, especially foreign irms, do not yet recognise certiication by BNSP, because the process of setting standards lacks professionalism.
Labour regulations
Labour regulation is still viewed as an obstacle to doing business in Indonesia, with earlier studies suggesting a need to review the labour law. Most informed observers concerned with job creation see reform of labour regulations, particu-larly severance payment systems, as necessary. The government has put labour reform to one side ever since it was judged too dificult politically in 2006 (Man-ning and Roesad 2006), although the Master Plan identiies labour law as a prior-ity area for regulatory reform. The Ministry of Manpower and Transmigration has been silent on the issue since 2006. Disruption caused by recent corruption scandals within the ministry probably reduces the prospect of its tackling unpop-ular reforms soon, especially in the face of strong union and other NGO opposi-tion. This is understandable politically. The only labour market indicator widely
29 One exception to this is that vocational secondary schools for chemical analysts are re-ported to have a strong connection with the industry (Di Gropello, Kruse and Tandon 2011).