Full Terms & Conditions of access and use can be found at
http://www.tandfonline.com/action/journalInformation?journalCode=cbie20
Download by: [Universitas Maritim Raja Ali Haji] Date: 17 January 2016, At: 23:48
Bulletin of Indonesian Economic Studies
ISSN: 0007-4918 (Print) 1472-7234 (Online) Journal homepage: http://www.tandfonline.com/loi/cbie20
The role of foreign direct investment in Indonesia's
manufacturing exports
Rudy Rahmaddi & Masaru Ichihashi
To cite this article: Rudy Rahmaddi & Masaru Ichihashi (2013) The role of foreign direct investment in Indonesia's manufacturing exports, Bulletin of Indonesian Economic Studies, 49:3, 329-354, DOI: 10.1080/00074918.2013.850632
To link to this article: http://dx.doi.org/10.1080/00074918.2013.850632
Published online: 05 Dec 2013.
Submit your article to this journal
Article views: 1004
View related articles
ISSN 0007-4918 print/ISSN 1472-7234 online/13/030329-26 © 2013 Indonesia Project ANU http://dx.doi.org/10.1080/00074918.2013.850632
THE ROLE OF FOREIGN DIRECT INVESTMENT IN
INDONESIA’S MANUFACTURING EXPORTS
Rudy Rahmaddi andMasaru Ichihashi*
Hiroshima University, Japan
This article examines whether foreign direct investment (FDI) has contributed to the changing structure of Indonesia’s manufacturing exports. It uses industry-level
data from 1990 to 2008, classiied by factor intensity. Our analysis reveals that FDI
promotes exports in most panel observations, especially exports from physical-capital-intensive (PCI), human-physical-capital-intensive (HCI) and technology-intensive (TI) industries. Yet by applying a differentiated cross-section-effect model, we de-termine that the export-generating potential of FDI is stronger in PCI, HCI and TI industries than in natural-resource-intensive or unskilled-labour-intensive
indus-tries, in which Indonesia has a comparative advantage. We also assess the inluence
of other determinants of export performance – namely, private domestic capital
investment, GDP growth and exchange rates. Our indings have implications for
policymakers seeking to sustain Indonesia’s export performance.
Keywords: export performance, foreign direct investment, panel analysis
INTRODUCTION
Following the collapse of global oil prices in the mid-1980s, Indonesia liberal-ised its trade policies in a bid to increase exports. This strategy replaced that of import-substituting industrialisation, which could no longer be counted on to promote high growth into the 1990s. Indonesia realised that it needed a new source of foreign-exchange earnings and economic growth; its policy pendulum swung towards export-oriented industrialisation, led by the private sector and based on inputs other than natural resources. Indonesia’s economy subsequently saw large increases in foreign direct investment (FDI)1 and continuous growth in
* We wish to thank the two anonymous referees of this article, for their invaluable com-ments on an earlier draft. We are also indebted to R.S. Hanung Harimba Rachman for providing (and explaining) data on permanent business licences in Indonesia. Rahmaddi would also like to thank the Ministry of Finance of the Republic of Indonesia for providing
full inancial support under phase three of the Professional Human Resource Development
Project. The usual disclaimers apply.
1 FDI may take many forms, including greenield investment, horizontal and vertical
mergers and acquisitions, and portfolio investment via the capital market (aimed at exer-cising control). The data referred to in this article do not cover the last of these. In addition,
the effect of FDI outlows on exports is beyond the scope of this analysis, which uses the
terms FDI and foreign investment interchangeably to refer to FDI inlows.
manufacturing exports. A closer look at the latter indicates that although the com-modities of Indonesia’s natural-resource-intensive (NRI) and
unskilled-labour-intensive (ULI) industries – such as cork and wood, textiles and garments, and
leather and footwear – occupied most of the total value (in real dollars) of man-ufacturing exports during 1990–2008, their average annual growth rate of 2.4% was lower than that of the commodities of Indonesia’s physical-capital-intensive (PCI), human-capital-intensive (HCI) and technology-intensive (TI) industries (8.2%), owing to increased export growth in road vehicles and other transport equipment (including components) and in electronics goods. Meanwhile, foreign investment in the manufacturing sector dominated total realised FDI in
Indone-sia: more than 75%, or $108.9 billion, of all foreign investments lowed into the
PCI, HCI and TI industries.2 This suggests a plausible linkage between FDI and industry-based export performance, and implies that the structure of Indonesia’s manufacturing exports has changed. Research into the effect of FDI on industry-based manufacturing exports therefore deserves attention.
Given the importance of differential analysis in assessing the scale and
perfor-mance of FDI lows in exports across industries, past studies that scrutinise the relationship between FDI and trade at the aggregated level may not be suficient.
Although useful, such studies may fail to capture variations in the interactions of FDI and exports at the disaggregated level (Kawai and Urata 1998). In contrast,
cross-industry variation analyses of FDI’s export-generating potential may inlu
-ence those designing development strategies or promoting the beneits of FDI to speciic industries, especially in countries that rely on foreign direct and indi -rect investment to transform their industrial sectors. Such analyses could even be expanded on, to seek out policy implications that dovetail into sustaining export performance through export-led growth 2.0 (Haddad and Shepherd 2011).3 Yet few empirical studies of Indonesia have examined the linkage between FDI and manufacturing exports at the disaggregated level.4
In this article, we attempt to close the gap in the empirical research by analys-ing the effect of FDI on Indonesia’s manufacturanalys-ing exports by different industries during 1990–2008. To do so, we use realised FDI data, which have an advantage over approved FDI data in measuring the degree to which FDI affects export
per-formance, because they better capture actual inlows of foreign investment into
the domestic economy (after this investment has been implemented in projects). We also ask whether the growth in Indonesia’s manufacturing exports can be attributed to FDI, and whether FDI has different export-generating effects in
dif-ferent manufacturing industries (classiied by factor intensity). We then examine
2 According to Indonesia’s Investment Coordinating Board (Badan Koordinasi Penanaman
Modal BKPM), which excludes foreign investment in oil and gas and the inancial sector.
3 Export-led growth 2.0 refers to the next generation of export- or outward-oriented poli-cies that aim to sustain export performance. These include, for example, managing the external and internal risks that come with outward-oriented policies; diversifying exports; liberalising South–South trade; encouraging FDI in export-oriented industries, to pro-mote technology transfer and spillover; and promoting international integration. See also Haddad and Shepherd (2011).
4 Ramstetter (1999), Van Dijk (2002), Narjoko (2009), and Narjoko and Maidir (2009) are exceptions.
other macroeconomic determinants of manufacturing exports – namely, private domestic capital investment, GDP growth and the exchange rate. We focus here on the manufacturing sector, which has the dominant share of the value of Indo-nesia’s merchandise exports and accounts for more than 90% of IndoIndo-nesia’s FDI. The rest of this article is organised as follows. Following a brief overview of FDI and trends in the performance and structure of Indonesia’s manufacturing exports, we review the related literature on the linkage between FDI and exports. We then describe our methodology and choice of data, before elucidating on our empirical results and providing some possible policy implications.
INDONESIA: FOREIGN DIRECT INVESTMENT AND MANUFACTURING EXPORTS
Indonesia’s strategy of promoting exports has seen FDI increase rapidly, owing to a bold and decisive series of economic reforms that started in the mid-1980s. These reforms covered exchange-rate management, including two large nominal
depreciations, in 1983 and 1986; prudent iscal policy; comprehensive tax reform; a more open posture towards foreign investment; and inancial deregulation (Hill
1996; Ishida 2003). Below, we discuss liberalisation packages relevant to invest-ment and trade.
To attract more foreign investment, in 1985–86 the Indonesian government relaxed foreign proprietary restrictions and divestment requirements for
export-oriented investment and for irms in bonded zones. Later, Regulation 17/1992 on
the Requirements for Share Ownership in Foreign Capital Investment Compa-nies, followed by further programs that facilitated investment, allowed for 100% foreign proprietorships and less stringent divestment requirements for invest-ments in certain regions, bonded zones and sectors, with descending investment
thresholds. The government also used iscal measures to attract foreign capital,
introducing tax incentives and duty exemptions as well as providing legal protec-tion for foreign investments. These timely pull factors coincided with a wave of manufacturers relocating to East Asian economies in search of lower production costs to mitigate push factors such as appreciating currencies, the abolition of foreign-exchange controls, and rising labour costs at home (Aziz 1998; Pangestu 2002; Thee 2005).
To promote manufacturing exports, the government sought to liberalise trade by relaxing restrictions on foreign investment in export-oriented industries,
tack-ling ineficient levels of bureaucracy (including reforming Indonesia’s customs
system), minimising trade protections such as non-tariff barriers, and reducing import tariffs. The average (unweighted) tariff rate was cut from 27% in 1986 to 15% by 1995, and the proportion of tariff lines subject to these barriers fell from 32% to 12% (Snodgrass 2011). Indonesia’s ongoing liberalisation of import tariffs complemented the ASEAN Common Effective Preferential Tariff (CEPT) scheme,
which generally reduced existing tariff rates to 20% or below within ive to eight
years, starting on 1 January 1993. Some of these covered more than 37,600 tar-iff lines in the manufacturing sector (tables 1a and 1b). Exporters were also pro-vided with a drawback system for import duties, under which tariffs imposed on imported raw materials and parts were refunded when companies exported the
inished products.
As a result of those investment and trade-liberalisation packages, foreign investment and export performance improved considerably during the mid-1980s. The amount of net FDI as recorded in the balance of payments climbed
from $0.4 billion in 1986 to $6.2 billion in 1996. Following negative net inlows from 1998 to 2003 – triggered primarily by the 1997–98 Asian inancial crisis, and
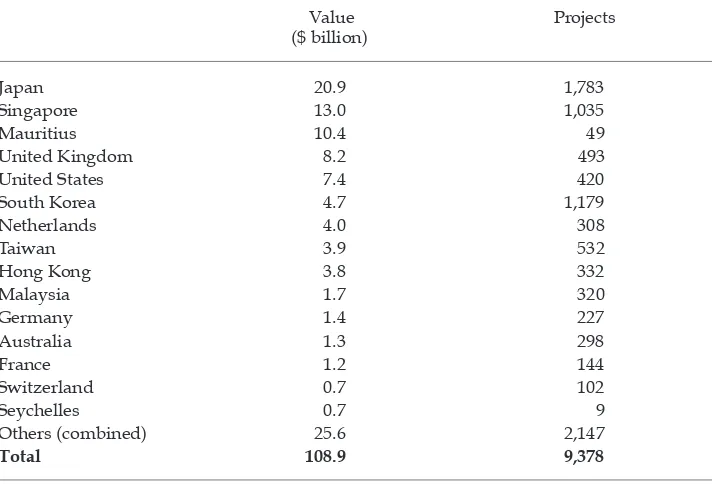
later exacerbated by local economic disruptions – these numbers have increased further since 2004. Total realised foreign investment from 1990 to 2008 accounted for 9,378 projects and $108.9 billion (table 2).
TABLE 1a Indonesia’s Manufacturing Tariffs (NRI–ULI Industry Group) under
ASEAN’s Common Effective Preferential Tariff Scheme, 1996–2008
(%)
1996 1997 1998 1999 2000 2001 2002 2003 2004 2005 2006 2007 2008
Footwear 26.0 23.2 18.7 18.3 13.8 13.6 9.3 5.0 5.0 3.3 3.3 2.9 2.3 Other mfg 22.0 19.6 15.8 15.2 11.2 11.0 8.0 4.7 2.8 2.4 2.4 2.3 1.9 Textiles 15.0 12.5 10.5 8.7 4.9 4.9 4.9 4.9 1.9 1.5 1.5 1.4 0.0 Wood 13.0 13.0 11.1 9.3 7.5 6.5 5.4 4.3 0.2 0.2 0.2 0.4 0.4
Leathers 9.2 7.6 6.1 4.7 3.0 3.0 2.9 2.8 3.1 2.8 2.8 3.0 3.0 NMM 3.2 3.2 3.1 3.0 2.9 2.9 2.9 2.9 3.5 3.1 3.1 3.0 1.9
Indonesia 14.7 13.2 10.9 9.9 7.2 7.0 5.6 4.1 2.8 2.2 2.2 2.2 1.6 ASEAN 10.2 9.3 7.9 7.0 5.3 5.1 4.2 3.4 3.7 2.9 2.3 1.8 1.3
Source: ASEAN Secretariat.
Note: NRI = natural-resource intensive. ULI = unskilled-labour intensive. Mfg = manufacturing. NMM = non-metallic minerals. See table 3 for full commodity titles. Figures for Indonesia and ASEAN are averages.
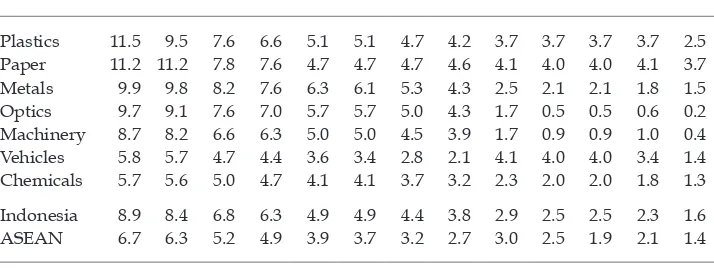
TABLE 1b Indonesia’s Manufacturing Tariffs (PCI–HCI–TI Industry Group) under
ASEAN’s Common Effective Preferential Tariff Scheme, 1996–2008
(%)
1996 1997 1998 1999 2000 2001 2002 2003 2004 2005 2006 2007 2008
Plastics 11.5 9.5 7.6 6.6 5.1 5.1 4.7 4.2 3.7 3.7 3.7 3.7 2.5 Paper 11.2 11.2 7.8 7.6 4.7 4.7 4.7 4.6 4.1 4.0 4.0 4.1 3.7 Metals 9.9 9.8 8.2 7.6 6.3 6.1 5.3 4.3 2.5 2.1 2.1 1.8 1.5 Optics 9.7 9.1 7.6 7.0 5.7 5.7 5.0 4.3 1.7 0.5 0.5 0.6 0.2 Machinery 8.7 8.2 6.6 6.3 5.0 5.0 4.5 3.9 1.7 0.9 0.9 1.0 0.4 Vehicles 5.8 5.7 4.7 4.4 3.6 3.4 2.8 2.1 4.1 4.0 4.0 3.4 1.4 Chemicals 5.7 5.6 5.0 4.7 4.1 4.1 3.7 3.2 2.3 2.0 2.0 1.8 1.3
Indonesia 8.9 8.4 6.8 6.3 4.9 4.9 4.4 3.8 2.9 2.5 2.5 2.3 1.6 ASEAN 6.7 6.3 5.2 4.9 3.9 3.7 3.2 2.7 3.0 2.5 1.9 2.1 1.4
Source: ASEAN Secretariat.
Note: PCI = physical-capital intensive. HCI = human-capital intensive. TI = technology-intensive. See table 3 for full commodity titles. Figures for Indonesia and ASEAN are averages.
TABLE 2 Cumulative Foreign Direct Investment (Realised), 1990–2008
Value ($ billion)
Projects
Japan 20.9 1,783
Singapore 13.0 1,035
Mauritius 10.4 49
United Kingdom 8.2 493
United States 7.4 420
South Korea 4.7 1,179
Netherlands 4.0 308
Taiwan 3.9 532
Hong Kong 3.8 332
Malaysia 1.7 320
Germany 1.4 227
Australia 1.3 298
France 1.2 144
Switzerland 0.7 102
Seychelles 0.7 9
Others (combined) 25.6 2,147
Total 108.9 9,378
Source: Indonesia’s Investment Coordinating Board (BKPM).
Note: BKPM data do not cover foreign investment in oil and gas or the inancial sector; the above data include investment in Indonesia’s manufacturing and non-manufacturing sectors only (that is, in the primary and service sectors). Only the manufacturing, or primary, sector, is relevant to this article. Total accumulated FDI in manufacturing for 1990–2008 was $61.9 billion, 69% of which came from the top 10 countries above. The data were not disaggregated enough to show accumulated FDI in the manufacturing industry by country of origin.
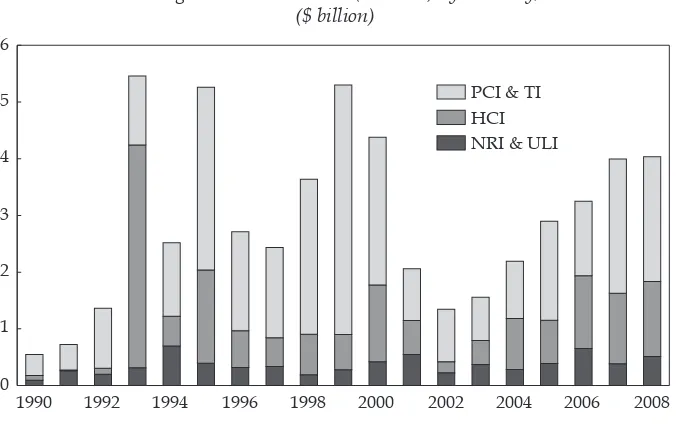
Japanese investment accounted for the largest portion of all realised FDI dur-ing this period, with most investment takdur-ing place in the higher-value-added industries (such as basic metals; metal goods, machinery and electronics (MME); road vehicles and other transport equipment; and chemicals and pharmaceu-ticals). During 1990–2008, the PCI, HCI and TI industries were the main
desti-nations for foreign investment in manufacturing (igure 1); most of it targeted
chemicals and pharmaceuticals and MME.
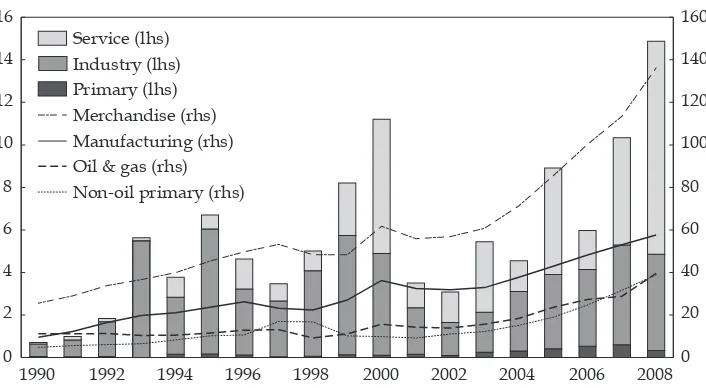
Manufacturing exports (SITC5 5–8) grew by an average of 21.3% (compounded) per year from the onset of the trade-liberalisation era, in 1987, until 1996 – from $4.6 billion to more than $26.2 billion – a nearly sixfold increase over nine years. While the proportion of oil and gas to total merchandise exports diminished from 50.0% in 1987 to 25.4% in 2007, the share of manufactured goods increased from
5 SITC, or the Standard International Trade Classiication of imports and exports. SITC 5 = chemicals and related products, not elsewhere speciied. SITC 6 = manufac
-tured goods classiied chiely by material. SITC 7 = machinery and transport equipment.
SITC 8 = miscellaneous manufactured articles.
FIGURE 1 Foreign Direct Investment (Realised) by Industry, 1990–2008
($ billion)
1990 1992 1994 1996 1998 2000 2002 2004 2006 2008 0
1 2 3 4 5 6
PCI & TI HCI NRI & ULI
Source: Indonesia’s Investment Coordinating Board (BKPM).
Note: PCI = physical-capital intensive. TI = technology intensive. HCI = human-capital intensive. NRI = natural-resource intensive. ULI = unskilled-labour intensive. NRI–ULI comprises cork and wood, textiles and garments, leather and footwear, non-metallic minerals and other manufacturing industries. HCI comprises rubber and plastics, road vehicles and other transport equipment, and pulp and paper/paperboard. PCI–TI comprises chemicals and pharmaceuticals; medical instruments and optics; and metal goods, machinery and electronics.
27.5% to 46.8% (igure 2). The composition of manufactured exports also changed
drastically. Endowed with abundant natural resources and labour, Indonesia has
historically had a comparative advantage in NRI and ULI products. The rise in ULI exports during 1991–2008 can be attributed to the rise in exports of cork and
wood products (mainly plywood) and textiles and garments; the rise in TI exports to the rise in exports of electronics. While the value of textile and garment exports increased more than sixfold during 1987–96, and accounted for 24.8% of all man-ufactured exports, the growth of electronics exports increased from negligible amounts to $3.9 billion, or 14.8% of all manufactured exports. Most of the growth in electronics exports occurred between 1990 and 1996, related to the realisation of foreign investment in technologically complex, higher-value-added industries (as discussed).
The upward trend of export growth among PCI, HCI and TI commodities also saw an increase in the competitiveness of their related industries, whereas between
1993 and 2002 NRI and ULI commodities inlicted a recurrent negative competi -tiveness effect on total manufacturing export growth (Rahmaddi and Ichihashi 2012). From 1987 to 2005, the share of NRI exports fell from 44.0% to 8.0%, while
that of ULI (such as textiles and garments) and TI (such as MME) exports increased
from 26.1% to 32.2% and from 5.4% to 27.2%, respectively. Pangestu (2002) argues that such a shift in Indonesia’s export structure, from NRI to TI products, may explain the performance of manufactured exports. Within 18 years, total manufac-turing exports had increased from a small base of $4.6 billion in 1987 to more than $42.9 billion in 2005, a compounded annual average growth rate of 13.2%.
FIGURE 2 Foreign Direct Investment (Realised) (lhs) and Exports (rhs), 1990–2008
($ billion)
1990 1992 1994 1996 1998 2000 2002 2004 2006 2008
0
Source: Authors’ calculations, based on data from Indonesia’s Investment Coordinating Board (BKPM) and UN Statistics.
Note: FDI = foreign direct investment.
LITERATURE SURVEY
The linkage between FDI and exports
The linkage between inward FDI and a host country’s export performance has
long been recognised in the literature. Yet applied research faces the dificult task
of investigating theoretical predictions on the effect of shifts in production (and exports of factor services) by studying multinational enterprises (MNEs) and their effects on the nature and structure of a host economy’s trade (exports) (Wang et al. 2007). Indonesia’s recent experience may be valuable in investigating how developing countries could realise their export potential when factors and ser-vices are internationally mobile. The substantial differences in factor endowments between Indonesia and more developed countries drive the exports of technol-ogy, management skills and networks and services – as FDI – from these countries to Indonesia, which, according to theory, could stimulate exports from the labour-abundant host country.
Kojima (1973, 1975) and Blomstrom and Kokko (1998) acknowledge the role of complete ‘FDI-carried packages’ of capital, global networks, technology, and management and entrepreneurial skills in improving host economies. Such
pack-ages increase productive capacity and enhance irms’ operating eficiency; they also have industry-wide beneits, by disseminating technology and managerial innovation, which can help average irms be better able to compete in interna -tional markets. FDI should thus increase the volume of a host country’s exports. Yet FDI can also (a) lower or replace domestic savings and investment; (b) transfer technologies that are at a low level or inappropriate, or both, in relation to a host country’s factor proportions; (c) target a host country’s domestic market and not
increase exports; (d) inhibit the expansion of indigenous irms that might other -wise become exporters; or (e) hinder the development of a host country’s dynamic
comparative advantages when there is a narrow focus on local, cheap labour and raw materials (Zhang 2005). The relationship between FDI and a host country’s export performance therefore depends on the nature and motivation of the FDI in question. In general, we may distinguish between the direct and indirect effects of FDI: the former refers to the export activities of MNEs themselves, while the
lat-ter refers to the effect of FDI on the export activities of local irms (Helleiner 1989;
Zhang and Song 2000; Caves 2007).
The direct effects of FDI on a host country’s exports can be classiied into three
categories, based on their production characteristics: (a) the processing of local raw materials, (b) the export of new, intensive products, and (c) labour-intensive processes and component specialisation within vertically integrated international industries (Zhang and Song 2000). First, in processing local raw materials, MNEs may have better competitive positioning than export-oriented
indigenous irms, given that they are likely to have global networks in place, as
well as more advanced marketing skills, superior technology (in both products and processes) and better business acumen. Second, in their attempts to become
successful exporters of new labour-intensive inal commodities such as textiles, footwear and other consumer goods, indigenous labour-intensive exporting irms
face several obstacles to expanding their exports to world markets: setting up a global distribution network (and keeping its members up to date with rapid changes in consumer tastes), mastering the technicalities of industrial norms and safety standards, and increasing the competitiveness of their products. MNEs may
help indigenous export-oriented irms to penetrate world markets, by providing links to inal buyers. Third, exports of labour-intensive commodities within verti -cally integrated industries rely on the participation of MNEs; many such exports
take the form of ‘arm’s length’ transactions between MNEs and indigenous irms
in a host country (Zhang and Markusen 1997), in which host countries import
uninished and intermediate goods and re-export them after additional process -ing and assembl-ing. All of these MNE operations in export activities diversify a host country’s export bundle.
FDI can also inluence a host country’s manufacturing exports indirectly. For example, indigenous export-oriented irms can beneit from the presence of MNEs
by observing and learning from their export activities, so that they themselves can
then penetrate export markets; and local irms can expand their exports by using existing transport, communications and inancial-services infrastructure (Haddad
and Harrison 1993). FDI can also increase the competitiveness of a host country
and accelerate the diffusion of new technologies: MNEs often have irm-speciic
advantages in product or process technology and in management and marketing, so the entry of MNEs into a host country’s markets may increase competition and
encourage existing irms to adopt more-eficient methods, and hence to become
more productive (Zhang and Song 2000). The more productive domestic export-ers there are in a host country, the more likely it is that they will survive in export markets. Thus, the increased competition stemming from the presence of MNEs encourages indigenous exporters to perform well in world markets.
FDI may also create linkages between MNEs and local irms, which may have
another indirect effect on a host country’s exports – technology spillover – often through an MNE’s outsourcing practices. If export-oriented foreign subsidiaries increase their purchases of local inputs or shift their production activities to
local irms, they will improve these irms’ productivity and competitiveness. As irms in host countries acquire new production capabilities, they will not only be
inclined to participate in export markets but they will also be able to produce and
export more diverse and sophisticated products. As such, the diversiication of a
host country’s exports can be seen as another indirect advantage of FDI (Iwamoto and Nabeshima 2012).
Hill and Athukorala (1998) argue that any linkage between FDI and exports
may also depend on the nature of a host country’s speciic investment and trade
regimes. Such a linkage is therefore worth examining empirically.
Selected empirical literature review
Many empirical studies have analysed the linkage between FDI and a host coun-try’s exports, yet their results have somehow been inconclusive. In an aggregate analysis, Horst (1972) measured the effect of US FDI on US manufacturing exports to Canada, using three-digit SITC cross-sectional data from 1963; he found that FDI reduced US exports to Canada, and that Canadian tariffs increased US FDI
(owing to tariff jumping, which drives foreign irms to localise production within
the destination market to avoid tariff or non-tariff barriers). Using annual data
from 1970 to 1998, Sharma (2003) found no statistically signiicant evidence of
FDI having any effect on India’s exports. In contrast, other single-country studies, including O’Sullivan (1993), of Ireland, and Blake and Pain (1994), of the UK, have found that FDI increases a host country’s export performance.
Some cross-country literature using disaggregated data has indicated that FDI’s effect on a host country’s export performance may differ by country, region or industry. Using cross-country data from 1971 to 1992, Pain and Wakelin (1998)
found evidence of FDI inluencing exports in 10 of 11 OECD countries: seven coun -tries saw their exports increase, and three (Japan, Italy and Denmark) saw them fall. In explaining the latter result, the authors argued that foreign investment had targeted relatively closed domestic markets, rather than using each country as an export base. Investigating the effect of inward FDI on regional export perfor-mance in China during 1984–97, Sun (2001) found that the FDI effect was higher in coastal regions than in inland ones. Taking into account differences in factor proportions (that is, of comparative advantage) within manufacturing industries in China, Wang et al. (2007), using 1983–2002 data, found that the effect of FDI on
the manufacturing exports of ULI industries was greater than that on those of PCI
industries.
Recent advances in the literature on the linkages between international trade and investment have emphasised the effect on trade of changes in the compara-tive advantages brought about by foreign investment (Sun 2001). As FDI helps to create an international division of labour and increase the mobility of production factors – that is, not only of capital but also (and more important) of technology, management skills and other knowledge – it may reallocate economic resources and productive capacities according to the relative cost of production in various countries. This may change countries’ comparative advantages, leading to shifts in the structure and patterns of international trade. Sun (2001) suggests examin-ing the industry-based linkages between FDI and exports as a plausible means
of studying FDI’s inluence on the structure of exports. Recent empirical studies
have also been devoted to examining FDI’s role in diversifying host countries’
exports, or in making them more sophisticated – for example, Banga (2006), on
India; Xu and Lu (2007), on China; and Iwamoto and Nabeshima (2012), on a
panel database of 175 countries.
Yet empirical research examining industry-based linkages between FDI and manufacturing exports in the case of Indonesia has been limited, excepting Ram-stetter (1999) and Van Dijk (2002), both of which consider the effect of MNE
activi-ties on export propensity by using irm-level manufacturing data. Both studies
found that, in general, foreign investment increased Indonesia’s exports. More
speciically, Ramstetter (1999), investigating the effect of foreign ownership on the export propensity of 15,949 irms in 1990, 1992 and 1994, determined that irms
with high proportions of foreign ownership had a high ratio of exports to out-put. Van Dijk (2002), using data from Indonesia’s 1995 industrial survey, found that MNEs mostly increased industry-based exports, except in beverages, foot-wear and instruments. Using census data of medium and large manufacturing establishments in 1996 and 2006, Narjoko (2009) revealed that the contribution of MNEs in expanding technological knowledge increased the likelihood of
domes-tic irms entering export markets.
Narjoko and Maidir (2009) examined irm-level data from Statistic Indonesia’s
annual manufacturing surveys (Survei Industri) from 1990 to 2001. They showed
that a higher degree of foreign ownership of irms is associated with improved
export performance but that its effect varies across industries, and that its effect is greatest among labour-intensive industries. A recent study by Jongwanich (2010) on the determinants of the export performance of eight Asian economies
(includ-ing Indonesia) conirms this. Us(includ-ing quarterly data from 1993 to 2008, Jongwanich analysed the impact of total net FDI inlows on total merchandise exports, manu -facturing exports (SITC 5–8), and exports of machinery and transport equipment (SITC 7). The last is expected to capture the growing incidence of international product fragmentation and trade in parts and components. Jongwanich con-cluded that the positive impact of FDI tends to be greatest for SITC 7 products in the short run, and he found substantial evidence that FDI has a long-run export-generating effect on total manufacturing exports only. Nevertheless, most of the above studies do not account explicitly for industry-based variation in the effect
of FDI on manufacturing exports classiied by factor intensity. This classiication
allows us to investigate whether FDI has changed the structure of manufactur-ing exports. This article uses and, to a lesser degree, emphasises disaggregated FDI data and macroeconomic determinants. This approach supports our objective of revealing the differential export-generating effect of FDI across industries and particular macroeconomic determinants of export performance.6
In summary, the results in the studies above seem to support the positive role of FDI in increasing exports. However, given the ambiguous linkage between FDI
6 We acknowledge the advantage of using micro-level data to reveal underlying
mecha-nisms at the irm or plant level in scrutinising variations in the export-generating effect of FDI across industries, while using less-disaggregated FDI data may sufice for pinpoint -ing the export-generat-ing effect of FDI and other macroeconomic determinants of export
performance across regions or sectors (see Leichenko and Erickson 1997; Zhang and Song
2000; Sun 2001).
and a host country’s exports, it is unclear whether FDI affects the export per-formance of industries that hold a variety of comparative advantages. Industry-based analysis is perhaps the most appropriate method of elucidating the true scale and performance of the linkage between FDI and manufacturing exports. This article explores this relationship empirically, using data on Indonesian man-ufacturing exports and inward FDI.
METHODOLOGY AND DATA
Methodology
FDI is not the only factor that inluences the export performance of host countries.
We use a reduced form of the export equation (Goldstein and Khan 1978; Rose 1990; Athukorala 2004; Jongwanich 2010) to show that the level of real manufac-turing exports (in 2000 constant prices), for example, is determined by the real-world income (Y*), a country’s production capacity (represented by gross capital formation determined by foreign and domestic investment, and GDP growth) and the real exchange rate (which represents the price of exports):
X=x Y
(
*, FDIF, DCIF, GDPG, REER)
(1)While real-world income shifts demand, production capacity shifts supply. Yet a small-country assumption implies that as many exports as a country could offer would be absorbed by the world market. Thus, exports should be supply-driven, in this sense (Athukorala and Riedel 1996, inter alia). In other words, the
coeficient attached to real-world income should be insigniicant. Such an assump -tion allows us to estimate some export determinants (including FDI) whenever data on industry-based export price indices are unavailable.
Since FDI tends to affect exports from the supply-side channel – whether directly, via increases in productive capacity in export-oriented industries, or indirectly, via export spillover (Markusen and Venables 1989) – we specify FDI alongside other export determinants: domestic capital investment, GDP growth and the exchange rate (including economic shocks). We do so by modifying an export model used by Goldberg and Klein (1997), Zhang and Song (2000), and Sun (2001):
X it=
α i+
β1FDIFit−1+
β2DCIFit−1+
β3GDPGt+β4REERt
+β5Dcr s st+β6D roct+εit
(2)
where the subscript i and t denote cross-sectional unit and time, respectively; ε is the disturbance term; β1 to β4 are the parameters to be empirically estimated; Xit is the level of manufacturing export value of industry i in year t; FDIFit–1 and DCIFit–1
account for stock levels of FDI and domestic capital investment, respectively, in industry i in year t; GDPGt is the growth rate (as a percentage) of real GDP in year
t; and REERt is the index level of the real effective exchange rate (export-weighted) in year t expressed in year 2000 constant price. To capture the effect of shocks that
may inluence the linkage between FDI and exports, we use two binary dummy
variables: Dcrisist captures the effects of the 1997–98 Asian inancial crisis and
other supply disruptions on manufacturing exports (using the value of unity for 1997–2003, and 0 otherwise), which lasted until 2003;7Dproc
t captures the effect of a change of export procedure (using the value of unity for 1997–2000, and 0
otherwise), which may lead to export misclassiication (for example, see Mudge
1999).8 All variables, except for GDP growth (in percentage form) and the dummy variables (in binary form), are in natural logarithms.
The beta coeficients β1 to β4 are the elasticity of exports with respect to FDI,
domestic capital investment, GDP growth and the export-weighted
foreign-exchange rate, respectively. The value of the coeficient on FDIFit (β1) is of
particu-lar interest in this study, because this coeficient depicts changes in the proportion
of manufacturing exports to total exports in response to a percentage change in
FDI. Lagging explanatory variables FDI and domestic capital investment by one year is justiied, for three reasons: (a) following Leichenko and Erickson (1997),
the effects of investments (such as the modernisation of production facilities, adjustments in production structure and the dissemination of new technology) on export performance are unlikely to take place immediately, since they require
time to inluence production; (b) a lag structure will mitigate any endogeneity
between exports and FDI (Zhang and Song 2000; Sun 2001) and will represent an appropriate sequence, whereby investment precedes production and production
precedes exports; and (c) although the simple irst-order lag structure may not
be entirely appropriate in capturing potential feedback between investments and exports, the relatively short period for the study (19 years) requires a simple lag approach.
In addition to FDI, we specify other variables that may determine the perfor-mance of manufacturing exports. First, our inclusion of domestic investment in the analysis of exports is intended to hold constant the effect of other investments
in general. We expect the coeficient of β2 to be positive, since increases in domestic
capital formation will augment productive capacity, thus enabling producers to
expand their output. Some previous studies (Leichenko and Erickson 1997; Zhang
and Song 2000; Sun 2001) indicated the importance of domestic investment to export performance. Second, we include the GDP growth rate (GDPGt) in order to capture in supply capacity the export-enhancing effect of increased economic
per-formance. Thus, we expect the coeficient β3 also to be positive. We use the rate of
GDP growth, rather than its level, to reduce plausible direct simultaneity between GDP and investment. Ideally, we would use growth in gross industry-based prod-ucts to capture the effect of industry-based economic performance on manufactur-ing exports, but our methodology is limited by the availability of industry-based
7 Many studies, including Pangestu (2002) and Thee (2006), provide detailed explanations
of the effects of the 1997–98 Asian inancial crisis on exports and investment, as well as of
other economic disruptions that follow such a crisis. We use a dummy structure similar to that of Adiningsih et al. (2009).
8 The authors are grateful to an anonymous reviewer for this invaluable insight. As
in-dicated by UN-COMTRADE data, the value of the SITC 9 category (‘Not classiied else -where’) in Indonesia’s exports increased from $0.09 billion (0.2% of total exports) in 1996 to $6.7 billion (12.5%) in 1997 and $8.0 billion (16.4%) in 1998, before decreasing to $0.4 billion
(0.6%) in 2000. Thus, about one-sixth of exports in 1998 were unclassiied.
GDP data that can be matched appropriately with existing data on industry-based
FDI. Last, the exchange-rate variable, REERt, is another typical trade-related
vari-able that may inluence exports, since it represents the competitive factor (the price
effect) of export commodities. Sugema (2005) found evidence of the positive effect of exchange-rate depreciation on Indonesia’s non-oil exports. In our model, REERt
represents an index of the real effective exchange rate (year 2000 = 100), based on the consumer price index and weighted by the currencies of Indonesia’s 15 main export partners. It is constructed in such a way that an increase in REERt
denotes real currency depreciation. As conventional export-demand theory pre-dicts, the depreciation of a country’s currency may give impetus to further export expansion. The depreciation (or appreciation) of a currency makes that country’s export commodities more (or less) competitive, leading to increased (or decreased)
demand in the world market. Thus, we expect the coeficient β4 also to be positive.
Panel data imply that different methods can be used in estimations, including
the ordinary-least-squares (OLS) method and those of ixed effects and random effects. The main problems inherent in the pooled OLS method are that it does
not allow for industry-based heterogeneity and that it assumes that all industries
are homogeneous. The ixed-effects method, in contrast, can capture the
industry-based effect of FDI on manufacturing exports, since it models each effect
explic-itly. Likewise, the random-effects method can acknowledge heterogeneity in the
cross-section. Yet rather than explicitly modelling the predetermined heterogene-ous effect by using an industry-based dummy, the random-effect method assumes that the effects are random, independent and identically distributed over the error term, so that uit=vi εit , where vi denotes the ith industry’s year-invariant unob-served heterogeneity, and where εit is the remaining disturbance (Zhang and Song 2000). Such a random effect can be estimated using a generalised-least-squares
(GLS) method. Hsiao (1986) argues that even though its results might be incon -sistent when the number of observations is small and if the initial values
cor-relate with the effects, the asymptotic bias of GLS is smaller than that of OLS. To obtain the most appropriate inferences based on the ixed-effect or random-effect
method, we use Hausman statistics to test the null hypothesis that the regressors and individual effects are not correlated. On one hand, a failure to reject the null
hypothesis implies that the random-effect method is preferable to the ixed-effect method; on the other, a rejection of the null hypothesis implies that the ixed effect
is appropriate.
We irst estimate equation (2) by using the full sample of manufacturing indus -tries (N= 11) for which we have relevant data to investigate whether growth in Indonesia’s manufacturing exports in general can be attributed to FDI. To ana-lyse the existence, scale and performance of any such relationship at the industry
level, we apply equation (2) to two subsample manufacturing groups classiied by factor intensity: (a) NRI and ULI, which comprise ive industries (table 3); and (b)
PCI, HCI and TI, which comprise six. This method enables us to analyse the effect of FDI on exports across different industries.
Our analytical model can be expanded to elucidate the effect of FDI on each industry, by relaxing the equal-effect restriction on both groups. The results may have imperative implications for the design of development strategy and guide
FDI in speciic industries.
Thus, we now assume that such an effect varies, as follows, across 11 industries:
Xit=α1+ αiD ni n=2
11
∑ +β1FDIFit+ γi(D ni
FDIFit)
n=2 11
∑ +β2DCIFit+β3GDPGt
+β4REERt+β5Dcrisist+β6Dproct+uit (3)
where D is an industry dummy; n is a dummy number; i is the industry (say,
D2i is 1 for textiles and garments, and 0 otherwise); and γi is a differential slope
coeficient, just as αi is a differential intercept that captures an industry’s speciic effect. If one or more of the γi coeficients is statistically signiicant, then one or
more slope coeficients will differ from the base group (for example, if β1 and γ2
are statistically signiicant, then (β1 γ2) will give the value of the FDI coeficient for industry 2) (Gujarati 2004). We estimate equation (3) on the full sample, using
the ixed-effect model. In the following subsection, we describe the data in more
detail and provide a list of the industries in the two main categories.
Data
In this article, we have drawn on industry-based realised FDI datasets (Ijin Usaha Tetap, IUT) obtained from BKPM, which holds three types of FDI data: (a)
approved FDI, the oficial approval of an initial investment plan; (b) an annual investment activity report (Laporan Kegiatan Penanaman Modal, LKPM); and
(c) the IUT, which records the actual (realised) foreign investment disbursed to a
speciic project until it is ready to be initiated. BKPM registers such IUT datasets
as quasi-accumulated (gross) stock data, by industry. A similar typology applies for data on domestic capital investment.9 Since exports are more likely to depend on production capacity or capital (stock) than on additional capital (investment
low), the IUT data are the most appropriate for analysis.10
First we grouped industries by factor intensity, deriving ive main categories: NRI, ULI, PCI, HCI and TI. This typology aligns with that of Aswicahyono and
Pangestu (2000). To synchronise with BKPM’s data on realised FDI and domestic
ixed-capital investment by industry, we regrouped the datasets into two main categories: the NRI–ULI group, and the PCI–HCI–TI group. The former repre -sents industries in which Indonesia has a comparative advantage (the NRI,
9 Using net FDI and domestic investment stocks by industry is beyond our extent here,
owing to the lack of any records of capital outlow or disinvestment by project. Since the realised lows into the projects take place and accumulate for more than a year, they should be suficient for capturing the accumulated effects of FDI and domestic investment on ex -ports. The IUT datasets of FDI and domestic investment, which are available from BKPM, are thus the most complete data on quasi-accumulated (gross) stocks, by industry. The
related explanation is based on the oficial statement of Ir. Hanung Harimba, a former head
of BKPM’s Center for Investment Data and Information (Pusdatin). The use of gross rather than net FDI stocks may result in estimation bias. Any interpretation of results should be made with caution.
10 The datasets are published but are not publicly available; BKPM granted the authors access to the datasets and permission to use them.
low-labour-cost and low-technology industries); the latter a comparative disad-vantage (the capital-intensive and technologically complex industries).11
We match the value in dollars, by industry, of realised FDI (IUT) and domestic
ixed capital investment with the export value of each commodity, by SITC (rev.
2), obtained from the UN Statistics Database of Commodity Trade (Comtrade). The panel datasets cover 11 manufacturing industries during 1990–2008, yielding
11 Combining the NRI–ULI and PCI–HCI–TI industries into two single homogeneous
groups, based on factor intensity, even for econometric purposes, may lead to potential analytical bias, since any given industry can use mixed-factor intensity. For instance, the electronics industry includes labour-intensive assembly processes, and the textiles and
garments industry is capital- and labour-intensive. Lall (2000) distinguishes between
manufactured exports, based on the technology categories involved: resource-based, low technology, medium technology and high technology. With some exceptions for particular
commodities, products of the NRI (resource-based) and ULI industries tend to be labour
intensive and use a low level of technology, whereas those of the PCI, HCI and TI indus-tries use the bulk of Indonesia’s skill- and scale-intensive technologies to produce capital
and intermediate goods. Although not a perfect classiication of industries by factor inten -sity, our attempt indicates approximate differences in technology levels between those two
industry groups. We retain this arbitrary classiication to reveal any relative inluence of
some macro-level determinants on manufacturing export performance in various industry groups. Any interpretation of the results should take such limitations into account.
TABLE 3 Commodity Classiication Based on Factor Intensity
Abbreviation SITC
NRI–ULI group
Cork & wood W 63
Non-metallic minerals NMM 66
Textiles & garments TEX 65, 84
Leather & footwear LF 61
Other manufactured commodities OI 89
PCI–HCI–TI group
Chemicals & pharmaceuticals CP 51, 52, 54, 59
Rubber & plastics RP 57, 58, 62, 893
Pulp & paper/paperboard P 64
Metal goods, machinery &
electronics MME 67–69, 72–74, 76, 77, 751, 752, 759 Road vehicles & other transport
equipment RV 78, 79
Medical & optical instruments MO 87, 88
Source: Indonesia’s Investment Coordinating Board (BKPM).
Note: SITC = Standard International Trade Classiication (rev. 2). NRI = natural-resource intensive. ULI = unskilled-labour intensive. PCI = physical-capital intensive. HCI = human-capital intensive. TI = technology intensive. Initial categorisation follows Aswicahyono and Pangestu (2000) but has been reclassiied to make it compatible with sector-based FDI and domestic investment data available from BKPM.
182 observations within the full sample (unbalanced), 87 for the NRI–ULI group and 95 for the PCI–HCI–TI group. Table 3 provides details of industry classii -cations based on factor intensity and export commodities (the latter of which is based on the SITC of two main industry groups). The data on Indonesia’s real GDP growth come from the World Bank’s World Development Indicators. To construct the export-weighted real effective exchange rate (REER), we use data on the currencies of Indonesia and its trading partners, as well as their CPI values, from the IMF’s International Financial Statistics. The export values of Indonesia’s 15 main trading partners come from UN Comtrade. All of the above data, except GDP growth, are expressed in real, 2000 constant prices.12
EMPIRICAL RESULTS AND DISCUSSION FDI and other export determinants
To investigate the effect of FDI and other variables on the performance of Indo-nesia’s manufacturing exports, we applied the set of regression analyses that use panel estimation models (which we discussed in the previous section) to the full
sample and its two groups of manufacturing exports classiied by factor intensity. Tables 4 and 5 show the results of the pooled OLS, random-effect, ixed-effect and heterogeneous ixed-effect methods. We have mentioned that the pooled OLS
method may pose problems, because it assumes that all industries are homogene-ous, yet its results determine whether the signs of estimation are robust across
dif-ferent estimation methods and relatively stable. Later, we base our interpretations
on the most appropriate method, as suggested by a Hausman or a likelihood-ratio test. Table 4 shows the results of applying equation (2) to the full sample and its subsamples, along with their estimation properties; table 5 shows the results and
estimation properties of applying equation (3) and the heterogeneous ixed-effect
model on the full sample.
The coeficient estimates presented here are the elasticity coeficients of exports
in response to a 1% change in the explanatory variables. In general, the signs of all
the coeficient estimates are as expected, and they are robust in four different esti -mation methods and stable in both the full sample and its subsample esti-mations. For the full sample, the results of the Hausman test (χ2 = 5.871, p < 0.44) indicate
that the random-effect model is the most appropriate estimation model, as shown
in the lower portion of column 1 of table 4. The ixed-effect model is preferred only to the pooled OLS model for the subsample estimation of the NRI–ULI and
PCI–HCI–TI groups, based on likelihood-ratio statistics (χ2 = 207.62, p < 0.00, and
12 Export price indices are not available for disaggregated industries, so we have used
Indonesia’s GDP delator as a proxy. This is justiied, since merchandise exports represent the largest share of total exports (Kee and Hoon 2005). The use of a GDP delator with an
international tradable price index can be found in the literature (for example, Heien 1968; Goldstein and Khan 1976). Our experiment in using CPI and the producer price index as
export price delators gave poor results, and data from the International Financial Statistics
export price index are available only up to 2005. In addition, we use the gross-capital-formation (GCF) price index – calculated by dividing the current GCF value of Indonesia,
in dollars, by its constant value – as a proxy for the investment delator. Both values are
from the World Bank’s World Development Indicators.
χ2 = 125.19, p < 0.00, respectively). The number of cross-sections under such
sub-sample is lower than the number of regressors, and so the random-effect model cannot be used, as shown in column 3 of table 4. The results in table 5 favour the
heterogeneous ixed-effect model relative to pooled OLS, as shown by the χ2
sta-tistics of the likelihood-ratio test therein (χ2 = 16.91, p < 0.08).
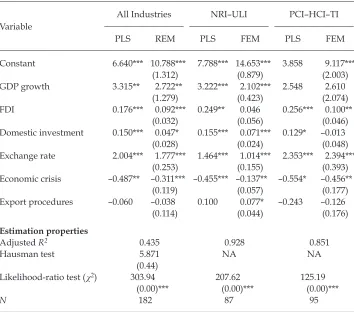
As shown in table 4, FDI expanded exports in two of our three observations.
The full sample shows a signiicant effect at the 1% signiicance level; its value of
0.092 implies that a 1.00% increase in FDI in the previous year is associated with a 0.09% expansion in manufacturing exports in the current year (and vice versa). The subsamples also show an increase in group-based PCI–HCI–TI exports at the
1% signiicance level; the magnitude scale of 0.10 indicates that a 1.00% increase
in FDI in the previous year is associated with a 0.10% expansion in the manufac-turing exports of PCI–HCI–TI commodities in the subsequent year. We found no
TABLE 4 Determinants of Indonesia’s Manufacturing Exports
Variable
All Industries NRI–ULI PCI–HCI–TI
PLS REM PLS FEM PLS FEM
Constant 6.640*** 10.788*** 7.788*** 14.653*** 3.858 9.117***
(1.312) (0.879) (2.003)
GDP growth 3.315** 2.722** 3.222*** 2.102*** 2.548 2.610
(1.279) (0.423) (2.074)
FDI 0.176*** 0.092*** 0.249** 0.046 0.256*** 0.100**
(0.032) (0.056) (0.046)
Domestic investment 0.150*** 0.047* 0.155*** 0.071*** 0.129* –0.013
(0.028) (0.024) (0.048)
Exchange rate 2.004*** 1.777*** 1.464*** 1.014*** 2.353*** 2.394***
(0.253) (0.155) (0.393)
Economic crisis –0.487** –0.311*** –0.455*** –0.137** –0.554* –0.456**
(0.119) (0.057) (0.177)
Export procedures –0.060 –0.038 0.100 0.077* –0.243 –0.126
(0.114) (0.044) (0.176)
Estimation properties
Adjusted R2 0.435 0.928 0.851
Hausman test 5.871 NA NA
(0.44)
Likelihood-ratio test ( χ2) 303.94 207.62 125.19
(0.00)*** (0.00)*** (0.00)***
N 182 87 95
Note: NRI = natural-resource intensive. ULI = unskilled-labour intensive. PCI = physical-capital inten -sive. HCI = human-capital inten-sive. TI = technology inten-sive. PLS, REM, and FEM denote pooled-least-squares method, random-effects method and ixed-effects method, respectively. FDI = foreign direct investment. LR = likelihood ratio. Dependent variable = exports. Numbers in parentheses are robust standard errors (corrected for heteroskedasticity).
* p < 0.1; ** p < 0.05; *** p < 0.01.
signiicant evidence of an FDI-led expansion of the manufacturing exports of the NRI–ULI group using the ixed-effect model, although the the pooled OLS model indicates a signiicant effect at the 5% level.
There are some plausible explanations for this evidence. First, it is possible
that Indonesia’s traditional comparative advantage in ULI industries is being
exhausted, while FDI targeting technologically complex industries may sug-gest that Indonesia is being used increasingly as an export platform for third-country markets. Rahmaddi and Ichihashi (2012), using constant-market-share
analysis and a revealed-comparative-advantage indicator, found that NRI–ULI
export commodities became less competitive as the group’s comparative advan-tage shrank during 1990–2008; manufacturing exports still grew, however, owing mostly to the increased competitiveness of PCI–HCI–TI export commodities.
Thee (2006) argued that certain industries within Indonesia’s NRI–ULI group –
textiles and garments, for example – have moved up the technology ladder since 1992. Meanwhile, the country’s domestic capabilities in absorbing and improv-ing on complex technologies have remained weak and narrow. As a result, any expansion in the manufacturing of technologically complex commodities is likely to rely on imported capital and technology.
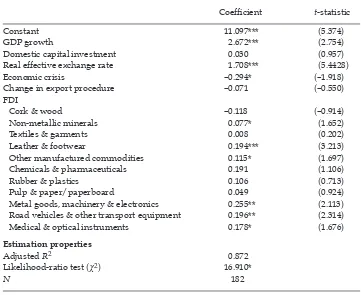
TABLE 5 Individual Effect of Foreign Direct Investment on Manufacturing Exports
Coeficient t-statistic
Constant 11.097*** (5.374)
GDP growth 2.672*** (2.754)
Domestic capital investment 0.030 (0.957)
Real effective exchange rate 1.708*** (5.4428)
Economic crisis –0.294* (–1.918)
Change in export procedure –0.071 (–0.550)
FDI
Cork & wood –0.118 (–0.914)
Non-metallic minerals 0.077* (1.652)
Textiles & garments 0.008 (0.202)
Leather & footwear 0.194*** (3.213)
Other manufactured commodities 0.115* (1.697)
Chemicals & pharmaceuticals 0.191 (1.106)
Rubber & plastics 0.106 (0.713)
Pulp & paper/paperboard 0.049 (0.924)
Metal goods, machinery & electronics 0.255** (2.113) Road vehicles & other transport equipment 0.196** (2.314)
Medical & optical instruments 0.178* (1.676)
Estimation properties
Adjusted R2 0.872
Likelihood-ratio test ( χ2) 16.910*
N 182
Note: FDI = foreign direct investment. Dependent variable = exports.
* p < 0.1; ** p < 0.05; *** p < 0.01.
Second, lower tariffs for products within the PCI–HCI–TI group (see igure
1) may have directed more FDI towards that group, eventually generating more exports. Ito (2010) and Ekholm, Forslid and Markusen (2007) argued that reduced
trade costs – such as declines in tariffs – induce irms to conduct export-platform
FDI. Third, low tariffs may have also facilitated greater imported capital-good
inlows to these industries. Okamoto and Sjöholm (2001) noted that the large
amounts of imported capital and intermediate goods may partially explain high labour productivity, which increases exports. Data from the OECD’s Structural Analysis (Input–Output) database indicate that manufacturing exports relying on medium-to-high or high levels of technology require more imported inputs, on average, than those relying on low levels of technology.13 During the mid-1990s and 2000s, for example, highly technological manufactured exports composed
36.5% of imported inputs, compared with 21.7% from those in the NRI–ULI group. Like the indings in table 4, the results of estimating equation (3), in table 5, provide evidence of FDI’s positive inluence on exports – at the 10% signiicance level, at least – for ive of the eleven industries; two of those industries (leather and footwear, and other manufacturing industries) are in the NRI–ULI group,
and three (road vehicles and other transport equipment, medical instruments and optics, and MME) are in the PCI–HCI–TI group. The greatest effect of FDI on exports (0.255) was on MME commodities, which suggests that MME exports
ben-eit most from FDI: a 1.00% increase in FDI will induce a 0.25% increase in MME
exports. The smallest effect (0.07%) was on non-metallic minerals (NMM). These
results point to the inluence of foreign investment on industrial development in
the above industries, through MNE-related global production network activities – particularly in the electronics industry. On average, the role of FDI in increas-ing manufacturincreas-ing exports was relatively greater for technologically complex, higher-value-added commodities from the PCI–HCI–TI group, compared with those from the leather and footwear, other manufacturing, and NMM industries
of the NRI–ULI group. This implies that FDI improves export performance both
in labour-intensive or low-technology industries and in technologically complex, higher-value-added industries, without providing any evidence of the exports of one industry group crowding out those of another.
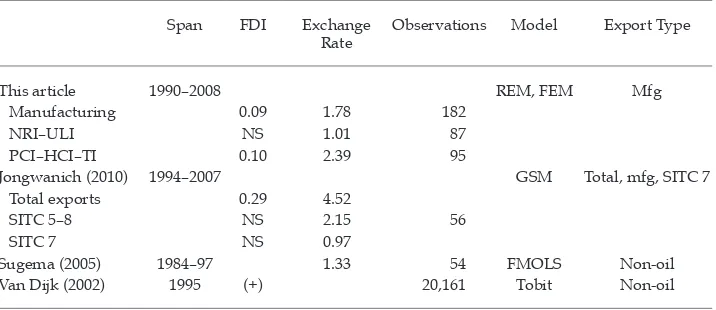
Our empirical evidence is consistent with the indings of Ramstetter (1999), Van Dijk (2002) and Jongwanich (2010). In the full sample, our indings support
arguments about the positive effect of foreign investment on a host country’s
exports. Among evidence derived from the subsamples, our inding that FDI increases exports from the PCI–HCI–TI group, relative to those from the NRI–ULI group, aligns with Jongwanich’s (2010) inding that FDI increases a host coun
-try’s exports of machinery and transport commodities signiicantly, and to a lesser
extent total merchandise and manufacturing commodities (SITC 5–8) exports. At
the industry level, our indings generally accord with those of Van Dijk (2002), who found signiicant evidence of FDI affecting the exports from most Indonesian manufacturing industries; they differ, however, from his indings on the leather
and footwear and medical-instrument industries. We also share Pangestu’s (2002) view on the importance of road vehicles and other transport equipment, and
13 See <http://stats.oecd.org/Index.aspx?DataSetCode=STAN_IO_TOT_DOM_IMP>.
MME commodities. Table 6 compares our indings with those of previous studies
on the importance of FDI on Indonesian exports.
Our indings also suggest that FDI plays a greater role in developing exports
among highly technological, higher-value-added industries than among
low-technology industries or those in the NRI–ULI group.14 This may in part explain the impressive growth of real exports among manufacturing commodities in
Indonesia’s PCI–HCI–ULI group during 1990–2008. Lall (2000) points out that
rapid and sustained manufactured export growth requires structural shifts from easy to complex products and processes within industry activities, and from easy to complex technologies across these activities. In this way, foreign investment may serve as both a ‘tutor’ and a catalyst in promoting technological upgrades by
transferring and diffusing technology. Overall, our empirical indings support the
argument that increased levels of FDI improve (that is, crowd in) the performance of manufacturing exports, especially in the highly technological, higher-value-added PCI–HCI–TI group. We found no direct evidence of FDI crowding-out
exports from the NRI–ULI group, in which Indonesia has a comparative advan -tage.
Domestic investment also affects the performance of overall manufactured
exports, at the 10% level of signiicance: the 0.047 magnitude (table 4) implies that
a 1.00% change in domestic investment will affect exports by 0.05%. Yet we found
statistically signiicant evidence, at the 1% signiicance level, of the inluence of domestic investment on exports, but only in the NRI–ULI group, in which the
scale magnitude of 0.071 suggests that a 1.00% change in domestic investment
would affect NRI–ULI exports by 0.07%. This implies that the expansion of such
low-technology exports in manufacturing – in contrast with those in the PCI– HCI–TI group – may in fact stem from any increase in domestic capital formation.
GDP growth was positive in all observations, as expected, and signiicant in most observations. We found evidence, at the 5% and 1% signiicance levels in the full sample and the NRI–ULI group, respectively, of the effect of GDP growth on export performance. (It is not statistically signiicant in the PCI–HCI–TI group.) It is also statistically different from zero at the 1% signiicance level in the hetero
-geneous ixed-effect model. Its high level of magnitude implies the importance
of Indonesia’s economic performance to the country’s production of exportable commodities: the value of 2.722 indicates that a 1.0% change in GDP growth would affect growth in manufacturing exports by 2.7%. High levels of eco-nomic growth suggest advancements in a country’s productive capacity through supply-side channels such as infrastructure, logistics, and production capabilities, all of which can be used to enhance export production. Any improvement in GDP growth would generate higher growth in manufacturing exports among NRI
and ULI commodities. GDP-growth coeficients are 2.102 for the NRI–ULI group and not statistically signiicant for the PCI–HCI–TI group, which shows that
14 This part, however, should be interpreted with caution, since export igures do not
perfectly measure an industry’s technological development. For instance, industrial
clas-siications based on levels of technological intensity may be misleading wherever
low-technology products can use relatively complex technological processes, or when
high-technology exports include low-value-added assembled products (Okamoto and Sjöholm 2001). Nevertheless, such export igures can still act as rough indicators of technological
competence (Thee 2006).
low-technology, NRI–ULI export commodities respond better to any improve -ment in production capacity than highly technological, higher-value-added ones. Following economic rationale, a depreciation in REER increases the
perfor-mance of manufacturing exports, at the 1% signiicance level in all observations.
Its value of 1.777 indicates that a 1.0% depreciation in the rupiah will facilitate a 1.8% growth in manufacturing exports overall, implying that any depreciation (appreciation) will induce an increase (decrease) in manufacturing exports, above a level that would be considered proportionate. The REER effect on exports also
exhibits industry-based differences across the two industry groupings; its igures
of 1.014 and 2.394 suggest that a 1.0% change would affect manufacturing exports
by 1.0% for NRI–ULI products and by 2.4% for PCI–HCI–TI products. Our ind -ings suggest that more highly technological products tend to be more susceptible to exchange-rate changes; this seems reasonable in the case of Indonesia, since the PCI–HCI–TI industry group is still lower on the technology ladder than the
NRI–ULI group, where Indonesia’s traditional comparative advantage lies. Thee
(2006) argued that the technological capabilities of high-technology industries in Indonesia are still weak. In addition, export products of these industries, as
dis-cussed, are more import-content-intensive than those in the NRI–ULI group. All
of these factors make high-technology manufactured exports more responsive to
any exchange-rate luctuations. Our overall indings are comparable with those of Jongwanich (2010) and Sugema (2005). Table 6 compares our indings with those
of previous studies of exchange-rate and FDI elasticity.
Tables 4 and 5 also provide evidence of the negative effect of an economic crisis. The export commodities of the PCI–HCI–TI group, in particular, are more
vulner-able to any economic shock than those of the NRI–ULI group; technologically
complex, higher-value-added commodities need a high proportion of imported
TABLE 6 Estimated Elasticities of Foreign Direct Investment and the Exchange Rate of Indonesia’s Exports
Span FDI Exchange Rate
Observations Model Export Type
This article 1990–2008 REM, FEM Mfg
Manufacturing 0.09 1.78 182
NRI–ULI NS 1.01 87
PCI–HCI–TI 0.10 2.39 95
Jongwanich (2010) 1994–2007 GSM Total, mfg, SITC 7
Total exports 0.29 4.52
SITC 5–8 NS 2.15 56
SITC 7 NS 0.97
Sugema (2005) 1984–97 1.33 54 FMOLS Non-oil
Van Dijk (2002) 1995 (+) 20,161 Tobit Non-oil
Note: FDI = foreign direct investment. Mfg = manufacturing. NRI = natural-resource intensive. ULI = unskilled-labour intensive. PCI = physical-capital intensive. HCI = human-capital intensive. TI = technology intensive. SITC = standard international trade speciication. NS = not signiicant. GSM = general to speciic model. FMOLS = fully modiied ordinary least squares. Coeficients of Jongwanich (2010) above are for long-run estimates. In the short run, Jongwanich found that the positive effect of FDI on exports is signiicant for all export types, yet it tends to be greatest on SITC 7 exports (0.06), compared with total merchandise exports (0.03) and manufacturing SITC 5–8 exports (0.02).
inputs, and are therefore inclined to be more responsive to movements in the
exchange rate. Finally, our results do not provide statistically signiicant evidence (except for the NRI–ULI group, at the 10% signiicance level) of the importance of changes in export procedures in inluencing the performance of manufacturing
exports, indicating that such changes have a very limited effect on export expan-sion.
Policy implications
This article’s empirical indings bear some policy implications. First, the impor -tance of export determinants other than FDI – namely, domestic investment, the growth of economic performance, and the exchange rate – suggests that the Indo-nesian government should maintain a sound domestic supply and adopt com-petitive practices in managing the exchange rate (such as stabilising currency
volatility and curbing domestic inlation) in order to sustain growth in manufac -turing exports. Increases in domestic capital formation, in particular, are essential
in promoting commodity exports from the NRI–ULI group. Second, since FDI
increases exports yet varies in effect across different industries, focused measures to promote FDI and targeted, industry-based policies are worth pursuing.
Third, FDI’s high level of inluence on technologically complex,
higher-value-added industries suggests that it may shape changes in Indonesia’s export struc-ture, from natural-resource and low-technology commodities to technologically
complex, higher-value-added ones. Lall (2000) asserts that such a structural shift
is considered essential to maintaining sustained growth in manufacturing exports. We therefore propose an impetus for the government, to direct FDI more read-ily to such industry groups and to undertake further development in that vein. We do not dismiss the importance of FDI in, and the export commodities of, the
NRI–ULI group in Indonesia’s present state of development, but, considering the
country’s current level of industrial capabilities, the expansion of technologically complex, higher-value-added manufacturing exports would be more responsive to any increase in targeted FDI. This of course assumes that structural changes in manufacturing exports and the expansion of technologically complex, higher-value-added commodities can be facilitated by packaging capital, management skills and new technology fostered by targeted foreign investment, as Thee (2006) has argued. Any such measures to promote FDI should be accompanied by sup-plementary efforts, such as providing excellent research and development (R&D) and physical public infrastructure, eliminating unnecessary trade costs and
deliv-ering an eficient logistics system.
Fourth, developing Indonesia’s technologically complex, higher-value-added industries will also increase the diversity of its manufactured goods, and ulti-mately support rapid and sustained export growth – especially given that indus-trial development in certain industries in which Indonesia has traditionally held a comparative advantage (like the textiles and garments industry) has already been largely exploited, so these commodities are facing severe competition from other low-labour-cost economies in Asia. Fifth, the government can deliver an
incen-tive system for irms, to prompt them to upgrade their technological capabilities,
and to develop higher-quality education, training and R&D infrastructure – espe-cially in human-capital-based technologies (that is, in industries in which FDI has the greatest effect on exports) – to transfer and diffuse technology from MNEs to
the export-oriented industries comprising indigenous irms. Such transfers and