National Park Service
U.S. Department of the Interior
Natural Resource Stewardship and Science
Designing and Scoping Climate Change Vulnerability
Assessments for Coastal National Parks in the
Northeast Region
Guidance and Lessons Learned
ON THE COVER
Photograph of damaged walkway at the Assateague National Seashore.
Designing and Scoping Climate Change Vulnerability
Assessments for Coastal National Parks in the
Northeast Region
Guidance and Lessons Learned
Natural Resource Report NPS/NER/NRR—2017/1426
Glenn Ricci1, Donald D. Robadue, Jr.1, and Amanda L. Babson2
1
Coastal Resources Center
Graduate School of Oceanography University of Rhode Island
Narragansett, RI 02882
2
National Park Service Northeast Region
University of Rhode Island Narragansett, RI 02882
April 2017
U.S. Department of the Interior National Park Service
The National Park Service, Natural Resource Stewardship and Science office in Fort Collins, Colorado, publishes a range of reports that address natural resource topics. These reports are of interest and applicability to a broad audience in the National Park Service and others in natural resource management, including scientists, conservation and environmental constituencies, and the public.
The Natural Resource Report Series is used to disseminate comprehensive information and analysis about natural resources and related topics concerning lands managed by the National Park Service. The series supports the advancement of science, informed decision-making, and the achievement of the National Park Service mission. The series also provides a forum for presenting more lengthy results that may not be accepted by publications with page limitations.
All manuscripts in the series receive the appropriate level of peer review to ensure that the information is scientifically credible, technically accurate, appropriately written for the intended audience, and designed and published in a professional manner.
This report received formal peer review by subject-matter experts who were not directly involved in the collection, analysis, or reporting of the data, and whose background and expertise put them on par technically and scientifically with the authors of the information.
Views, statements, findings, conclusions, recommendations, and data in this report do not necessarily reflect views and policies of the National Park Service, U.S. Department of the Interior. Mention of trade names or commercial products does not constitute endorsement or recommendation for use by the U.S. Government.
This report is available in digital format fromthe Natural Resource Publications Management. To receive this report in a format optimized for screen readers, please email [email protected].
Please cite this publication as:
Ricci, G., D. Robadue, Jr., and A. L. Babson. 2017. Designing and scoping climate change vulnerability assessments for coastal national parks in the northeast region: Guidance and lessons learned. Natural Resource Report NPS/NER/NRR—2017/1426. National Park Service, Fort Collins, Colorado.
NPS 962/137989, April 2017
iii
Contents
Page
Figures... v
Tables ... vii
Appendices ... ix
Executive Summary ... xi
Acknowledgments ...xiii
Introduction ... 1
Key messages in this guide... 1
Climate Change and Vulnerability ... 5
Climate Change Summary for the Northeast Region ... 5
Distinctive Climate Change and Adaptation Characteristics of the Northeast Region ... 6
Vulnerability Frameworks and Concepts ... 7
Basic conceptual framework ... 7
What vulnerability assessments can contribute ... 8
Timing is Critical ... 8
NPS Description of a Robust Vulnerability Analysis for Natural Resources ... 8
Putting Vulnerability Assessments and Scenario Planning into Context: They each have their place ... 9
Sources of general guidance ... 9
The usefulness of scenarios ... 10
Adaptive Capacity Frameworks ... 13
Challenges of Modeling Fundamental and Realized Adaptive Capacity of Species ... 14
Recent Vulnerability Assessments and Follow up Actions for Natural Resources, Cultural and Infrastructure Assets in NPS NER Parks ... 16
Designing a Vulnerability Assessment Process ... 19
Steps, Paths and Examples for Conducting a Vulnerability Assessment ... 21
A. Determining objectives and scope of a vulnerability assessment ... 21
B. Gathering Relevant Data and Expertise ... 31
iv
Contents (continued)
Page
D. Applying the results of a vulnerability assessment to park management ... 50
Lessons Learned ... 55
v
Figures
Page
Figure 1. Map of coastal NPS sites in the NER. ... 2
Figure 2. Report: 2014: Climate Change Impacts in the United States: The Third
National Climate Assessment. (Melillo et al. 2014) http://www.globalchange.gov/. ... 5
Figure 3. Basic concepts comprising a vulnerability assessment. Figure from Glick et al.
(2011). ... 7
Figure 4. Report: Using Scenarios to Explore Climate Change: A Handbook for Practitioners (NPS 2013a).
http://www.nps.gov/subjects/climatechange/upload/CCScenariosHandbookJuly2013.pdf ... 11
Figure 5. Report: Using Scenarios to Explore Climate Change: A Handbook for
Practitioners. (National Park Service, 2013) ... 12
Figure 6. Report: Considering Multiple Futures: Scenario Planning to Address
Uncertainty in Natural Resource Conservation (Rowland et al. 2014) ... 12
Figure 7. An integrated perspective on incorporating species realized adaptive capacity
in vulnerability assessment. Figure adapted from Williams et al. (2008). ... 15
Figure 8. Key steps for assessing vulnerability to climate change. ... 20
Figure 9. Climate-Smart conservation cycle. Figure adapted from Stein et al. (2014). ... 20
Figure 10. Report: Refuge Vulnerability Assessment and Alternatives Guide (Christ et
al. 2012a) ... 22
Figure 11. Report: Scanning the Conservation Horizon. (Glick et al. 2011) ... 22
Figure 12. Report: Badlands National Park Climate Change Vulnerability Assessment.
(Amberg et al. 2012) ... 23
Figure 13. Report: Climate-Smart Conservation: Putting Adaptation Principles into
Practice ... 24
Figure 14. Report: Adapting to Climate Change: A Planning Guide for State Coastal
Managers (NOAA 2010). ... 26
Figure 15. Report: Planning for Climate Change on the National Wildlife Refuge System
(Czech et al. 2014). ... 26
Figure 16. Report: Integrating Climate Change into Northeast and Midwest State
Wildlife Action Plans (Staudinger et al. 2015) ... 27
Figure 17. Report: NPS Climate Change Response Strategy (NPS 2010) ... 29
Figure 18. Report: NPS Climate Change Action Plan (NPS 2012b) ... 30
Figure 19. Report: Northeast Region Climate Change Strategy and Action Plan (NPS
vi
Figures (continued)
Page
Figure 20. Climate change in Northeast Region coastal parks (Roman and Babson 2013) ... 31
Figure 21. The Conservation Planning Atlas compiles data layers developed by the North Atlantic Landscape Conservation Cooperative that can be used for vulnerability assessments. ... 32
Figure 22. NPS Climate Change Response Reports. ... 33
Figure 23. Climate Change Summary Report, Colonial National Historical Park, Virginia. ... 33
Figure 24. Resource: Online climate database for the Northeast. http://NEclimateUS.org ... 38
Figure 25. Report: Toolbox of Methods with Case Studies (Johnson, 2014) ... 39
Figure 26. Report: Marine Vulnerability Assessment of Cumberland Island National Seashore (Peek et al. 2016) ... 42
Figure 27. Report: Climate Ready Estuaries Vulnerability Assessment (US EPA 2012). ... 43
Figure 28. Report: NPS Beach Nourishment Guidance (Dallas et al. 2012). ... 43
Figure 29. Report: Fish Stock Climate Vulnerability (Morrison et al. 2015). ... 44
Figure 30. Report: Marshes on the Move (The Nature Conservancy and NOAA 2011). ... 45
Figure 31. Report: Make Way for Marshes (Northeast Regional Ocean Council 2015). ... 45
Figure 32. Resource: Coastal Vulnerability Index. ... 46
Figure 33. Report: Preserving Coastal Heritage (NPS 2014c) ... 47
Figure 34. Report: Adapting to Climate Change in Coastal Parks (Peek et al. 2015). ... 48
Figure 35. Report: Facilities Adaptation to Climate Change (ICF International 2012). ... 49
Figure 36. Resource: Climate Adaptation Knowledge Exchange. ... 52
Figure 37. Resource: Climate Registry for the Assessment of Vulnerability. ... 52
Figure 38. Resource: National Conservation Training Center. ... 53
vii
Tables
Page
Table 1. Putting Vulnerability Assessments and Scenario Planning into Context: They
each have their place. ... 9
Table 2. Determinants of adaptive capacity. Table from Smit et al. (2001). ... 13
Table 3. Factors influencing species vulnerability. Table adapted by Czech et al. (2014)
ix
Appendices
Page
Appendix A. Vulnerability assessments in the Northeast Region ... 65
Appendix B. Vulnerability Assessments in NPS Adaptation Case Studies (Schupp et al.
xi
Executive Summary
To plan for climate change adaptation, park resource managers need scientific information identifying the susceptibility of resources to climate change, when impacts are expected and how they are expected to interact with existing stressors. Climate change vulnerability assessments are a priority for many parks to support adaptation planning, but there is a need for park specific guidance on scoping, implementing and using vulnerability assessments. Several frameworks and resources are available focusing on coastal communities and on natural resources. This document summarizes some of these and draws lessons from assessments already completed or underway in parks in the Northeast. The National Park Service (NPS) has initiated a range of climate change research and monitoring actions that address park vulnerability assessment needs. This guide provides additional materials to assist coastal parks in the Northeast Region (NER) to move forward with their
xiii
Acknowledgments
1
Introduction
The National Park Service (NPS) continues to show progressive leadership in addressing climate change. This is a particularly challenging task because of the diversity of resources, missions and goals that need to be addressed by individual parks. Before wise climate adaptation can take place, detailed understanding of how systems are vulnerable to climate change is important. Due to the high level of uncertainty and complexity of projecting the future, assessing vulnerability is a challenging yet vital task for effectively managing NPS sites. The purpose of a vulnerability assessment (VA) is to identify resources that are most likely to be impacted by climate change and understand why and how. Vulnerability is the degree to which a system is susceptible to, and unable to cope with, adverse effects of climate change, including climate variability and extremes. The material that follows draws from the extensive methods and general frameworks that are already available for vulnerability assessments.
Key messages in this guide
• Use the intended application of the assessment to guide design elements of the VA. Only collect the information and level of detail necessary for management to move forward. • Determine the relative emphasis of conservation, cultural and infrastructure concerns, mixing
approaches from the most relevant and feasible methods.
• Partner with neighboring communities to reduce costs, coordinate analysis and work at larger coastal landscapes.
• Focus on assessing the habitats, ecological systems and geophysical settings to see the big picture.
• Allow for climate uncertainty.
The aim of this document is to provide specific guidance for the managers of coastal parks in the Northeast Region (NER) on how to make the best use of available expertise, time and opportunities to design, conduct and interpret vulnerability assessments targeted for the attributes and management needs of parks. The NER coastal parks are shown in Figure 1. This document also shares some lessons learned from the growing number of climate change vulnerability assessments already underway or completed in NER parks.
NPS has initiated a range of climate change research and monitoring actions that address Park needs. This includes a national NPS Climate Change Response Strategy and Action Plan, a Northeast Region Strategy and Action Plan, a climate change monitoring strategy has been developed by the Inventory and Monitoring (I&M) Networks in the northeast (Northeast Coastal and Barrier Network and Northeast Temperate Network) (Stevens et al. 2010). These and other reports (Roman and Babson, 2013; Babson 2014) all call for vulnerability assessments to support adaptation. This guide provides additional materials to assist coastal parks in the NER to move forward with their
2
3
The guide primarily uses frameworks and examples developed for natural resources, with cultural resources and facilities examples provided as available. It draws extensively on the approach set out in great detail in Scanning the Conservation Horizon (Glick et al. 2011) which in turn is based upon the general framework of the Intergovernmental Panel on Climate Change (IPCC) “in which
5
Climate Change and Vulnerability
Climate Change Summary for the Northeast Region
The US National Climate Assessment summarizes the impacts of climate change on the US, broken down by region and sectors (Figure 2). The Northeast chapter provides a summary of the climate trends for the Northeast (Horton et al. 2014) as well as guidance on vulnerabilities that should be considered.
Figure 1. Report: 2014: Climate Change Impacts in the United States: The Third National Climate Assessment. (Melillo et al. 2014) http://www.globalchange.gov/.
For many parks, a VA will move from higher level regional vulnerability information to locally specific trends and projections, as specific to park resources. Key points include:
• Coastal ecosystems are particularly vulnerable to climate change because many have already been dramatically altered by human stresses; climate change will result in further reduction or loss of the services that these ecosystems provide, including potentially irreversible impacts.
• Heat waves, coastal flooding, and river flooding will pose a growing challenge to the region’s environmental, social, and economic systems.
• Infrastructure will be increasingly compromised by climate-related hazards, including sea level rise, coastal flooding, and intense precipitation events.
• Fisheries and ecosystems will be increasingly compromised over the next century by climate change impacts. Adaptive capacity, which varies throughout the region, could be
6
• The Northeast’s coastal ecosystems and the species that inhabit them are highly vulnerable to rising seas. Beach and dune erosion, both a cause and effect of coastal flooding, is also a major issue in the Northeast. Impervious surfaces and coastal barriers such as seawalls limit the ability of marshes to migrate inland as sea levels rise.
• As sea levels rise, the Chesapeake Bay region is expected to experience an increase in coastal flooding and drowning of estuarine wetlands. The lower Chesapeake Bay is especially at risk due to high rates of sinking land (known as subsidence). Climate change and sea level rise are also likely to cause a number of ecological impacts, including declining water quality and clarity, increases in harmful algae and low oxygen (hypoxia) events, decreases in a number of species including eelgrass and seagrass beds, and changing interactions among trophic levels (positions in the food chain) leading to an increase in subtropical fish and shellfish species in the bay.
Distinctive Climate Change and Adaptation Characteristics of the Northeast Region
When conducting vulnerability assessments for the NER, incorporate the following distinctive characteristics to tailor the analysis to local conditions. This can result in greater clarity of potential impacts and increased acceptance by stakeholders:
• Urban density and surroundings: The NER is one of the most populated regions of the country with significant infrastructure in the coastal zone. Density increases the number of stakeholders surrounding Parks and the economic pressures to encroach upon park areas and associated ecosystem services. Urban areas also offer more partners to link assessments with to share resources and integrate analyses.
• Cultural Resources: The NER has over 5000 historic structures across 80 sites. Many of the Parks in this region are focused on cultural resources which have different vulnerabilities and adaptation limitations (Morgan et al. 2016).
• Tidal ranges: When considering sea level rise (SLR) and storm surges, recognize the influence of tidal range on elevation capital; some NER parks have large tidal ranges while others are micro-tidal which can present its own adaptation challenges.
• Rapidly subsiding coast: Adding to the accelerated SLR rates, the long-term land subsidence for much of the mid-Atlantic raises the immediacy of the risks.
• Unique endangered and protected species: General methods and assessments should be tailored to the unique species that are endangered and protected. Climate vulnerability of threatened species may prioritize funding allocation or scope of assessments.
• Mix of ecological zones (Mid-Atlantic and Cold Northern species ranges overlap): The NER encompasses two ecological zones which have a greater overlap in the ranges of many species, adding to the complexity of assessments.
7
working with natural processes and engineering efforts intended to protect historic structures, recreational access or adjacent landowner’s infrastructure.
• Generally supportive public that understands climate change and need for action: Based on recent national surveys (Howe et al. 2015), the NER has an educated and supportive citizenry open to using the latest climate science and taking action. When difficult adaptation decisions need to be made, specific stakeholders may question the science supporting actions impacting their interests, increasing the demand for high quality vulnerability assessments.
Vulnerability Frameworks and Concepts
Basic conceptual framework
The basic conceptual framework that serves to unify the approaches taken to vulnerability
assessments (Figure 3) is detailed for natural resources in Scanning the Conservation Horizon (Glick et al. 2011). However the diagram in Figure 3 and the reasoning behind it is applicable to cultural resources and facilities and is found in a wide range of climate change vulnerability assessments for coastal and inland areas. Climate changes, such as sea level rise, changes in temperature,
precipitation and extreme storm patterns, along with ocean acidification, will exacerbate existing hazards. This will potentially cause impacts to the extent that resources, such as beaches, wetlands, habitats, park facilities, and cultural resources are sensitive to those effects. How well nature and humans can adapt to the new conditions will determine overall vulnerability.
8
This basic exposition of vulnerability is very broad and covers all scales and types of resources. In contrast, much of the guidance developed to date to assist the NPS places greatest emphasis on natural resources and systems.
What vulnerability assessments can contribute
Outputs of vulnerability assessments can then be used in decision-making processes, which often apply risk management frameworks that assign values of likelihood and consequences. Vulnerability assessments are helpful in situations where uncertainty is high resulting in the inability to assign accurate risks.
Timing is Critical
The primary purpose of conducting a vulnerability assessment is to inform management actions. The timing of assessments can be critical to their use and application in park planning and decision making. NPS has several planning products that can be informed by timely assessments. Assateague Island National Seashore (ASIS) conducted a scenario planning workshop as an initial phase in the process of updating its General Management Plan. This provided an exceptional opportunity for park staff, planners and contractors to become more knowledgeable about existing data as well as current resource conditions and trends. This greater understanding provided a strong foundation for
developing practical alternatives for future management of the barrier island.
NPS Description of a Robust Vulnerability Analysis for Natural Resources
• Vulnerability to climate change is the degree to which a system is susceptible to and unable to cope with adverse effects. Gonzalez (2011) sets out a clear definition of design features to include in a robust NPS vulnerability analysis: Examination of all three components of vulnerability: exposure, sensitivity, and adaptive capacity.
o Exposure is the extent of climate change experienced by a species or ecosystem: for example, degrees of annual temperature change per century.
o Sensitivity is the change in a species or ecological variable for each increment of change in climate: for example, increased tree mortality of 5% per degree of average temperature increase.
o Adaptive capacity is the ability of a species or ecosystem to adjust: for example, increased germination to compensate for the increased tree mortality.
• Detection and attribution of historical changes.
• Analyses of observed and projected data. Because of time lags between the emission of greenhouse gases, the expression of changes in climate, and ecological responses,
vulnerability is a function of historical and future climate changes.
• Quantification of uncertainties. Computer model errors, future emissions scenario
9
• Identification of vulnerable areas and potential refugia. Spatial analyses that map patterns of vulnerability will identify the locations of the most vulnerable areas and potential refugia. This provides the scientific data needed to prioritize areas for adaptation.
Putting Vulnerability Assessments and Scenario Planning into Context: They each have their place
Scenario planning and vulnerability assessments are both important tools for adaptation planning and can be similar in that they attempt to understand the future under uncertain conditions. Each has their strengths and roles (Table 1). This document focuses on vulnerability assessments, recognizing that the outputs from such assessments can then be incorporated into scenario planning exercises or that scenario planning may identify the scope of a needed vulnerability assessment.
Table 1. Putting Vulnerability Assessments and Scenario Planning into Context: They each have their
place.
Feature Scenario Planning Vulnerability Assessment
Purpose
Identify actions that will be most effective across a range of potential futures or that promote desired outcomes.
Identify which resources are impacted by climate change and why
Process Start with plausible future states, then determine how management could respond
Start with current trends and projections for key resources, then understand the possible impact to resources
Output Detailed stories of future states and how management could respond
Vulnerability of resources under specific projections and within a selected timeframe
Inputs
Driving forces and potential impacts (including vulnerability assessment data if available), projections, current management context
Exposure projections, sensitivity attributes of resources and adaptive capacities
Sources of general guidance
Guidance from Intergovernmental Panel for Climate Change
10 Guidance from Scanning the Conservation Horizon
Scanning the Conservation Horizon (Glick et al. 2011) sets out an assessment approach that retains an emphasis on species and habitats, including how to address the uncertainty that tempers the confidence that users of a vulnerability assessment will have in its information, projections and recommendations. A vulnerability assessment offers latitude in the scope, goals and objectives, assessment targets, and methods used. The Designing a vulnerability assessment section sets out the authors’ assessment road map in a step by step fashion. They also recommend considering an iterative, adaptive management approach to “maximize the likelihood of an acceptable outcome”. A monitoring plan is important in this approach to determine the interplay of climate and non-climate stressors, as well as to critically assess the effectiveness of adaptation actions.
Guidance from NPS Documents
The NPS approach to vulnerability assessment acknowledges the challenges of uncertainty and offers creative methods for incorporating climate change, impact uncertainty and socio-economic
dimensions. The NPS Director’s policy memorandum (PM) 12-02, “Applying National Park Service Management Policies in the Context of Climate Change” points out that “widespread, cascading effects from climate change challenge park managers even a few decades ago” (NPS 2012a).
The NPS has produced several model vulnerability assessments, including a marine habitats
methodology for Cumberland Island National Seashore (CUIS) (Peek et al. 2016). More information on this method is available later in this guide.
One frequently mentioned recommendation is that it may be time to update site goals. Environments are continually changing. Forward looking NP sites continually review their goals and objectives to ensure they are in line with environmental and climate shifts. ASIS used the outputs of their scenario planning workshop and other SLR data to recognize the reality that visitor facilities and other
seashore infrastructure needed to be more sustainable and resilient in the face of future environmental conditions. The NPS and Glick et al. (2011) both encourage sites to adapt their management goals based on likely future climate conditions.
The usefulness of scenarios
11
Figure 4. Report: Using Scenarios to Explore Climate Change: A Handbook for Practitioners (NPS
2013a). http://www.nps.gov/subjects/climatechange/upload/CCScenariosHandbookJuly2013.pdf
Acknowledging the importance of a science-based vulnerability process, nonetheless, “What models cannot do, is reveal exactly when, where, or how these impacts will occur, nor can they predict how extreme events might interact with complex natural systems to cause dramatic changes on a
landscape” (NPS 2013a). An additional benefit of the ideas in the Using Scenarios to Explore Climate Change handbook (Figure 5) is the broader scope it encourages in the assessment process.
Park managers are finding scenario planning as a valuable way to introduce more appropriate time frames for both conservation and facilities vulnerability.
Considering Multiple Futures: Scenario Planning to Address Uncertainty in Natural Resource
Conservation presents a broad synthesis of scenario planning concepts and approaches, including the NPS scenario planning process (Figure 6) (Rowland et al. 2014). It is particularly valuable for those interested in understanding the theory behind different scenario planning approaches and gaining access to additional literature and examples.
12 vulnerability information:
http://www.nps.gov/subjects/climatechange/adaptationforculturalresources.htm.
Figure 5. Report: Using Scenarios to Explore Climate Change: A Handbook for Practitioners. (National
Park Service, 2013).
http://www.nps.gov/subjects/climatechange/upload/CCScenariosHandbookJuly2013.pdf
Figure 6. Report: Considering Multiple Futures: Scenario Planning to Address Uncertainty in Natural Resource Conservation (Rowland et al. 2014).
13
Cultural resources adaptation guidance has been provided via a PM 14-02 “Climate Change and Stewardship of Cultural Resources” (NPS 2014a) and in the report from the meeting “Preserving Coastal Heritage” held in New York (NPS 2014c).
Adaptive Capacity Frameworks
Perhaps the part of vulnerability that contains the most uncertainty is calculating the adaptive capacity of a system. Adaptive capacity is a relatively new concept with many different
interpretations on what it is and how to measure it across ecological and social dimensions. Two frameworks are presented below to highlight ecological and social examples of how to assess adaptive capacity. The IPCC presented a social framework (Smit et al. 2001) that identified six determinants of adaptive capacity in the context of climate change (Table 2). This captures most of the concepts shared by other researchers.
In relation to NPS site assessments, the adaptive capacity is primarily focused on the NPS’s internal organizational capacity to adapt, though other stakeholders neighboring the sites certainly should be considered. In the case of ASIS’s assessment of facilities, they used current replacement values as an indicator of capacity to adapt (discussed later in the document, ICF International 2012). While this is a limited interpretation of the concept of adaptive capacity, it does start to incorporate social and institutional dimensions using fixed values.
From an ecological perspective there are several frameworks that recognize the inherent adaptive capacity of nature and organisms. The greater challenge is determining the hidden adaptive capacity when under great stress beyond the normal range of conditions.
Table 2. Determinants of adaptive capacity. Table from Smit et al. (2001).
Determinant Rationale
Economic resources Greater economic resources increase adaptive capacity Lack of financial resources limits adaptation options
Technology
Lack of technology limits range of potential adaptation options
Less technologically advanced regions are less likely to develop and/or implement technological adaptations
Information and skills Lack of informed, skilled and trained personnel reduces adaptive capacity
Greater access to information increases likelihood of timely and appropriate adaptation
Infrastructure
Greater variety of infrastructure can enhance adaptive capacity, since it provides more options
Characteristics and location of infrastructure also affect adaptive capacity
Institutions
Well-developed social institutions help to reduce impacts of climate related risks and therefore increase adaptive capacity
Policies and regulations may constrain or enhance adaptive capacity
14
Consider exploring NPS Museum Collections. Primary data collection on localized climate history can be expensive and complicated. Acadia National Park (ACAD) realized that their Historical Museum records contained a wealth of natural history information related to species distribution and phenology. Seek out NPS museums and other local collections to take advantage of historical data on trends in climate, sea level and responses to past extreme events.
The CUIS marine assessment measured adaptive capacity from a purely ecological dimension – such as salinity and pH ranges and growth rates. While the ecological dimension certainly is a major factor, for many coastal habitats, specifically those near human settlements, there are also socio-economic factors at play to influence adaptive capacity influencing management decisions. These include controlling tidal flushing volumes and beach replenishment.
Challenges of Modeling Fundamental and Realized Adaptive Capacity of Species
The USFWS notes that the ability of species within the national system of refuges to adapt to the unprecedented rate and magnitude of climate changes being experienced in the 21st century, such as
precipitation and temperature, may not be sufficient to keep pace. This includes the concern that “disruptions to the synchrony among species could cause cascading ecosystem effects, affecting reproduction, mortality and distributions of species” (Table 3).
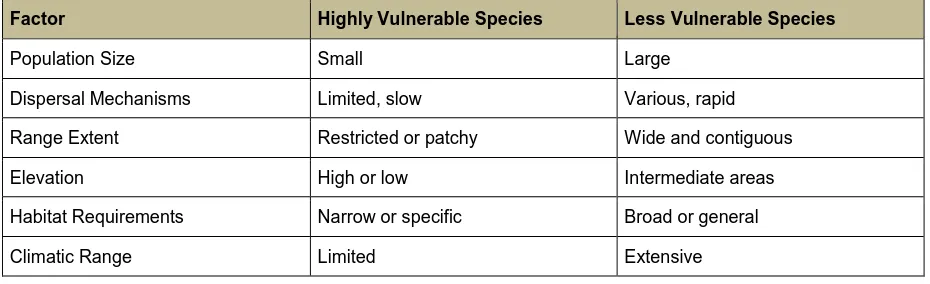
An important dimension of vulnerability assessment at the species level is incorporating the adaptive capacity of individual key species that are the focus of biodiversity conservation efforts in view of the challenge of global climate change. Beever et al. (2015) set out a broad conceptual framework. The authors “call for an inter-disciplinary synthesis and research effort to: A) develop a consensus for how adaptive capacity is defined and applied in resource management decisions; and B) draw from disparate fields such as genetics, ecology, and conservation biology, and synthesize what is known about species’ adaptive capacity using consistent terminology.”
Table 3. Factors influencing species vulnerability. Table adapted by Czech et al. (2014) from Gitay et al.
(2002).
Factor Highly Vulnerable Species Less Vulnerable Species
Population Size Small Large
Dispersal Mechanisms Limited, slow Various, rapid
Range Extent Restricted or patchy Wide and contiguous
Elevation High or low Intermediate areas
Habitat Requirements Narrow or specific Broad or general
Climatic Range Limited Extensive
15
or pollution, and competition among species (Table 3). Management interventions are possible to aid in enhancing realized adaptive capacity of a species, though the complexity and uncertainty is substantial.
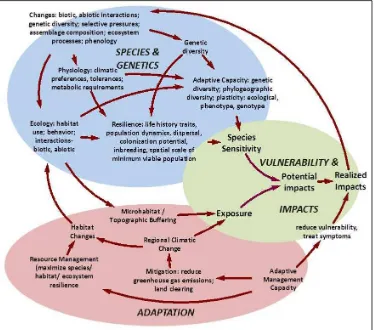
A similar analysis of the challenges of assessing adaptive capacity at the species and ecosystem levels (Figure 7) was presented by Williams et al. (2008), in which they concluded that:
What is needed is a complete working framework for assessing the vulnerability of species that explicitly links: the various components of biotic vulnerability; the regional and local factors determining exposure to climatic change; the potential for both evolutionary and ecological responses, resilience, and active management to mediate the final realized impacts; and the potential for feedback effects. Such a framework would be invaluable as it would integrate and guide thought, research programs, and policy in the biodiversity/climate change arena and allow significant gaps in knowledge to be clearly identified.
Figure 7. An integrated perspective on incorporating species realized adaptive capacity in vulnerability
assessment. Figure adapted from Williams et al. (2008).
16
habitat factors causing vulnerability and leading to potential impacts, which management measures to address climate change, and to improvements to natural resources management can help reduce.
This formulation of the challenge of assessing species vulnerability views management interventions are possible to aid in enhancing realized adaptive capacity. However the scientific information requirements and complexity of designing and carrying out required management interventions likely lies out of reach for park-specific assessments.
Recent Vulnerability Assessments and Follow up Actions for Natural Resources, Cultural and Infrastructure Assets in NPS NER Parks
As of 2015, no singular exemplar has emerged of a coastal park climate change vulnerability
assessment covering all three facets of national park assets: natural, cultural and facilities.However, in the past decade, NER parks have collectively carried out a range of vulnerability assessment activities. These have made a significant contribution to good practices toward an overall approach that addresses the unique attributes of the region. Appendix A provides examples of elements of vulnerability assessment carried out in Northeast and Southeast Region parks, summarizing the vulnerability method used, the assets targeted, key vulnerabilities discovered and lessons learned, and finally actions taken, if any, as a result of the assessment. Appendix B highlights vulnerability
assessment included in an NPS coastal adaptation case studies report (Schupp et al. 2015).
A range of vulnerability assessment techniques are employed across the parks. A thorough assessment of marine resource vulnerabilities was done for Cumberland Island National Seashore (CUIS), which could be a good NER example even though it is located in the Southeast Region (Peek et al. 2016). The US Geological Survey (USGS) has prepared very helpful integrated visuals of its coastal vulnerability index for several national parks including Cape Cod National Seashore (CACO), Fire Island National Seashore (FIIS), Gateway National Recreation Area (GATE), and Assateague Island (ASIS). ASIS also has included vulnerability information in a scenario planning approach to adaptation, which was then incorporated into its General Management Plan update. Adaptation approaches for certain facilities have also been primary considerations of the purpose and need for removing and relocating two popular public parking areas that were damaged by Hurricane Sandy within the Seashore’s developed area.
Studies aimed at the vulnerability of salt marsh and coastal wetlands have been conducted in Acadia National Park (ACAD), CACO and FIIS. GATE’s recently adopted General Management Plan update incorporates climate change concerns by including priority banding of structures by
17
19
Designing a Vulnerability Assessment Process
The sampling of NPS experience provided in Appendices 1 and 2 illustrates that park managers in the NER in practice are using many different entry points for beginning to incorporate climate change concerns and adaptation strategies into planning and ongoing decision making. The
geographic scope, time horizon and likely impacts included in these examples vary considerably. To date, most guidance documents and examples tend to focus on natural resources in parks, however more recent information and experience is emerging on how to address facilities and cultural resources.
Recent NPS documents highlight and encourage staff to integrate their vulnerability assessments (VAs) across themes and resources. PM 12-02 on climate change (NPS 2012a), and the NPS Vulnerability Assessment Brief (NPS 2013b) highlight the multi-faceted nature of park manager responsibilities that intersect with the need for vulnerability assessments. This includes conserving natural systems, protecting historic heritage, determining the desired user experience for each park, changes in species associated with parks, concern for the integrity and potential loss or damage to cultural resources, park facilities, and the effect on park planning and management.
Assessing vulnerability to climate change can seem overwhelming in the degree of complexity and uncertainty. Several Parks overcome limited resources by doing smaller studies that over time help contribute to a larger systems analysis. For example, ACAD initially had USGS partners conduct a study constrained to only salt marsh inundation. Later additional studies on plant, trees and animal vulnerability were completed. These studies were integrated through a scenario planning workshop. The benefits of this approach include the ability to use small budget allotments to move forward, rather than waiting for a single large budget. By doing several small studies it also provides rich detailed data for when a larger climate assessment is conducted.
In broad terms, entry points for conducting a vulnerability assessment include: • Full stand-alone vulnerability assessment for all park resources and areas
• Smaller focused assessments of specific resource (e.g. habitats, species, collections) or specific impacts and issues of concern
• Incorporation of climate change vulnerability information into the Foundation Document,
General Management Plan update or other planning process (e.g. Resource Stewardship Strategy) as part of mainstreaming climate adaptation into planning processes.
20
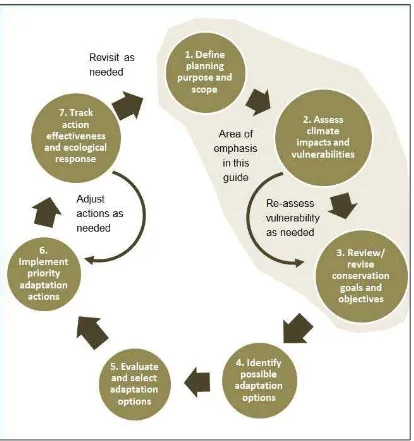
Figure 8. Key steps for assessing vulnerability to climate change.
This generalized framework for adaptation planning and implementation mirrors many existing conservation planning and adaptive management approaches and can be used either as a stand-alone planning process or to inform the incorporation of climate considerations into existing planning and decision making processes.
21
Steps, Paths and Examples for Conducting a Vulnerability Assessment
A. Determining objectives and scope of a vulnerability assessment
Key points of this section
There are many examples from National Park Service to help in determining the scope and objectives for a vulnerability assessment. Much of this includes ways to examine park goals and to broaden an assessment to address ecological and social dimensions. There is a considerable amount of National Park Service policy and guidance to help managers. Finally, park managers have found it valuable to link to regional climate strategies.
Determining objectives and scope
• Identify resource management question requiring climate change vulnerability insights
• Identify audience, user requirements, and needed products
• Engage key internal and external stakeholders
• Establish and agree on goals and objectives
• Identify suitable assessment targets
• Determine appropriate spatial and temporal scales
• Select assessment approach based on targets, user needs, and available resources
Paths to consider in view of park situation
• Conduct a park-wide VA. that includes a combination of ecological, cultural and facilities – financial and personnel resource intensive, benefits from regional landscape scale
partnerships, helps see the bigger picture
• Conduct a VA only for selected assets/ specific issues or a specific area or system within a park – this can be less resource intensive yet lacks the integration across systems.
Helpful Examples and Sources of guidance (see Methods and Tools/resources sections)
Refuge Vulnerability Assessment and Alternatives (RVAA) Technical Guide (Figure 10) provides step-by-step details for scientific and technical staff for conducting vulnerability assessments for
refuges and their supporting landscapes and to develop strategies and alternatives for management in the face of current and future drivers of change (Christ et al. 2012a). Similarly the Manager’s Guide to Refuge Vulnerability Assessment and Alternatives: Overview and Practical Considerations (Christ et al. 2012b) is designed for managers who coordinate and conduct actual assessments. Both cover widely used conservation planning and management concepts and approaches such as vulnerability
22
Figure 10. Report: Refuge Vulnerability Assessment and Alternatives Guide (Christ et al. 2012a).
http://www.natureserve.org/biodiversity-science/publications/refuge-vulnerability-assessment-and-alternatives-technical-guide
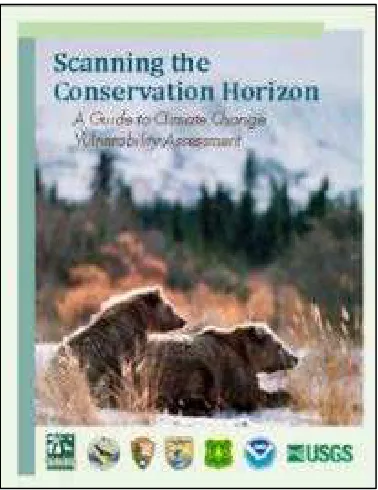
Scanning the Conservation Horizon (Glick et al. 2011) is designed to assist natural resource
managers and other conservation resource professionals to better plan, execute and interpret climate change vulnerability assessments (Figure 11).
Figure 11. Report: Scanning the Conservation Horizon. (Glick et al. 2011).
23
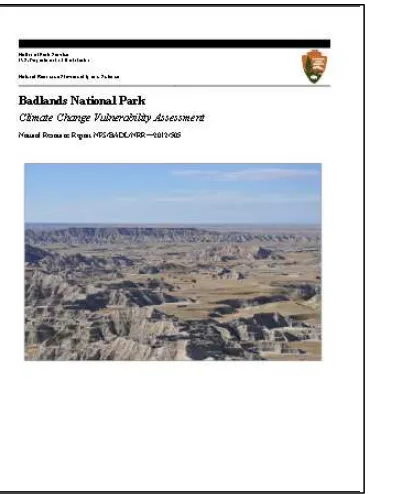
The best NPS example of a completed VA that includes both cultural and natural resources is the Badlands National Park Climate Change Vulnerability Assessment (Amberg et al. 2012) (Figure 12). Initiated by the NPS Climate Change Response Program with two priorities in mind: 1) to assess the potential vulnerability to climate change of natural and cultural resources through the development and implementation of a CCVA, and 2) to develop a methodology for projecting regional climate changes and a process for assessing natural and cultural resource vulnerability to these changes.
Figure 12. Report: Badlands National Park Climate Change Vulnerability Assessment. (Amberg et al.
2012) http://www.cfr.washington.edu/research.cesu/reports/J8W07100036_final_report.pdf
Setting New Park Goals In Line With Climate Change
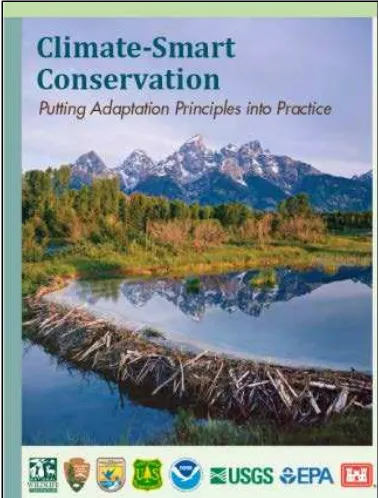
A climate adaptation guidebook Climate-Smart Conservation (Stein et al. 2014), sees assessment and adaptation as ongoing activities that emphasize discovery, learning and adjustment (Figure 13). Of particular significance in this representation is the dynamic between steps 2 and 3 in the process (Figure 9), where “review/revise conservation goals and objectives” prompts a rethinking of what is considered to be vulnerable. Steps 6 and 7 capture another important dynamic, which is the
rethinking and adjustment needed when adaptation actions do not appear to have the desired effect. The overall “climate-smart” cycle links these two dynamics.
24
This perhaps helps explain the low degree of emphasis on setting specific conservation or facilities adaptation targets in the policy and guidance on vulnerability assessment or adaptation planning for parks. An exception might be for decision making on specific park actions that incorporate some kind of climate lens, such as moving public access facilities away from high hazard areas or considering shoreline protection measures. Park managers do not get many second chance
opportunities to revise a facility decision, as adaptive management would otherwise recommend, due to the cost and length of time needed to redesign and redo approval processes.
Figure 13. Report: Climate-Smart Conservation: Putting Adaptation Principles into Practice. (Stein et al.
2014) http://www.nwf.org/~/media/PDFs/Global-Warming/Climate-Smart-Conservation/NWF-Climate-Smart-Conservation_5-08-14.ashx
25
Benefits of Conducting Vulnerability Assessments through Ecological and Socio-Economic Dimensions
The value of NPS sites can be attributed to a combination of the ecological, cultural and facilities assets managed through a socio-economic institutional arrangement. In other words vulnerability and adaptation is dependent upon several dimensions which should be incorporated into the analysis to improve accuracy and acceptance by stakeholders.
Carrying out vulnerability assessments that combine the ecological and management dimensions will provide park managers with a clearer orientation on future planning and management, including funding requirements. While this guide focuses on the ecological dimension of vulnerability assessments, there are some models and experience in the cultural and facilities dimension that should be considered. A facilities-oriented assessment workshop was conducted for ASIS
specifically aimed at facility adaptation to climate change (ICF International 2012). When ACAD realized that SLR would inundate much of their low lying wetlands within the Park’s boundary, they worked with their Friends of Acadia to protect refugia through conservation easements.
The USFWS also initiated an integrated approach in 2012, “refuge vulnerability assessment and alternatives” which is aimed at supporting collaborative landscape management. This included addressing climate change, in order to “see where we should concentrate on conserving remaining high-quality areas and what actions would most effectively achieve this” as well as ranking stressors that prevent achieving conservation goals (Crist, Comer, and Harkness 2012). This guide is detailed and provides guidance on how a site could integrate facilities into an ecological assessment. Another important spatial dimension to consider is that where parks are adjacent or near refuges, they should coordinate on prioritizing conservation areas and management actions related to those areas. This strategy also holds true for other conservation programs neighboring NPS sites, so as to increase coordination, sharing and reduce costs.
Useful Resources for Determining the Scope and Objectives of a VA
Adapting to Climate Change: A Planning Guide for State Coastal Managers (Figure 14) is designed by the National Oceanic and Atmospheric Administration (NOAA) for the coastal management sector. It highlights the unique characteristics of coastal areas, how to design a vulnerability assessment process, key resources to gather data and adaptation options.
26
Figure 14. Report: Adapting to Climate Change: A Planning Guide for State Coastal Managers (NOAA
2010).
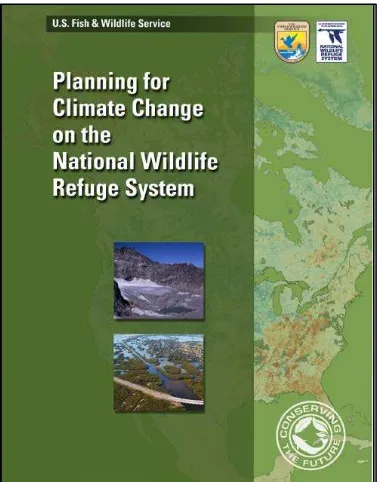
Figure 15. Report: Planning for Climate Change on the National Wildlife Refuge System (Czech et al.
2014).
27
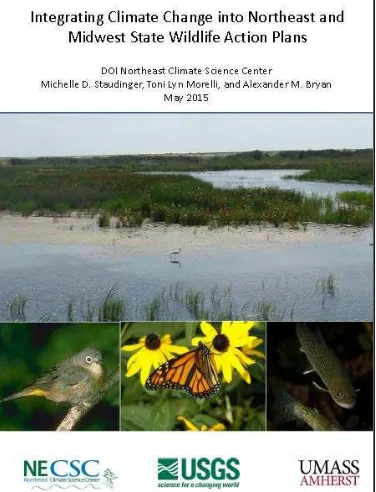
the responses and vulnerabilities of Regional Species of Greatest Conservation Need (RSGCN) and the habitats they depend on (Staudinger et al. 2015) (Figure 16).
Figure 16. Report: Integrating Climate Change into Northeast and Midwest State Wildlife Action Plans
(Staudinger et al. 2015).
https://necsc.umass.edu/sites/default/files/Staudinger%20et%20al.%202015%20Integrating%20Climate% 20Change%20into%20NE%20and%20MW%20SWAPs.pdf
Step by step guidance for selecting the objectives and scope of a VA is provided by the following group of documents, which reflect the views of interagency and interdisciplinary working groups and writing teams, and are written in an accessible style. Some are tailored to the park context while others feature the broader coastal landscape. There is relatively less guidance and experience with facilities and cultural resources.
Many of the conservation-focused approaches to vulnerability assessment acknowledge climate change scenarios out to 2100, however, time frames relevant to near term concerns are less frequently highlighted. Some guidance is strongly recommending consideration of revising conservation goals to allow natural adaptation to occur, but this approach is not as appropriate for vulnerable facilities or cultural resources that are at existential risk.
Scoping the Scale of Coastal Vulnerability Assessments
Spatial Scale
28
Boundaries
For coastal parks, whether to include the marine environment may depend on park boundaries. Even if the park boundary ends at mean low water, look beyond your park boundaries and seek
opportunities to partner with groups interested in understanding the larger coastal ecosystem. The marine environment is highly connected requiring a larger scale of analysis to see the linkages, and parks can be vital components of adaptation for the larger seascape.
Scale for Projections
Establish a time horizon for the projections to be used in the assessment that is meaningful to management horizons, but still long term enough to capture accelerating change. While shorter time points provide more certainty they may hide the larger changes coming in late century. Many available projections have been developed for 2100, though intermediate decadal time periods are becoming more available since this more distant future may have contributed to delaying action.
Time to Conduct Assessment
Since many of the inputs into VAs have significant uncertainty, there’s no perfect assessment. If localized, high resolution info isn’t currently available for in depth assessment, we recommend moving forward with a rapid assessment that can then be included in policy dialogue and influence other VAs.
National Support for Conducting Vulnerability Assessments
Use the following documents to support your case in conducting a VA. Proposals will want to see how your VA will support larger policy goals. The NPS has taken a strong leadership role in climate adaptation and mitigation. Emerging policy guidance exhibits broad based concerns for natural resource, facilities and cultural resource vulnerability.
Department of the Interior Secretarial Order No. 3289 “Addressing the Impacts of Climate Change on America’s Water, Land and Other Natural and Cultural Resources
This 2009 Secretarial Order created a Climate Change Response Council tasked with planning, building scientific capacity, applying a landscape approach, addressing the specific needs of American Indians and Alaska Natives. While the term “vulnerability assessment” is not used, bureaus and offices are directed to “consider and analyze potential climate change impacts when undertaking long range planning exercises, setting priorities for scientific research, developing multi-year management plans and making major decisions regarding potential use of resources under the Department’s purview”, which provides strong support for a mainstreaming approach to assessments.
Policy Memorandum 14-02 Climate Change and Stewardship of Cultural Resources
29
Policy Memorandum12-02 Applying management policies in the context of climate change:
This memo addresses the issue of reconciling management policies that require preserving resources with no impairment by park activities, with external threats such as climate change impacts (NPS 2012a). The guidance confirms that park managers can continue to work to remove invasive species and other stressors, maintain natural processes, restore ecosystems and other measures that support resilience, while at the same time contributing to the mitigation from external sources such as human-induced climate change.
Policy Memorandum 15-01 Addressing Climate Change and Natural Hazards for Facilities:
The memo recaps recent NPS policies and guidance, and directs park managers to “proactively identify and document facility vulnerabilities to climate change and other natural hazards”, to know the hazards affecting each location, their relative important to the park, and the measures that can be taken to promote resilience (NPS 2015).
Link to Regional Strategies
There are several strategies, action plans and networks of peers in the NPS and beyond who are working on coastal VAs. Link up with these groups and highlight how your VA will contribute. The following documents reflect the policy direction, providing additional detail and examples of themes and issues that are being taken into consideration in the NER.
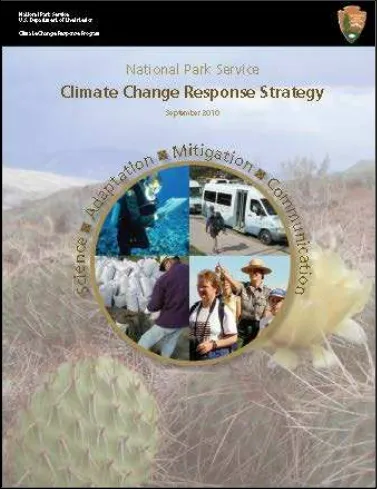
NPS Climate Change Response Strategy (NPS 2010) provides direction to the NPS and its employees to address the impacts of climate change, describing goals and objectives to guide their actions under four integrated components: science, adaptation, mitigation and communication (Figure 17). It strongly urges conducting scientific research and vulnerability assessments to support “on-the-ground adaptation planning”.
Figure 17. Report: NPS Climate Change Response Strategy (NPS 2010).
30
Figure 18. Report: NPS Climate Change Action Plan (NPS 2012b).
http://www.wilderness.net/toolboxes/documents/climate/2012_NPS-CCRPActionPlan.pdf
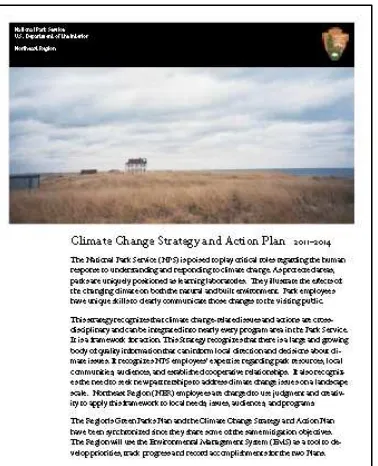
Northeast Region Climate Change Strategy and Action Plan 2011-2014 (NPS 2011)reflects the application of the national NPS strategy, setting out 13 goals and their implementation for science, adaptation, mitigation and communication (Figure 19).
http://classicinside.nps.gov/documents/20110610_NER_Climate_Change_Strategy_web.pdf (available on NPS intranet only).
Figure 19. Report: Northeast Region Climate Change Strategy and Action Plan (NPS 2011).
http://classicinside.nps.gov/documents/20110610_NER_Climate_Change_Strategy_web.pdf
Climate change in Northeast Region coastal parks: Synthesis of a workshop on research and
31
processes, salt marshes, marine ecosystems, fresh water habits and the fauna which depend on them, and migratory species (Figure 20).
Figure 20. Climate change in Northeast Region coastal parks (Roman and Babson 2013).
http://irmafiles.nps.gov/reference/holding/475468.
B. Gathering Relevant Data and Expertise
Key Points of this Section
Even without local data, there are significant data and models available from the internet that can reduce costs to the assessment and provide information beyond the park area. Another key action would be to reach out to local experts in academia and neighboring land use managers, as they may have existing data or are interested in combining resources to broaden the analysis.
Gathering Relevant Data and Expertise
• Review existing literature on assessment targets and climate impacts
• Reach out to subject experts on target species or systems
• Obtain or develop climatic projections, focusing on ecologically relevant variables and suitable spatial and temporal scales
• Obtain or develop ecological response projections
Paths to consider in view of park situation
• Identifying climate phenomena and projections
• Applying remote sensing and mapping of trends and scenarios
32
• Identifying socio-economic impacts
Identifying Climate Phenomena and Projections
The North Atlantic Landscape Conservation Cooperative (LCC) is a partnership comprised of federal, state, tribal, academic and non-profit conservation communities working together to address increasing land use pressures and widespread resource threats and uncertainties amplified by a rapidly changing climate. The partnership addresses these regional threats and uncertainties by agreeing on common goals for land, water, fish, wildlife, plant and cultural resources and jointly developing the scientific information and tools needed to prioritize and guide more effective conservation actions by partners toward those goals. Spatial data is provided via their Conservation Planning Atlas https://nalcc.databasin.org/ (Figure 21).
Figure 21. The Conservation Planning Atlas compiles data layers developed by the North Atlantic
Landscape Conservation Cooperative that can be used for vulnerability assessments.
Park-specific Climate Briefs
33
Figure 22. NPS Climate Change Response Reports.
NPS Climate Change Summary Reports
Historical and projected trends in temperature and precipitation are being provided for all parks through Climate Change Summaries. Figure 23 is an excerpted example from Colonial National Historical Park, Virginia. (https://irma.nps.gov/DataStore/Reference/Profile/2224550)
34
Useful Resources for Identifying Climate Phenomena and Projections
A variety of sources of climate data that will be useful for vulnerability assessments is available at national, regional and local scales. This section gives an overview of and points to some potential data sources. Both historical trends and future projections are needed for exposure analysis. Issues to consider include data quality (e.g. horizontal resolution, vertical accuracy), time horizon (are there earlier than end of century projections), and the relevance of the variable (e.g. is it annual average when the period of interest is seasonal or peak?).
Sea level rise and Storm surge
When thinking about SLR and inundation risk, both storm vulnerability and daily tidal inundation need to be considered, but are two different vulnerabilities/exposures. Whether storms in the Northeast are becoming more intense or frequent is an active area of research, with projections that North Atlantic hurricanes may increase in intensity and rainfall rates (Melillo et al. 2014). Even without changes in storm characteristics, SLR is projected to yield large changes in the frequency and intensity of coastal flooding (Horton et al. 2015).
Historical rates of SLR based on NOAA’s long term tide gauges can be found at http://tidesandcurrents.noaa.gov/sltrends/mslUSTrendsTable.htm.
NOAA calculates SLR over the entire period of record for a particular gauge. NOAA recommends using a minimum of a 30 years record for calculating rates of SLR in order to account for long term variability. Parks may want to calculate rates of SLR over shorter periods, such as to compare with shorter Sediment Elevation Table (SET) records, but should note the loss of accuracy if not
accounting for seasonal and tidal variability (up to the scale of a tidal epoch of 19 years). Sources of water level data for NER parks, including non-NOAA gauges, has been compiled and mapped in a database available at https://irma.nps.gov/App/Reference/Profile/2220635
NPS and Western Carolina University did a 1m SLR Exposure Study (Peek et al. 2015) covering 40 coastal parks including15 NER parks, and a follow up study that includes the remaining NER coastal parks is in progress. Results from this group of initial coastal parks yielded over 39% of the assets designated as high exposure, with a cumulative value of over $40 billion. The majority of the high risk assets were from the Southeast Region low-lying barrier island parks; however, the NER also had over one-third of its assets designated as high exposure, many of which are historically and culturally significant to NPS (Peek et al. 2015).
There are many ways to develop projections of future SLR, depending on which sources are
included, local corrections and desired level of uncertainty/risk. See Elevation Data section for data considerations for inundation modeling. One way to skirt large uncertainty is to map static inundation (sometimes called bathtub modeling) to certain depths without specifying when that amount of SLR is expected. For 9 NER parks in the Monumentation project, SLR inundation risk for sentinel sites at these parks for scenarios of 60 cm, 1 m and 2 m were estimated. GIS layers are available on IRMA (Integrated Resource Management Applications) and a map viewer with results is at
35
Another source of SLR inundation mapping for all coastal NPS units is in development. Consistent projections of SLR based on IPCC rates of SLR and local corrections for land level change where long term local NOAA tide gauges are available for all coastal NPS units are in development, to be finalized in 2016 (see Schupp et al. 2015 Case Study 24 for a project description). Using the US Army Corps of Engineers Sea Level Change Curve Calculator (available at
http://www.corpsclimate.us/ccaceslcurves.cfm) intermediate time horizons including 2030 and 2050 will be provided. Intermediate products of park briefs have been provided directly to parks for Foundation Document and State of the Park workshops (e.g. Caffrey 2014).
While static inundation models are useful in many areas, it is important to consider where landforms are more likely to exhibit a dynamic response and a more complex model may be necessary. A USGS study provides a framework for sea-level rise impact modeling for the U.S. Atlantic coast, distinguishing where static inundation (bathtub) models are sufficient and where dynamic models are likely to be more applicable http://pubs.usgs.gov/of/2014/1252/. This builds on Bayesian Network modeling of long term shoreline change (Gutierrez et al. 2011) which is being applied to ASIS as part of a study of Piping Plover habitat. The need to develop dynamic and predictive models by landform type was identified in a 2009 NER climate change research needs workshop (Roman and Babson 2013); examples of habitat evolution models currently being applied to NER coastal salt marshes include the Marsh Equilibrium Model (based on Morris et al. 2002).
Both the NPS-wide (Caffrey) and NER projects (Monumentation) also include storm surge modeling using NOAA’s SLOSH (Sea Lake and Overland Surges from Hurricanes) model. This tool provides storm surge modeling at current sea level. Combining with sea level rise scenarios isn’t simply additive post-model run because SLOSH dynamically models water levels and the hydrodynamics would be different when run with different basin depths. Storm surge maps for the NPS-wide effort by storm category and at both mean tide and high tide are available at
https://www.flickr.com/photos/125040673@N03/sets/. For the 9 NER Monumentation parks, similar storm surge modeling was corrected with higher accuracy elevation data (Light Detection and Ranging [LiDAR] vs default USGS National Elevation Dataset [NED]) for mean tide; GIS layers are available through IRMA. A comparison of the two efforts which vary only by the elevation data show a large percentage of sites where the NPS-wide effort says will be inundated for a given Category storm that are not estimated to be inundated in the NER project due to differences in the elevation data (see Elevation Data section).
Temperature and Precipitation
Inventories of climate information has compiled by the I&M program in an NPS Climate Database available at https://irma.nps.gov/DataStore/Reference/Profile/2167254with links to active online data sources at http://science.nature.nps.gov/IM/inventory/climate/index.cfm
36
wet variable. All but one (ASIS) had no extreme dry variables. Park specific briefs are available at http://science.nature.nps.gov/im/inventory/climate/recent.cfm
Climate summaries of historical trends and modeled projections in temperature and precipitation are being provided for parks as they do Foundation Document workshops (e.g. Gonzalez 2014) and are available via the IRMA Portal. These are based on statistical downscaling of global climate models to locally relevant scales of 800 m for temperature and 8 km for precipitation.
http://share.inside.nps.gov/sites/nrss/div/ccrp/shared/Planning/Climate Change Science for Parks
Maps of projections for the entire Northeast by decade (2010-2080) done by the Northeast Climate Science Center are available through the North Atlantic LCC Conservation Planning Atlas for the following variables: Mean Maximum Summer Temperature, Mean Minimum Winter Temperature, Growing Season Degree Days and Total Annual Precipitation.
https://nalcc.databasin.org/galleries/bb0f2f56119b4f89a33f7f3bd4c1732b#expand=52764
The spatial resolution of these downscaled projections (600 m) is locally specific for parks, but for most NER parks, is not useful for distinguishing spatial differences within a park.
An example of a study that includes both dynamical and statistical downscaling technique was modeling of temperature and humidity variability at Shenandoah National Park (Lee et al. 2014).
Applying remote sensing and mapping of trends and scenarios
Elevation data
Elevation is one of the major contributors to determining exposure to sea level rise and storm surge. It is determined relative to a known geodetic vertical datum (e.g. NAVD88) or tidal datums (e.g. Mean Sea Level, Mean Higher High Water relative to the current National Tidal Datum epoch 1983-2001). Bathymetry datasets (water depths) may need to be merged with topography data, which often is mapped to a different datum. VDatum is a tool developed by NOAA that can be used to convert between tidal, orthometric and ellipsoidal datums. Beyond understanding inundation risk, tidal datums are important for considering vulnerability of ecosystems that are adapted to particular tidal regimes, such as salt marshes, and the species that depend on them for habitat. Tidal datums are available for NOAA tide gauges, both the long term stations and many additional shorter term historical stations. http://tidesandcurrents.noaa.gov/datums.html?id=8443970
Parks may have additional needs for measuring a local tidal datum, such as where conditions are substantially different than the nearest NOAA station due to basin geometry. At SET sites, the I&M networks calculate a local tidal datum. Depending on the use and length of record, NOAA has methods to correct these to longer term stations, but it should be kept in mind that these corrections rely on the1983-2001 tidal epoch and sea level may have risen enough since then for a noticeable offset.