Research Report
Automatic Commonsense Reasoning Using
PMI Values from Story Corpus
August 2012 Informatics Department Faculty of Information Technology
LEMBAR IDENTITAS
1. Judul Penelitian: Automatic Commonsense Reasoning Using PMI Values from Story
Corpus.
2. Ketua/Penanggung Jawab Pelaksana Kegiatan Penelitian:
Nama (lengkap dengan gelar) : Hendra Bunyamin, S.Si., M.T.
NIK : 720001
Jabatan Akademik / Golongan : Asisten Ahli / III B
Fakultas / Jurusan : Universitas Kristen Maranatha
3. Jumlah Tim Peneliti : 3 orang
4. Lokasi Pelaksana Penelitian : Fakultas Teknologi Informasi
Universitas Kristen Maranatha
5. Lama Pelaksanaan : 6 minggu
6. Sumber Dana Penelitian : Universitas Kristen Maranatha
7. Biaya Penelitian : Rp. 8.000.000,-
Bandung, 1 September 2012
Ketua / Penanggung Jawab Pelaksana
Hendra Bunyamin, S.Si., M.T.
Menyetujui,
Dekan Fakultas Teknologi Informasi
Dr. Ir. Mewati Ayub, M.T.
Mengetahui,
LPPM
LEMBAR PENGESAHAN
Judul Penelitian : Automatic Commonsense Reasoning Using PMI Values from Story Corpus
Peneliti : 1. Hendra Bunyamin, S.Si., M.T. 2. Andreas Widjaja, Ph.D.
3. Radiant Victor Imbar, S.Kom., M.T.
Lokasi Pelaksana Penelitian : Fakultas Teknologi Informasi Universitas Kristen Maranatha
Jl. Surya Sumantri no. 65
Bandung
Penelitian ini telah diselesaikan pada tanggal 1 September 2012 sebagai salah satu
perwujudan Tridharma Perguruan Tinggi Universitas Kristen Maranatha
Bandung, 1 September 2012
Ketua Peneliti
Hendra Bunyamin, S.Si., M.T.
Dekan Fakultas Teknologi Informasi
Dr. Ir. Mewati Ayub, M.T.
Ketua LPPM
Table of Contents
1. INTRODUCTION ... 3
2. WORD ASSOCIATION NORMS AND MUTUAL INFORMATION ... 4
3. COMMONSENSE REASONING ... 8
4. RECOGNIZING TEXTUAL ENTAILMENT (RTE) ... 9
5. COMMONSENSE CAUSALITY ... 10
6. COHEN’S KAPPA ... 11
7. COPA AUTHORING METHODOLOGY ... 13
8. METHODOLOGY ... 14
9. BENEFIT ... 16
10. RESEARCH STAGES... 17
10.1 Creating Index ... 17
10.2 Calculating PMI values for both alternatives ... 20
10.3 Computing the accuracy of the method based on the development set ... 21
11. WORKING SYSTEM CONCEPT ... 21
11.1 Creating index ... 21
11.2 Calculating PMI values for both alternatives ... 22
11.3 Computing the accuracy of our method based on the development set ... 23
12. RESULTS ... 24
13. CONCLUSION ... 25
14. RESEARCHERS ... 25
15. JOB DESCRIPTION ... 26
16. REFERENCES ... 27
1.
INTRODUCTIONCommonsense reasoning is the sort of reasoning we all perform about our everyday world
[1]. As an example, if a person enters into a classroom, then the person will be in the
classroom. Another example is if someone who is holding a book walks into a classroom, the
book will be inside the classroom. It looks like making this kind of inferences is a simple task
but actually it is substantially complicated.
Research in automated commonsense reasoning has been seen to be slow but it is making a
steady progress [2]. Moreover, measuring the progress is difficult because there are not many
few tools that researchers can use to evaluate the performance of their approach [3]. Choice
of Plausible Alternatives (COPA) is one of these tools that can be used.
COPA takes inspiration from the approach used in the Recognizing Textual Entailment
(RTE) challenges. Furthermore, it modifies the format to RTE questions. Instead of two text
sentences, each question has three components: a premise and two plausible alternatives.
There are two types of questions: asking the cause and asking the effect of the premise. The
following is an example of a choice of plausible alternatives:
Premise: The toddler started crying. What happened as a RESULT?
Alternative 1: Her parents took away her toy.
Alternative 2: Her parents gave her a toy.
Our research problem is to build an automated system that is able to choose the most
plausible alternative between two alternatives. Our system will be trained by development
dataset and will be tested by testing data. Our purpose is to achieve a better accuracy than the
baseline methods that will be explained in the next section.
How do we test our automated system? This research uses COPA corpus [3] that has testing
development sets to test our algorithm. The accuracy of our automated system will be
2.
WORD ASSOCIATION NORMS AND MUTUAL INFORMATIONConsider an optical character recognizer (OCR) application. Suppose that we have an OCR
device as in Kahan et al. [8], and it has assigned about equal probability to having recognized
farm and form, where the context is either: (1) federal ___ credit or (2) some ___ of.
federal (
) credit
some ( ) of
Church et al. [4] proposed an association measure which can make use of the fact that farm is
much more likely in the first context and form is much more likely in the second context.
Other alternative disambiguation methods based on syntactic constraints such as part of
speech are unlikely to help since both form and farm are commonly used as nouns.
The association ratio proposed by Church et al. [4] was based on the information theoretic
concept of mutual information. What is ”mutual information”? According to Fano [9], if two points (words), and , have probabilities and , then their mutual information, is defined to be
(2.1)
Informally, mutual information compares the probability of observing and together (the
joint probability) with the probabilities of observing and independently (chance). If there
is a genuine association rule between and , then the joint probability will be much
(Church et al. use a number of different corpora with different sizes: 15 million words for the
1987 AP corpus, 36 million words for the 1988 AP corpus, and 8.6 million tokens for the
tagged corpus) [4]. Joint probabilities, , are estimated by counting the number of times
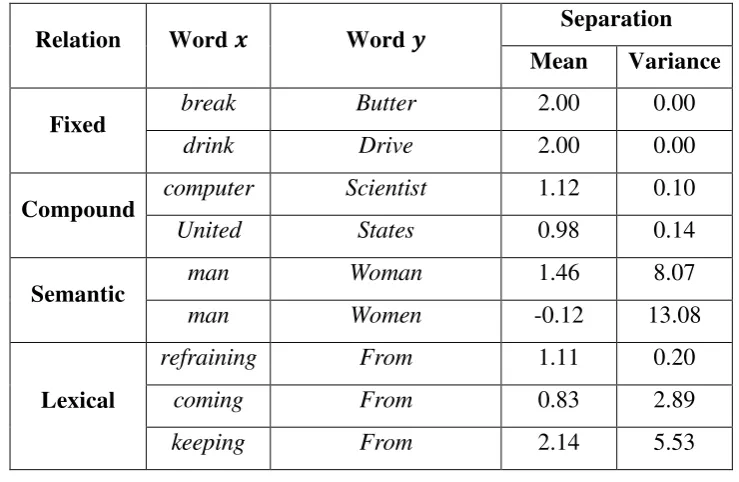
The window size parameter allows us to look at different scales. Smaller window size will
identify fixed expressions (idioms such as bread and butter) and other relations that hold over
short ranges; larger window size will highlight semantic concepts and other relationships that
hold over larger scales.
Table 1 may help to show the contrast. In fixed expressions, such as bread and butter and
drink and drive, the words of interest are separated by a fixed number of words and there is
very little variance. In the 1988 AP, it was found that the two words are always exactly two
words apart whenever they are to be near each other (within five words), that is, the mean
separation is two, and the variance is zero.
Table 1. Meanand Variance of the Separation Between and
Relation Word Word Separation
Mean Variance
Fixed break Butter 2.00 0.00
drink Drive 2.00 0.00
Compound computer Scientist 1.12 0.10
United States 0.98 0.14
closer to one word rather than two. In contrast, relations such as man/woman are less fixed, as
indicated by a larger variance in their separation. (The nearly zero value of the mean
separation for man/women indicates the words appear about equally often in either order).
Lexical relations come in several varieties. There are some like refraining from that are fairly
fixed, others such as coming from that may be separated by an argument, and still others like
keeping from that are almost certain to be separated by an argument.
The ideal window size is different in each case. For this research, the window size, , will be
constraints between verbs and arguments, but not so large that it would wash out constraints
that make use of strict adjacency.
Technically, the association ratio is different from mutual information in two respects.
Firstly, joint probabilities are supposed to be symmetric: , and thus, mutual
illustrating a wide variety of biases ranging from sexism to syntax.
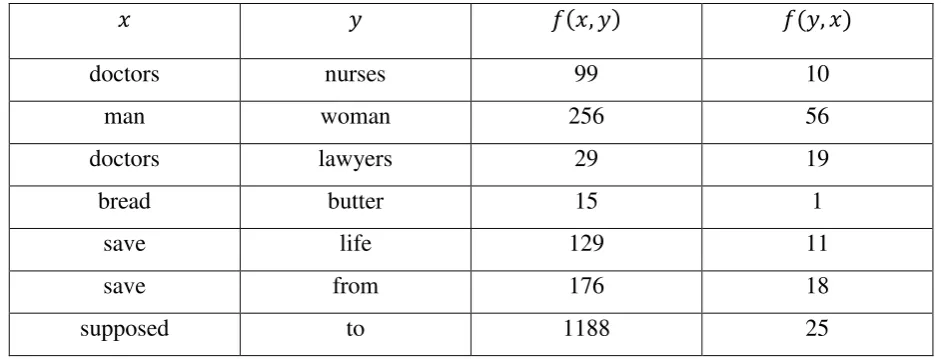
Secondly, one might expect and , but the way they have been
counting, this needn’t be the case if and happen to appear several times in the window.
For example, given the sentence, ”Library workers were prohibited from saving books from
this heap of ruins” which appeared in an AP story on April 1, 1988, and
Table 2. Asymmetry in 1988 AP Corpus (N=44 million)
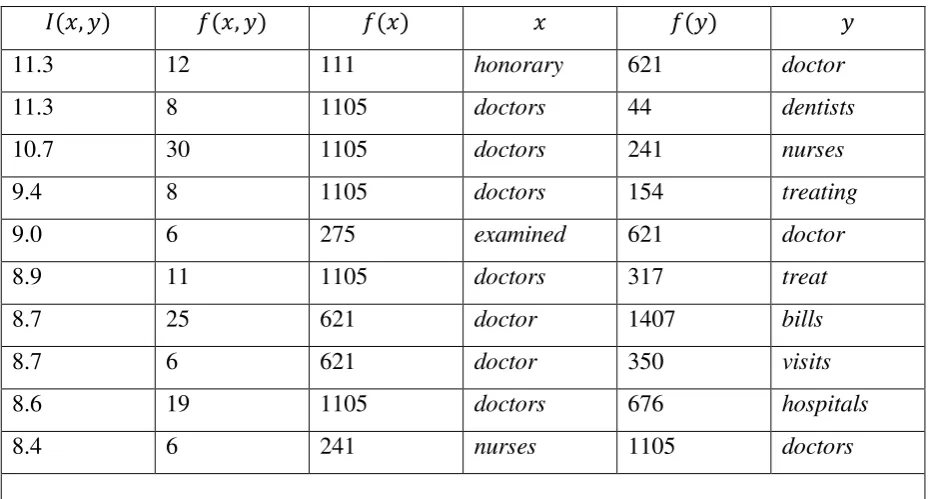
When is large, the association ratio produces very credible results like those reported
in Palermo and Jenkins [10], as illustrated in Table 3. In contrast, when , the pairs
are less interesting. (As a very rough rule of thumb, Church et al. have observed that pairs
with tend to be interesting, and pairs with smaller are generally not. One
can make this statement to be more precise by calibrating the measure with subjective
measures. Alternatively, one could make estimates of the variance and then make statements
about confidence levels, e.g. with 95% confidence, .)
If , Church et al. would predict that and are in complementary distribution.
However, they are rarely able to observe because their corpora are too small (and
their measurement techniques are too crude). Suppose, for example, that both and appear
about 10 times per million words of text. Then, and chance is . Thus, to say that is much less than 0, they need to say that
is much less than , a statement that is hard to make with much confidence given the size of presently available corpora. In fact, they cannot (easily) observe a probability less
than ⁄ , and therefore it is hard to know if is much less than chance or not,
unless chance is very large. (In fact, the pair a...doctors in Table 3, appears significantly less
often than chance. But to justify this statement, they need to compensate for the window size
(which shifts the score downward by 2.0, e.g. from 0.96 down to -1.04), and they need to
estimate the standard deviation, using a method such as Good [11]).
Table 3 Some interesting Associations with “Doctor” in the 1987 AP Corpus (N = 15
Some Uninteresting Associations with ”Doctor”
0.96 6 621 doctor 73785 with
0.95 41 284690 a 1105 doctors
0.93 12 84716 is 1105 doctors
3.
COMMONSENSE REASONINGChoice of plausible alternatives (COPA) is an evaluation of commonsense causal reasoning.
Research in open-domain commonsense reasoning has been hindered by the lack of
evaluation metrics for judging progress and comparing alternatives approaches. Roemmele et
al. [3] took inspiration from large-scale question sets used in natural language processing
research and authored one thousand English-language questions that directly assess common
sense reasoning, called Choice Of Plausible Alternatives (COPA) evaluation.
The fifty-year history of research in automated commonsense reasoning has seen slow but
steady progress [12]. However, measuring this progress is difficult, as there exist few tools
that researchers can use to evaluate the performance of their approach, or compare their work
to that of other research groups. In lieu of established metrics, logical formalizations of
commonsense knowledge have been evaluated using challenge problems of variable
complexity. McCarthy [13] motivated the use of challenge problems, and described how they
could be used to judge the quality of a given axiomization of a domain.
McCarthy [13] argued that a good formalization of the problem domain would not only
correctly solve the original problem, but also exhibit a high degree of elaboration tolerance.
The Commonsense Problem Page collects challenge problems of this sort along with their
elaborations, and serves as the de facto scorecard for progress in the field [14].
As a tool of evaluation, challenge problems of this sort have a number of drawbacks. First,
the degree to which a reasoning system successfully solves the problem is a subjective
judgment. Researchers typically define their own logical formalization of the problem space,
select their own elaborations, and subjectively assess the degree to which their formalizations
accomodate these elaborations. Convincingly arguing for the legitimacy of each success
typically requires a full conference or journal article, one for each challenge problem attempt
(e.g. Lifschitz [15], Morgenstern [16, 18], and Shanahan [17]).
Second, the focus on challenge problems favors research which targets depth rather than
systems will have the inferential competency to solve these challenging problems and their
variants, but lack the inferential coverage to similarly address problems outside the narrow
problem space. This is particularly problematic for research programs where inferential
breadth is the explicit goal, e.g. the CYC project [19] and ConceptNet [20].
4.
RECOGNIZING TEXTUAL ENTAILMENT (RTE)COPA takes inspiration from the approach used in the Recognizing Textual Entailment
(RTE) challenges, organized from 2004 to 2007 by the PASCAL Network of Excellence and
by the NIST since 2008. In these yearly challenges, research groups compete using a
complete set of evaluation questions, typically 1600 questions divided equally into
development and test sets. Each question consists of two text fragments (a text and
hypothesis ), where the task is to determine whether the truth of the second is entailed from
the first. For example, the following pair is an example of a positive entailment:
T : Cavern Club sessions paid the Beatles £15 evenings and £5 lunchtime.
H : The Beatles performed at Cavern Club at lunchtime.
As a tool for evaluation, the RTE question sets have four excellent qualities. First, the inputs
and outputs of the evaluation are well-defined, with correct answers that have been validated
by multiple human raters. Second, the size of the question sets ensures that competitive
systems adequately tackle the problem of breadth. Third, splitting the question sets into
separate development and test sets enables researchers to tune the parameters of their
approaches (during development) without inflating their results due to over-fitting (during
final testing). Fourth, the question sets are balanced with 50% positive and 50% negative
entailment, so that a system’s performance over a random baseline is ready evident.
Although the RTE challenge is itself an evaluation of inferential capability, it does not
directly meet the needs of those interested in commonsense inference. Throughout the RTE
challenges, a distinction has been made between textual entailment and textual implication,
with only the former being the subject of the task. Although the line between entailment and
implication is difficult to define, entailment is meant to include inferences that are necessarily
true due to the meaning of the text fragment. In contrast, implications are inferences expected
to be true, are likely causes or effects of the text, or are default assumptions. Whereas
judgments of entailment between two text segments are strongly positive or negative,
5.
COMMONSENSE CAUSALITYIn philosophy, a rigorous test for determining a causal relation between two events is that of
“necessity in the circumstances” [21, 22]. According to this criterion, event A is necessary for event B if the following statement is true: if A had not occurred in the circumstances, then B
would not have occurred (therefore, A causes B). An alternative view of causality requires
“sufficiency in the circumstances” between two events [21, 23]. A is said to be sufficient in the circumstances for B if it is true that if A occurs and things continue normally from there,
event B will occur (therefore, A causes B). Necessity and sufficiency do seem to play a role in
human reasoning about causality, as demonstrated in experimental settings. When subjects
detect a relation between two events in terms of necessity and/or sufficiency, they also deem
these events as causally related [24, 25].
However, the phrase “in the circumstances” in these definitions only hints at the role of
background knowledge in causal judgments. Other theories of causality have focused on this
knowledge directly. The mechanism view of causal reasoning [26–29] holds that basic
theoretical knowledge underlies individuals’ conception of causal relations. For instance, in
order to recognize the causal relation between the event “the child let go of the string attached
to the balloon” and the event “the balloon flew away”, one needs the knowledge that balloons
naturally rise, for instance. Singer et al. [30] proposes arole for causal bridging inferences,
where individuals invoke a statement that bridges the two events into a causal relation, and
then validate this bridging statement against commonsense knowledge. For example, the
knowledge that "balloons rise" bridges the statements “the child let go of the string attached to the balloon” and “the balloon flew away” into a causal relation, and the validation of this
bridging inference against commonsense knowledge affirms the causal relation.
Events in a causal relation always occur within some context, whether explicit or implicit,
which some researchers term the causal field [22, 31] or the causal complex [32]. These
collections of contributing causal factors are derived from an individual’s knowledge about
what “usually takes place” in the world [31]. As additional information becomes available, this information may yield different conclusions about causality than were previously made
in the absence of that information (nonmonotonic inference). For instance, the following
statement is judged a valid causal relation: “the balloon flew away because the child let go of
knowledge that the balloon contains air rather than helium would render the above statement
invalid, since balloons filled with air do not rise. Still, individuals do not require explicit
clarification about this factor before accepting the given statement as valid. Here, an
inference is plausible insomuch as the cost of including “the balloon is filled with helium” in
the causal field is relatively low, given the two events.
Roemmele et al. [3] used this cost-based view of plausibility to devise a simple question
format to test a system's ability to make commonsense causal judgments. A single question in
this format consists of a statement (the premise) and two choices (the alternatives) that both
could plausibly have a causal relation with the premise. The correct choice is the alternative
which is more plausible, i.e. the cost of including the bridging inferences in the causal field is
less than the other, validated by human judgments. This format has two variations, depending
on whether the alternatives are to be viewed as plausible effects of the premise (forward
causal reasoning) or as plausible causes of the premise (backwards causal reasoning), as in
the following two examples.
(forward causal reasoning)
Premise: The man lost his balance on the ladder. What happened as a result?
Alternative 1: He fell off the ladder.
Alternative 2: He climbed up the ladder.
(backwards causal reasoning)
Premise: The man fell unconscious. What was the cause of this?
Alternative 1: The assailant struck the man in the head.
Alternative 2: The assailant took the man’s wallet.
6.
COHEN’S KAPPACohen's kappa coefficient is a statistical measure of inter-rater agreement or inter-annotator
agreement [36] for qualitative (categorical) items. It is generally thought to be a more robust
measure than simple percent agreement calculation since κ takes into account the agreement
occurring by chance. Some researchers [37] have expressed concern over κ's tendency to
take the observed categories' frequencies as givens, which can have the effect of
underestimating agreement for a category that is also commonly used; for this reason, κ is
Others [38] contest the assertion that kappa "takes into account" chance agreement. To do this
effectively would require an explicit model of how chance affects rater decisions. The
so-called chance adjustment of kappa statistics supposes that, when not completely certain,
raters simply guess—a very unrealistic scenario.
Cohen's kappa measures the agreement between two raters who each classify N items
into C mutually exclusive categories. The first mention of a kappa-like statistic is attributed
to Galton [39] and Smeeton [40].
The equation for is
,
where is the relative observed agreement among raters, and Pr(e) is the hypothetical
probability of chance agreement, using the observed data to calculate the probabilities of each
observer randomly saying each category. If the raters are in complete agreement then .
If there is no agreement among the raters other than what would be expected by chance (as
defined by ), .
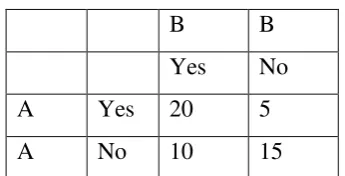
Suppose that you were analyzing data related to people applying for a grant. Each grant
proposal was read by two people and each reader either said "Yes" or "No" to the proposal.
Suppose the data were as follows, where rows are reader A and columns are reader B, as
Note that there were 20 proposals that were granted by both reader A and reader B, and 15
proposals that were rejected by both readers. Thus, the observed percentage agreement
is
.
To calculate Pr(e) (the probability of random agreement) we note that:
Reader A said "Yes" to 25 applicants and "No" to 25 applicants. Thus reader A said
"Yes" 50% of the time.
Reader B said "Yes" to 30 applicants and "No" to 20 applicants. Thus reader B said
Therefore the probability that both of them would say "Yes" randomly is and the probability that both of them would say "No" is . Thus the overall probability of random agreement is .
So now applying our formula for Cohen's Kappa we get:
.
7.
COPA AUTHORING METHODOLOGYThe Choice of Plausible Alternatives (COPA) evaluation consists of 1000 questions of
commonsense causality. The question set was created using a specific authoring methodology
that ensured breadth of topics, clarity of the language, and high agreement among human
raters. This section describes the authoring methodology, focusing on issues of breadth,
clarity and agreement.
The first major concern of the authoring methodology was the breadth of the question set.
Roemmele et al. [3] identified question topics from different sources where a high degree of
breadth was already evident, and then elaborate these topics into premises and alternatives
through our own creativity. This approach helped balance the analytic and generative aspects
of this task, ensuring that the particular topic interests of the author were not over-represented
in the question set, but still allowing for the creative design solutions that each of these
questions required. Two primary sources of question topics were used to ensure breadth.
First, topics were drawn from randomly selected entries in a corpus of one million personal
stories written in Internet weblogs in August and September of 2008 [33]. Roemmele et al.
[3] read hundreds of individual stories looking for topics discussed in these daily narratives of
people's everyday lives. While diverse, this source tended to focus on social and mental
topics, with fewer topics related to natural and physical causality. The opposite was true of
our second source of topics, the subject terms of the Library of Congress Thesaurus for
Graphic Materials [34]. Developed over the course of decades of library cataloging work, this
set of subject terms has broad coverage over the sorts of people, places, and things that
appear in photographs and other imagery. Roemmele et al. [3] randomly selected hundreds
of subject terms from the set to use as question topics, discarding obscure terms or those with
no obvious role in causal reasoning.
The second major concern of the authoring methodology was the clarity of the language. The
guidelines to ensure clarity and to reduce the complexity of the natural language processing
aspects of evaluated systems. The premise and the alternatives were written in the past tense.
They were as brief as possible, omitting words that were not necessary to select the correct
alternative. Proper names of people and places were avoided, as were colloquialisms and
slang. Personal pronouns and definite determiners were used, which led us to adopt a
particular style for co-reference and anaphora. For example, consider the following question:
Premise: The man dropped food on the floor. What happened as a result?
Alternative 1. His dog ran over to eat the food.
Alternative 2. His dog jumped up on him.
The alternatives for this question both explicitly reference a dog whose existence must be
presumed in the premise. Here the personal and possessive pronouns (“his”, “him”) must be
resolved to “the man”, and “the food” must be seen as co-referential with “food” in the premise.
The third major concern of the authoring methodology was that there was agreement among
human raters who were asked to answer each question. To validate the set, Roemmele et al.
[3] enlisted the help of ten volunteers, all native English speaking adults not affiliated with
their project. Each volunteer was given 200 questions, such that two people answered each
question. Agreement between authors was high (Cohen's Κ = 0.965). In all, these volunteers
answered 26 questions differently than was intended by the author of the question. These 26
questions were removed from the set, and replacement questions were generated and
validated by two additional raters. The final set contained 1000 questions, each validated by
two raters who selected the correct alternative intended by the author. The order of the
question set was randomized to mitigate the changes in style during the course of the
authoring process. The position of the correct alternative was also randomized, ensuring that
a random baseline would answer exactly 50% of the questions correctly.
8.
METHODOLOGYA commonsense causal reasoning problem consists of a given premise and two plausible
alternatives for either the cause or the effect of the premise. The following is an example of a
choice of plausible alternatives:
Alternative 1: She got her ears pierced.
Alternative 2: She got a tattoo.
In order to choose the most plausible alternative an algorithm needed to be developed to
determine the choice. Designing, implementing, and measuring accuracy of the algorithm is
the task of evaluating commonsense causal reasoning problem. The accuracy is measured by
comparing result of the developed algorithm with provided (human-based) correct answers.
Our research attempts to evaluate commonsense causal reasoning problem by choosing the
most plausible alternatives [3]. Choosing the most plausible alternatives is determined by the
causality score. The score measures the causal relation between premise ( ) and
its corresponding alternatives and and selects the alternative with the larger score:
{ } . (7.1)
Our score between a premise ( ) and one of its alternatives ( ) is calculated by
taking an average over all possible correlations holding between content words from and :
∑ ∑ . (7.2)
In this general formula, and denote the number of content words in and ,
respectively. We choose the alternative which has the largest causality score between the
premise ( ) with alternative 1 and with alternative 2.
In this research, the pointwise mutual information (PMI) was chosen to be our correlation
measures [4]. We describe the PMI in the following:
Suppose, there are two words, and , that have probability and , respectively;
then, the PMI between and is defined as
. (7.3)
= the probability of observing and together (joint probability). and = the probabilities of observing and respectively.
In this research, our corpus for observation is based on statistical analysis on
English-language story corpus from Andrew S. Gordon and Reid Swanson’s work [5]. There were
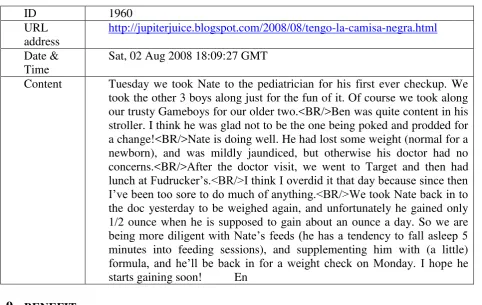
960,098 web blogs; each of these has id, URL address, date and time, and content of the blog.
Table 5 A web blog example took the other 3 boys along just for the fun of it. Of course we took along our trusty Gameboys for our older two.<BR/>Ben was quite content in his stroller. I think he was glad not to be the one being poked and prodded for a change!<BR/>Nate is doing well. He had lost some weight (normal for a newborn), and was mildly jaundiced, but otherwise his doctor had no concerns.<BR/>After the doctor visit, we went to Target and then had
lunch at Fudrucker’s.<BR/>I think I overdid it that day because since then I’ve been too sore to do much of anything.<BR/>We took Nate back in to
the doc yesterday to be weighed again, and unfortunately he gained only 1/2 ounce when he is supposed to gain about an ounce a day. So we are
being more diligent with Nate’s feeds (he has a tendency to fall asleep 5
minutes into feeding sessions), and supplementing him with (a little)
formula, and he’ll be back in for a weight check on Monday. I hope he starts gaining soon! En
9.
BENEFITWe believe that this research will benefit both students and lecturers.
A. For Natural Language Processing (NLP) researchers
Our approach uses simple measurements and the result can be used as a baseline for
other researchers to improve the accuracy of their algorithms.
B. For Academics
Our research result proves that there is a correlation between automated common
sense reasoning and story corpus.
By looking at the benefit above, we hope “Automatic Common Sense Reasoning using PMI
values from Story Corpus” research project is necessary to be carried out at Informatics
10.
RESEARCH STAGESOur research is divided into 3 (three) use cases:
1. Creating index
The size of the story corpus used in this research is almost 1 GB which consists of
960,098 web blogs. This relatively big file needs to be indexed in order to make the
searching process much faster. For this purpose we use Apache Lucene Indexing
Library1.
2. Calculating PMI values for both alternatives
PMI values calculation is based on the story corpus which utilizes statistics of each
word in the corpus.
3. Computing the accuracy of the method based on the development set
After the best alternative is chosen based on the causality score that utilizes PMI
values, we compute the accuracy using all the causality score and the testing
development set.
10.1 Creating Index
Firstly, the story corpus file (one huge text file) containing 960,098 weblogs is divided into
960,098 files. We utilized java.io library in order to divide the file into 960,098 files. Since
we are interested in the content of the weblogs, we extracted only the content. An example of
weblog number 224,219 is shown in Table 6.
Table 6 The contents of weblog number 224,219
Howyadoin'? Iz back and very very tired.Greece was beautiful and hot and sunny and I got
to swim everyday.Huuuumungus thunderstorm on the last full day, very dramatic.Sleep
now...*yawns*Have a missed anything?*hugs close and dozes off...**Hmmmmm...* en
Secondly, we utilized IndexWriter class from org.apache.lucene.index.
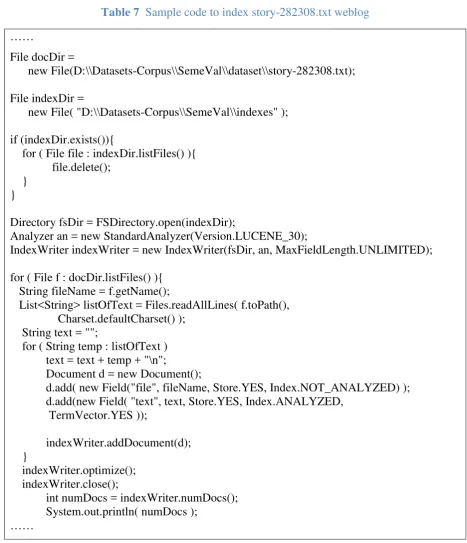
IndexWriter to index all 960,098 weblogs. Table 7 describes the code to index story-282308
weblog .
Table 7 Sample code to index story-282308.txt weblog
……
File docDir =
new File(D:\\Datasets-Corpus\\SemeVal\\dataset\\story-282308.txt);
File indexDir =
new File( "D:\\Datasets-Corpus\\SemeVal\\indexes" );
if (indexDir.exists()){
IndexWriter indexWriter = new IndexWriter(fsDir, an, MaxFieldLength.UNLIMITED);
for ( File f : docDir.listFiles() ){ String fileName = f.getName();
List<String> listOfText = Files.readAllLines( f.toPath(), Charset.defaultCharset() );
String text = "";
for ( String temp : listOfText ) text = text + temp + "\n";
Document d = new Document();
d.add( new Field("file", fileName, Store.YES, Index.NOT_ANALYZED) ); d.add(new Field( "text", text, Store.YES, Index.ANALYZED,
TermVector.YES ));
virtual document object from org.apache.lucene.document.Document class. Finally, we add
the document to IndexWriter.
Before we put the raw text into the document, we utilized an analyzer to tokenize raw text
together certain combinations of the built-in Tokenizers and TokenFilters [35]. The primary
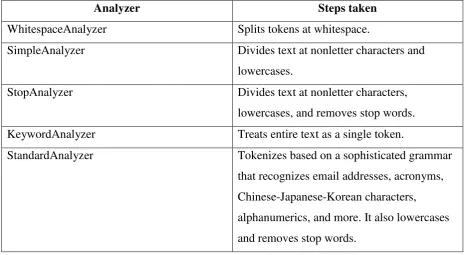
ones are shown in table 8.
Table 8 Primary analyzers available in Lucene
Analyzer Steps taken
WhitespaceAnalyzer Splits tokens at whitespace.
SimpleAnalyzer Divides text at nonletter characters and
lowercases.
StopAnalyzer Divides text at nonletter characters,
lowercases, and removes stop words.
KeywordAnalyzer Treats entire text as a single token.
StandardAnalyzer Tokenizes based on a sophisticated grammar
that recognizes email addresses, acronyms,
Chinese-Japanese-Korean characters,
alphanumerics, and more. It also lowercases
and removes stop words.
StandardAnalyzer holds the honor as the most generally useful built-in analyzer. A
JFlex-based grammar underlies it, smartly tokenizing for the following lexical types:
alphanumerics, acronyms, company names, email addresses, computer hostnames, numbers,
words with an interior apostrophe, serial numbers, IP addresses, and Chinese and Japanese
characters. StandardAnalyzer also includes stop-word removal, using the same mechanism as
the StopAnalyzer (identical default English set, and an optional Set constructor to override).
StandardAnalyzer makes a great first choice.
A code example of using StandardAnalyzer class is shown in table 9.
Table 9 Code Example of Using StandardAnalyzer
……
Version v = Version.LUCENE_30;
StandardAnalyzer analyzer = new StandardAnalyzer( v );
String text = "Mr. Sutton-Smith will pay $1.20 for the book.";
Reader textReader = new StringReader(text);
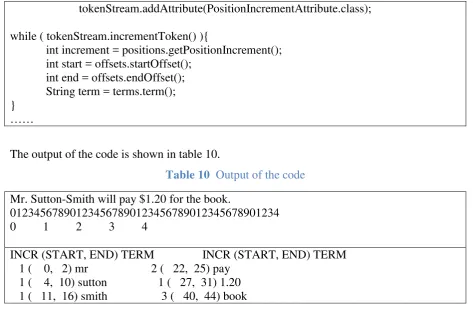
tokenStream.addAttribute(PositionIncrementAttribute.class);
The output of the code is shown in table 10.
Table 10 Output of the code
Mr. Sutton-Smith will pay $1.20 for the book.
012345678901234567890123456789012345678901234
The indexes was created in D:\\Datasets-Corpus\\SemeVal\\indexes directory.
10.2 Calculating PMI values for both alternatives
Given a premise and two alternatives, we would like to compute PMI for each word from the
premise and from each alternative. For example,
Premise (p) : A B C Alternative-1 (a1) : F G Alternative-2 (a2) : H I J
All uppercase letters are words. Formula (7.2) is used to compute the causality score between
∑ ∑
.
Finally, the most plausible alternative is the one which has the largest causality score between
two alternatives.
10.3 Computing the accuracy of the method based on the development set
We calculated the accuracy of our method by counting the number of correct answers divided
by the total number of premises:
(9.3)
The total number of premises is 500. A sample of a premise from the development set is
shown in table 11.
Table 11 A premise from the development set
<item id="161" asks-for="cause" most-plausible-alternative="2">
<p>The coach gave his player a high five.</p>
<a1>The player got a penalty.</a1>
<a2>The player scored a point.</a2>
</item>
have a sequential order in the execution time. The description of the use cases are explained
as follows:
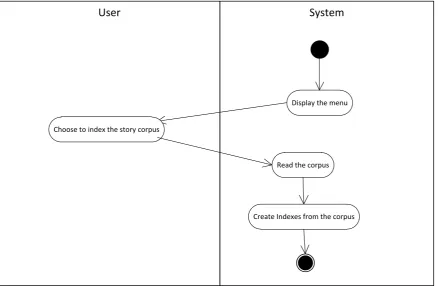
11.1 Creating index
The story corpus is indexed by search engine library and Apache Lucene Library is heavily
utilized in this use case.
The main course
b. System reads the corpus.
c. System creates indexes from the corpus. This indexes are ready to be used for searching
queries
The flow chart of creating index is shown in Figure 1.
System User
Display the menu
Choose to index the story corpus
Read the corpus
Create Indexes from the corpus
Figure 1 Creating index flow chart
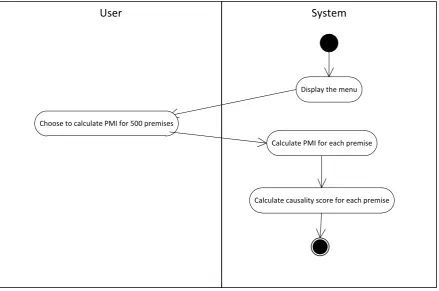
11.2 Calculating PMI values for both alternatives
This use case calculates PMI values of the development set based on statistics of the story
corpus. The development set consists of 500 premises and each premise has two alternatives.
The main course
a. User chooses to calculate PMI values for 500 premises
b. System computes PMI for each premise.
c. System computes causality score for each premise.
User System
Display the menu
Choose to calculate PMI for 500 premises
Calculate PMI for each premise
Calculate causality score for each premise
Figure 2 Calculating PMI values for both alternatives flow chart
11.3 Computing the accuracy of our method based on the development set
The accuracy of our method is calculated based on the development set. The baseline
accuracy according to Gordon, et al. [7] is 60%.
The main course
a. After choosing to calculate PMI for 500 premises, system reads the answers from the
development set.
b. System counts the number of correct premises
c. System calculates the accuracy (9.3)
User System
Read the answers from the development set
Count the number of correct premises
Calculate the accuracy
Figure 3 Computing the accuracy flow chart
12.
RESULTSAs discussed previously, we attempted to solve the Choice Of Plausible Alternatives (COPA)
problem. According to Gordon, et al. [7], the accuracy of their system is 60%. In our
research, the accuracy of our system was 67.4%. Table 12 shows our results alongside
obtained by other researchers.
Table 12 COPA Evaluation Results
System Accuracy (%)
PMI 960,098 web blogs (W=5) 67.4* PMI 1M Stories (W=25) [1] 60.0
Dice Project Gutenberg (W=5) [2] 53.6
* Result for 89 premises
Our method, which utilized 960,098 web blogs, has 67.4% accuracy, which is 12.3% better
than the baseline accuracy by PMI 1M Stories [7]. However, due to time constraints it should
be noted that our result is based on 89 premises rather than 500 premises, as was the case for
the PMI 1M Stories and Dice Project Gutenberg systems. More result will be reported in the
13.
CONCLUSIONWe experimentally investigated the PMI method to improve the accuracy of our system in
order to solve the Choice Of Plausible Alternatives (COPA) problem. Our approach is
analogous to the work done by Roemmele, et al. [3]. However, in our work we utilized a
smaller window size and our system’s accuracy is 12.3% better than theirs. Our results limitations:
1. We utilized 960,098 web blogs, not a million web blogs as in the work done by
Roemmele, et al. [3]
2. Due to time constraints our result is based on 89 premises rather than 500 premises, as
was the case for the PMI 1M Stories [7] and the Dice Project Gutenberg systems [3].
Our work has successfully demonstrated that personal stories from web blogs are good
sources for making decision in the Choice Of Plausible Alternatives (COPA) problem. We
believe that our work will become the baseline approach for other approaches introduced in
the future.
We believe that future research is needed to get better results.. Large-scale logical
formalizations of common sense knowledge, such as the CYC knowledge [19] may yield
good result in this problem. Additionally, crowdsourcing techniques that solicit common
sense knowledge from volunteers on the web [20] may be suited to solve the COPA
evaluation.
14.
RESEARCHERSResearchers involve in this research project are:
i. Hendra Bunyamin, S.Si., M.T. : Principal Research Investigator
ii. Andreas Widjaja, Ph.D. : Researcher 1
15.
JOB DESCRIPTIONResearcher Job Description
Hendra Bunyamin, S.Si., M.T. Designing algorithm, programming, and
directing the project
Andreas Widjaja, Ph.D. Designing system, programming, and
documenting
Radiant Victor Imbar, S. Kom., M.T. Designing system, programming, and
16.
REFERENCES[1] Mueller, E. T. (2006) Commonsense Reasoning. Morgan Kaufmann.
[2] Davis, E. & Morgensten, M. (2004) Introduction: Progress in formal commonsense
reasoning. In Association for the Advancement of Artificial Intelligence.
[3] Roemmele, M., Bejan, C.A., and Gordon, A. S. (2011) Choice of Plausible
Alternatives: An Evaluation of Commonsense Causal Reasoning. In Association for the
Advancement of Artificial Intelligence.
[4] Church, K. and Hanks, P. (1989) Word Association Norms, Mutual Information, and
Lexico-graphy. In Computational Linguistics.
[5] Gordon, A. S. and Swanson, R. (2008) StoryUpgrade: Finding Stories in Internet
Weblogs. In ICWSM.
[6] Chonoles, M. J. (2003) UML 2 for Dummies. Wiley Publishing, Inc.
[7] Gordon, A. S., Bejan, C. A., and Sagae, K. (2011) Commonsense Causal Reasoning
Using Million of Personal Stories. In Association for the Advancement of Artificial
Intelligence.
[8] Kahan, S.; Pavlidis, T; and Baird, H. (1987) On the Recognition of Printed Characters
of any Font or Size. In IEEE Transactions PAMI.
[9] Fano, R. (1961) Transmission of Information: A Statistical Theory of Communications.
MIT Press, Cambridge, MA.
[10] Palermo, D. and Jenkins, J. (1964) Word Association Norms. University of Minnesota
Press, Minneapolis, MN.
[11] Good, I. J. (1953) The population Frequencies of Species and the Estimation of
Population Parameters. Biometrika, Vol. 40.
[12] Davis, E. and Morgenstern, M. (2004) Introduction: Progress in formal commonsense
reasoning. Artificial Intelligence.
[13] McCarthy, J. (1998) Elaboration Tolerance. 4th International Symposium on Logical
Formalizations of Commonsense Reasoning.
[14] Morgenstern, L. (2011) Common Sense Problem Page.
[15] Lifschitz, V. (1998) Cracking an Egg: An Exercise in Commonsense Reasoning.
Proceedings of Common Sense 98.
[16] Morgenstern, L. (2001) Mid-Sized Axiomatizations of Commonsense Problems: A
Case Study in Egg Cracking, Studia Logica.
[17] Shanahan, M. (2004) An Attempt to Formalize a Nontrivial Benchmark Problem in
Common Sense Reasoning, Artificial Intelligence.
[18] Morgenstern, L. (2005) A First-Order Axiomatization of the Surprise Birthday Present
Problem: Preliminary Report. 7th International Symposium on Logical Formalizations
of Commonsense Reasoning.
[19] Lenat, D. (1995) Cyc: A Large-Scale Investment in Knowledge Infrastructure.
Communications of the ACM.
[20] Liu, H. & Singh, P. (2004) ConceptNet: A Practical Commonsense Reasoning Toolkit.
BT Technology Journal.
[21] Hart, M. & Honore, A. (1985) Causation in the law. Oxford, England: Clarendon.
[22] Mackie, J. (1980) The Cement of the Universe – A Study of Causation. Oxford: Oxford
University Press.
[23] Trabasco, T., Secco, T. & van den Broek, P. (1984) Causal cohesion and story
coherence. In: Mandl, H., Stein, N.L., and Trabasco, T., Editors, 1984. Learning and
comprehension of text, Erlbaum, Hillsdale, NJ.
[24] Thompson, V. (1995) Conditional reasoning: the necessary and sufficient conditions.
Canadian Journal of Experimental Psychology.
[25] Trabasco, T., Broek, P. & Suh, S. (1989) Logical necessity and transitivity of causal
relations in stories. Discourse Processes.
[26] Salmon, W. (1984) Scientific explanation and the causal structure of the world.
Princeton University Press, Princeton, NJ.
[27] Harre, R. & Madden, E. (1975) Causal powers: a theory of natural necessity. Rowman
& Littlefield, Totowa, NJ.
[28] Shultz, T. (1982) Rules of causal attribution. Monographs of the Society for Research in
[29] Ahn, W., Kalish, C., Medin, D., and Gelman, S. (1995) The role of covariation versus
mechanism information in causal attribution, Cognition.
[30] Singer, M., Halldorson, M., Lear, J. & Andrusiak, P. (1992) Validation of causal
bridging inferences in discourse understanding, Journal of Memory and Language.
[31] Shoham, Y. (1990) Nonmonotic reasoning and causation, Cognitive Science.
[32] Hobbs, J. (2005) Toward a Useful Concept of Causality for Lexical Semantics. Journal
of Semantics.
[33] Gordon, A. & Swanson, R. (2009) Identifying Personal Stories in Millions of Weblog
Entries. Third International Conference on Weblogs and Social Media, Data Challenge
Workshop, San Jose, CA.
[34] Library of Congress Prints and Photographs Division. (1995) Thesaurus for graphic
materials. Washington, DC: Library of Congress Distribution Service.
[35] McCandleness, M., Hatcher, E., & Gospodnetic, O. (2010) Lucene in Action, Second
Edition: Covers Apache Lucene 3.0. Manning Publications.
[36] Carletta, J. (1996) Assessing agreement on classification tasks: The kappa statistic.
Computational Linguistics.
[37] Strijbos, J., Martens, R., Prins, F., Jochems, W. (2006) Content analysis: what are they
talking about?. Computers & Education.
[38] Uebersax JS. (1987) Diversity of decision-making models and the measurement of
interrater agreement. Psychological Bulletin.
[39] Galton, F. (1892) Finger Prints Macmillan, London.
Appendix 1.
Research Project Timeline:
August 2012 September 2012
Stage Activity Week 1 Week 2 Week 3 Week 4 Week 1 Week 2
1 Creating index stage
2
Calculating PMI values for both alternatives stage
3
Computing the