Multi-Agents Distribution Network Problems under
Varying of Transportation Facilities: A Case Study
Yuniaristanto1, Alfin Nuriya Fauziati2, Muh. Hisjam3 and Wahyudi Sutopo4
Laboratory of Logistics System and Business, Department of Industrial Engineering University of Sebelas Maret, Surakarta, INDONESIA
Ir. Sutami 36A, Kentingan, Surakarta, Post Code 57126, Telp/Fax. (0271) 632110. E-mail addresses: [email protected] 1, [email protected],
[email protected], and [email protected]
Abstract. The transportation cost of goods is the highest day-to-day operational cost associated with the
food industry sector. A company may be able to reduce logistics cost and simultaneously improve service level by optimizing of distribution network. In reality, a company faces problems considering capacitated transportation facilities and time constraint of delivery. In this paper, we develop a new model of order fulfillment physical distribution to minimize transportation cost under limited of transportation facilities. The first step is defined problem description. After that, we formulate a integer linear programming model for the single-warehouse, multiple-agents considering varying of transportation facilities in multi-period shipment planning. We analyze problems faced by company when should decide policy of distribution due to varying of transportation facilities in volume, type of vehicle, delivery cost, lead time and ownership of facilities. We assumed transportation costs are modeled with a linear term in the objective function. Then, we solve the model with Microsoft Excel Solver 8.0 Version. Finally, we analyze the results with considering amount of transportation facilities, volume usage and total transportation cost.
Keywords: physical distribution, shipment planning, integer linear programming, transportation cost,
transportation facilities.
1. INTRODUCTION
Distribution network enables product distribute from location where the product is produced to consumer or end-user locations which frequently limited by distance (Chopra and Meindl, 2004). In doing transportation activity, the shipper must not deliver its products by transportation facilities owned. A difference of institution, business type, and governmental regulation causing transportation management requires the best performance for distributing their products. They collaborate with intermediary like forwarders and third-party logistics providers (Pujawan, 2005).
At this paper, research object is a food company with distribution network which spread over all Indonesia. Tiga Pilar Sejahtera Company headquartered in Sragen produces many varieties of food like dry noodles, rice noodles, instant noodles, instant rice noodles, snack and candy for Indonesian market. Tiga Pilar Sejahtera (TPS) Company want we help them to develop product transportation and distribution model using mathematical
TPS distributes its products in two echelons distribution systems that are from warehouse to several distributors. The purpose of formulating and optimizing the food distribution model is to provide TPS with a means for comparing their strategy for moving food through their distribution network with the optimized strategy derived from the formulated model. Therefore, the first objective of the project was to establish the scope of the model by identifying the aspects of TPS distribution that would be studied. The second objective was to define the decision variables, parameters, constraints, and performance measures necessary for formulating a model of TPS food distribution operations. The third objective was to formulate a mathematical programming model of the distribution activities. The fourth objective was to identify software for solving the defined mathematical programming model. And final objective was to analyze the optimal distribution of food determined for the model
to identify improvements to the current distribution strategy used by TPS. TPS staff assisted in establishing the problem definition; defining the model’s decision variables, parameters, constraints, and performance measures; validating the model formulation; providing input parameters for the model; and analyzing test scenarios.
2. PROBLEM DESCRIPTION
The scope of the distribution network can depict as Figure 1. TPS produces many varieties of food are classified in 10 product families and 88 product items. Transportation vehicles used consist of two types that are truck owned by company ( shipper) and truck from third-party logistics providers ( carriers) with differences of volume and distribution area. There are around 36 carriers becoming company partner.
TPS classifies their transportation vehicles become thirteen classes by considering truck volume in meter cubic, ownership and destination point (distributor location). Two categories is property of TPS, while the others are property of the carrier companies. The company has two-echelon distribution network that consist of one warehouse and 59 distributors divided in five distribution areas. Demand quantities are based on forecasting methods that established by TPS.
The distribution of goods is a dynamic activity. Therefore, the activities captured by the model must be indexed over time. The model must take into consideration the planning horizon of interest to TPS. A planning horizon was used for four weeks. Lead-time delivery each distributor is dependent on distance between distributors and company warehouse.
As illustrated earlier, this study is primarily concerned with reducing total transportation cost in single-warehouse multi-agent distribution network by considering delivery lead time and capacitated transportation facilities. We have to decide product amount will be delivered to each distributor and number of transportation facilities will be assigned to each distributor.
.
3. MODEL FORMULATION
We formulate the problem above in Integer Linear Programming model. Assumptions considered by this model are:
• Number of trucks always available,
• Number of distributors is constant,
• Quantity of daily demand is known in advance,
• Delivery cost is constant along time,
• Delivery lead time is deterministic and static
While none of these assumptions are perfectly valid, we agreed that they were necessary for one of two reasons. First, it was agreed that a simpler model will be beneficial for this study. Second, valid data sources necessary for relaxing these assumptions did not exist. The model developed in this paper use the following notations:
Decision variables:
• Xijk : number of trucks i are assigned to distributor j on
day k,
Parameters:
• Cijk : delivery cost for truck category i to distributor j on
day k,
• Djk: demand of distributor j on day k,
• qi : volume of truck- i (m3) , • ti : loading tolerance for truck- i,
• Tik: number of truck- i available ,
• i : index for truck category (1, ..,13)
• j : index for distributor (1, 2...59)
• k : index for day (1,2...6)
Objective Function:
This model is aimed to minimize variable transportation cost as follow:
∑
∑
∑
∈ ∈ ∈=
I i ijk ijk J j K kc
x
Z
min (1)Subject to
a. Number of trucks constraint
k
i
T
x
x
ik j k j i ki
+
≤
=
∀
∑
=;
5
,
3
,
1
,
2
12 2 , , , 1 , (2)k
T
x
x
x
x
x
k j jk j jk j jk j jk k∀
≤
+
+
+
+
∑
∑
∑
∑
= − = − = =;
2
2 46 42 1 2 26 18 1 2 46 28 2 26 2 2 , 1 , 2 (3)k
i
T
x
x
x
x
i k i k ikj ijk j ijk
∀
=
≤
+
+
+
− − = − =∑
∑
;
12
,
10
,
6
,
4
,
3 , 50 , 2 , 50 , 50 42 1 50 28 (4)k
T
x
x
k j jk jjk
+
∑
≤
∀
∑
= − =,
7 27 13 1 7 27 13 7 (5) k i T x x ik j ijk jijk +
∑
≤ = ∀∑
= − = ; 11 , 8 , 55 51 1 55 51 (6) k i T x x x x x ik k i k i j ijk j ijk j ijk ∀ = ≤ + + + + − − = − = − =∑
∑
∑
; 13 , 9 , 4 , 59 , 3 59 , 59 56 2 59 56 1 59 56 (7)b. Truck volume constraint
k j i D t q
x i jk
I i
i
ijk( − )≥ , ∀, ,
∑
∈
(8)
c. Allocation decision constraint
k
j
i
x
ijk≥
0
,
∀
,
,
(9)k
j
i
Equation (1) is objective function that minimizes the sum of the costs to distribute goods from warehouse to distributor-j using truck-i during k days. Constraint set equation (2)-(7) represents the number of truck class-i assigned to deliver products to distributor area on day-k are not permitted exceeds number of truck available by considering delivery lead time. Constraint set equation (8) ensures that all the demand of distributor-j day-k is balanced by total volume of product that has been transported from warehouse. Constraint equation (9) enforces the non-negativity restriction on the decision variables used in this model. Constraint set equation (10) enforces the integer number of the decision variables
4. NUMERICAL RESULT AND ANALYSIS
Data collected as inputs in data processing and analyzing are:
(i) Truck data. Data about truck classification by
considering ownership of truck, truck volume, number of truck available, and delivery coverage. This data needed to knows number of vehicles which can be assigned to deliver product to distributor.
Table 1: Truck Classification
Class(i) Owner Volume Area Available 1 Company 9,5m3 d<100 8
2 Company 14m3 d<600 10
3 Carrier 14m3 Central Java 13
4 Carrier 14m3 East Java 10
5 Carrier 28m3 Central Java 101
6 Carrier 28m3 East Java 91
7 Carrier 28m3 West Java 97
8 Carrier 28m3 Jabotabek 49
9 Carrier 28m3 Outside Java 190
10 Carrier 34m3 East Java 14
11 Carrier 34m3 Jabotabek 204
12 Carrier 46m3 East Java 100
13 Carrier 46m3 Outside Java 22
(ii) Distributor data. Data distributor covers distributor
name and addresses, traveled distance from warehouse, and delivery lead time required to distribute the product.
(iii)Product Demand data. Demand data of product each
59 distributors that spread over in all Indonesia during four weeks. Distributors demand has daily time phased.
(iv)Components of Transportation cost. Transportation
cost is cost arising as result of existence of distribution activity of product. Transportation cost for company’s trucks and carrier’s trucks have different components.
Transportation cost for company’s truck consists of two cost types, that is:
- Fixed cost. Fixed cost is expense spent for
transportation activity, and this cost is not influenced by number of deliveries. Fixed cost consisted of three cost components that is expense of depreciation, insurance, and driver salary. - Variable cost. Variable cost depends on number
of truck used for delivery and expense of delivering goods to every distributor. Variable cost consisted of some components that are: administration; food allowance, addition of fee, fuel cost and maintenance cost
Meanwhile variable transportation cost for carrier’s truck is calculated based on truck rent expenses per km.
After data is input into Microsoft Excel Solver 8.0, these data is processed to determine decision variables value. The optimization result can be seen at table. 2.
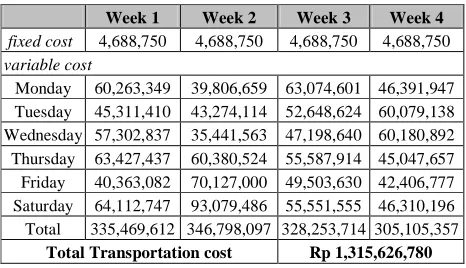
a. Total transportation cost
At first week, transportation cost is equal to Rp 335,469,612. Transportation cost for second week is equal to Rp 346,798,097. Transportation cost for third week is equal to Rp 328,253,714. Transportation cost for fourth week is equal to Rp 305,105,357. So total transportation cost for January is Rp 1,315,626,780. Summary of weekly transportation cost in planning period is shown at Table 2.
Table 2: Summary of weekly transportation cost (Rp)
Week 1 Week 2 Week 3 Week 4
fixed cost 4,688,750 4,688,750 4,688,750 4,688,750
variable cost
Monday 60,263,349 39,806,659 63,074,601 46,391,947 Tuesday 45,311,410 43,274,114 52,648,624 60,079,138 Wednesday 57,302,837 35,441,563 47,198,640 60,180,892 Thursday 63,427,437 60,380,524 55,587,914 45,047,657 Friday 40,363,082 70,127,000 49,503,630 42,406,777 Saturday 64,112,747 93,079,486 55,551,555 46,310,196 Total 335,469,612 346,798,097 328,253,714 305,105,357
Total Transportation cost Rp 1,315,626,780
b. Allocation of Trucks
The allocation of trucks for delivering to all distributors during January can be described as follow:
- Number of truck class 1 for distributor area in radius less than 100km is 204 trucks.
- Number of truck class 3 for central java area is 202 trucks.
- Number of truck class 4 for outside java area is 11 trucks.
- Number of truck class 5 for central java area is 179 trucks.
- Number of truck class 6 for east java area is 150 trucks.
- Number of truck class 7 for west java area is 208 trucks.
- Number of truck class 8 for jabotabek area is 31 trucks.
- Number of truck class 9 for outside java area is 7 trucks.
- Number of truck class 10 for east java area is 28 trucks.
- Number of truck class 11 for jabotabek area is 19 trucks.
- Number of truck class 12 for east java area is 38 trucks.
- Number of truck class 13 for outside java area is 27 trucks.
The summary of vehicle should be assigned is shown at Tables 3.
Table 3: Summary of Trucks Allocation
9.5m3 14m3 14m3 28m3 34m3 46m3
s<100 s<600 Central java
Outside java
Central java
East java
West java
Jabo tabek
Outside java
East java
Jabo tabek
East java
Outside java
Monday 21 10 3 1 8 4 8 0 0 3 3 2 1
Tuesday 20 1 1 0 6 7 12 0 0 1 0 1 1 Wednesday 8 10 6 1 8 6 9 2 0 0 1 3 1 Thursday 8 1 8 1 8 4 12 2 1 2 0 2 1
Friday 7 9 5 0 8 5 4 1 1 1 1 1 0
Saturday 8 2 7 1 8 9 13 1 0 1 2 2 0
Total 72 33 30 4 46 35 58 6 2 8 7 11 4
Monday 8 10 12 0 8 6 5 0 0 0 2 0 1
Tuesday 8 0 5 0 8 5 9 0 0 1 1 1 1
Wednesday 8 10 13 0 8 2 5 0 0 1 1 1 0 Thursday 6 0 3 0 8 6 15 1 0 4 1 0 2
Friday 7 10 9 0 5 8 9 2 0 1 1 6 2
Saturday 8 9 18 0 8 13 17 2 1 4 1 1 1
Total 45 39 60 0 45 40 60 5 1 11 7 9 7
Monday 8 10 15 0 8 8 7 2 0 1 0 3 2
Tuesday 3 1 9 0 5 7 11 0 1 0 1 1 2
Wednesday 8 9 7 1 8 3 7 1 0 1 0 1 2 Thursday 8 1 2 1 8 10 8 1 0 1 1 1 2
Friday 8 9 3 1 8 6 5 1 0 1 1 1 2
Saturday 8 3 14 2 8 6 6 3 0 1 0 1 1
Total 43 33 50 5 45 40 44 8 1 5 3 8 11
Monday 8 10 9 0 8 6 5 2 0 0 0 0 2
Tuesday 5 1 17 1 6 7 12 2 0 0 0 1 1 Wednesday 8 9 18 0 8 8 5 3 1 0 1 2 2 Thursday 7 5 3 0 5 4 10 3 1 3 0 0 0
Friday 8 7 3 1 8 5 8 1 0 1 1 2 0
Saturday 8 5 12 0 8 5 6 1 1 0 0 5 0 Total 44 37 62 2 43 35 46 12 3 4 2 10 5 Total
trucks
c. Remains of volume
Remains of volume are calculated with decay of load volume with demand volume loaded. At first week, load volume remain is 1,002.177 m3. The remains of load volume for second week is 1,127.253 m3. The Remains of load volume for third week is 1,104.735 m3. The Remains of load volume for fourth week is 1,101.864 m3. So, the total remains of load volume for January is 4,336.029 m3. The summary remains of volume overall of visible is showed at Tables 4.
Table 4: Summary remains of volume
Week 1 Week 2 Week 3 Week 4
Monday 188.465 136.705 249.051 160.619 Tuesday 175.358 95.011 227.656 247.505 Wednesday 152.329 127.433 129.495 185.176 Thursday 148.932 174.469 185.876 129.222 Friday 130.783 158.335 140.728 161.990 Saturday 206.309 435.300 171.929 217.352 Total 1,002.177 1,127.253 1,104.735 1,101.864
Total Remains of volume (m3) 4,336.029
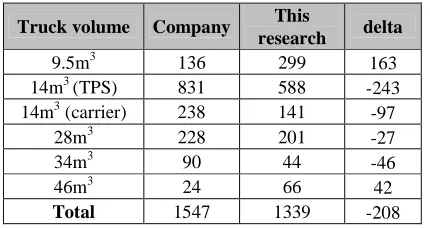
By considering the truck volume and truck ownership, we could make comparison of number of deliveries between company data and research result (see Table. 5). Number of deliveries truck sized 9.5m3 increases equal to 163 deliveries, company’s truck sized 14m3 decreases equal to 243 deliveries, carrier’s truck sized 14m3 decreases equal to 97 deliveries, truck sized 28m3
[image:6.612.98.313.495.609.2]decreases equal to 27 deliveries, truck sized 34m3 decreases equal to 46 deliveries, and truck sized 46m3 increases equal to 42 deliveries.
Table 5: Comparison of number of deliveries based on
company data and research result
Truck volume Company This
research delta
9.5m3 136 299 163 14m3 (TPS) 831 588 -243 14m3 (carrier) 238 141
-97 28m3 228 201 -27
34m3 90 44 -46
46m3 24 66 42
Total 1547 1339 -208
From result of calculation allocation of trucks, knowable of volume utility reached. Volume utility is obtained by dividing demand loaded with total trucks load volume applied. Based on company data, obtained volume utility equal to 63%, while based on calculation
this research is obtained volume utility equal to 76% or there is improvement equal to 13%.
Tables 5: Comparison of Volume Ratio (m3)
Truck volume Company Research Dev
9.5m3 1,904 4,186 2,282
14m3 (TPS) 23,268 16,464 -6,804 14m3 (carrier) 3,332 1,974 -1,358 28m3 2,166 1,909.5 -256.5 34m3 3,060 1,496 -1,564 46m3 1,104 3,036 1,932 Total 34,834 29,065.5 -5,768.5 Demand 22,088.04 22,088.04
Volume usage 63% 76% 13%
From calculation which has been conducted, total transportation cost which must be spent based on this research is equal to Rp 1,315,626,780. Compared with company policy which must spent total transportation cost Rp. 2,060,605,248, so we can reduce total cost about Rp. 744,978,468 or 36%.
In this project, we also design a tool which facilitates counting of truck allocation for TPS’s delivery manager. This tool developed in MS-Excel with designing
user interface that facilitates user make truck allocation
decision using Microsoft Excel Solver 8.0. This tool also provided menu to change model parameters that are number of trucks and components of transportation costs.
5. CONCLUSION
This paper provides A Model for Single-Warehouse Multi-Agents Distribution Network Problems under Varying of Transportation Facilities. Our numerical results show that the transportation cost under limited of transportation facilities proposed by this model is cheaper then current system. For that, we recommend the company as follows:
a. Recommendation which can be given to the company is to allocate number of truck required weekly and daily like shown at the Tables 3.
b. Total required truck to distribute the products on this model is 1,339 or around 13.4% lower than company required.
c. Volume utility of all trucks based on this model is equal to 76%, or around 13% higher than the company system.
The contribution of this research is an approach to problems involving single-warehouse, multiple-agents considering varying of transportation facilities in multi-period shipment planning. We obtained optimal transportation cost by decided the number of each truck types should be assigned to deliver company’s product going to their distributor for a weekly schedule in a monthly planning. For further research, this model could be extended to other characteristics of transportation problems, in examples: with transportation cost discounts, considering maintenance cost, consider loading/unloading cost.
ACKNOWLEDGMENT
The authors are grateful to the anonymous referees for comments and recommendations that improved the paper. This research is funded by Research Grant, DIPA Research Competition, University of Sebelas Maret.
REFERENCES
Arntzen, Bruce C., Brown, Gerald C., Harrison, Terry P., and Trafton, Linda L. (1995), Global supply chain management at Digital Equipment Corporation.”
INTERFACES. Vol. 25. No.1. pp. 69-93.
Camm, Jeffrey D., Chorman, Thomas E., Dill. Franz A., Evans, Janies R., Sweeney, Dennis J., and Wegryn. Glenn. E. (1997), B1ending ORMS, judgement, and GIS: restructuring P&G’s supply chain, INTERFACES, Vol. 27. No.1, pp. 128-142.
Chopra, S. and Meindl, P. (2004). Supply Chain
Management: Strategy, Planning, and Operations, Upper
Saddle River, New Jersey: Prentice Hall.
Jin, Y. and Muriel, A., (2005) Single-Warehouse Multi-Retailer Inventory Systems with Full Truck Load Shipments, MSOM conference.
Martin, Clarence H., Dent, Denver C., and Eckhart. James C, (1993). Integrated production distribution and inventoly planning at Libbey-Owens-Ford.” INTERFACES, Vol. 23. No.3, pp. 68-781
Pujawan, P. (2005). Supply Chain Management , Guna Widya, Jakarta.
Smith, Janna D., Cassady, C.R., Bowden, Royce O., and Ainsworth, Leigh M., (2001), Optimizing Delta and Pine Land Company’s Bag Seed Distribution, Working Paper.
AUTHORS’ BIOGRAPHIES
YUNIARISTANTO is a lecturer in Department of
Industrial Engineering, Faculty of technology, University of Sebelas Maret. He obtained his Bachelor’s degree in Industrial Engineering from Sepuluh Nopember Institute of Technology and Master’s degree in Industrial Engineering from Bandung Institute of Technology. His research interest is at production scheduling, logistic management and supply chain planning. He has published many papers in several national journals.
A.N. FAUZIATI is a student in Department of Industrial
Engineering, Faculty of technology, University of Sebelas Maret. She is an assistant in Laboratory of Logistics System and Business.
M. HISJAM is a lecturer in Department of Industrial
Engineering, Faculty of technology, University of Sebelas Maret. He obtained his Bachelor’s degree in Agricultural Industrial Engineering from University of Gajah Mada and Master’s degree in Industrial Engineering from Bandung Institute of Technology. His research interest is at logistics information system, decision support system, logistic and supply chain development. He has published many papers in several national journals.