Definition of a minimum
standard for forest
management inventories
on KPH level
In cooperation with:In cooperation with:
Published by:
Deutsche Gesellschaft für Internationale Zusammenarbeit (GIZ) GmbH FORCLIME Forests and Climate Change Programme
Manggala Wanabakti Building, Block VII, 6th Floor Jln. Jenderal Gatot Subroto, Jakarta 10270, Indonesia Tel: +62 (0)21 572 0212, +62 (0)21 572 0214
Fax: +62 (0)21 572 0193 www.forclime.org
In Cooperation with:
Ministry of Environment and Forestry
Authors:
Dr. Lutz Fehrmann, Prof. Dr. Christoph Kleinn, Dr. Paul Magdon, Dr. César Pérez-Cruzado, ForestEye GmbH
Advised and edited by:
Tobias Goedde, Senior Advisor for Sustainable Forest Management, FORCLIME
Photo credits:
FORCLIME and ForestEye GmbH
Printed and distributed by: FORCLIME
Jakarta, January 2017
Forests and Climate Change (FORCLIME)
Minimum standard for forest management inventories on KPH level iÊ
Planning management inventories on the KPH level
3
1 Background - Management inventories on KPH level
4
General planning criteria for forest inventories
Objectives and spatial scale of management inventories Information needs on KPH level
8 1.3.1 Translation of information needs to indicators
10 2 Methods
10 2.1 Definition of target areas for inventories
11 2.1.1 Integration of sample based inventories and forest zonation 12 2.2 Set of variables
19 2.2.1 Organizing variables for data management 20 2.3 Integration of remote sensing
20 2.3.1 Collection of training data for remote sensing classification 21 2.4 Sampling design Stratified systematic sampling
Double sampling for stratification (two phase sampling) Using available prior information
Determination of required sample size Calculation of grid width
Nested fixed area sample plots Regeneration sub-plots Deadwood sub-plots
Bitterlich (relascope) sampling Cluster plots
Transects of defined width
Observation units for the assesment of NTFPs 2.5.7.1ÊNTFPÊuseÊofÊtreespeciesÊ
Slope correction
Plots at the forest boundary
Adaption of plot size to local condition 47 2.6 Estimation designÊ
Estimation of means, totals and variance Estimators for simple random sampling
Estimators for stratified sampling
ii ÊÊ Ê Ê ÊÊÊÊÊÊÊÊÊÊÊÊÊMinimum standard for forest management inventories on KPH levelÊ 53 2.8 Accompanying researchÊ
54
53 2.9 QA/QC (Quality assurance and quality control) in forest inventoriesÊ 53
General consider ations regarding QA/QC in forest inventories Preparation of field teams as measure of quality assurance Control measurements
Provision of materials and organization of transport logistics Assigning field sample plots to field teams
Training of field crews 3.2 Equipment and materials 3.3 Organization of field teams
ÊÊ Ê Ê ÊÊÊÊÊÊÊÊÊÊÊÊÊ Ê
BAF Basal area factor (faktor bidang dasar)
DBH Diameter at breast height
DSS Double sampling for stratification
(pengambilan contoh berganda untuk stratifikasi)
EF Expansion factor (faktor ekspansi)
FAO Food and Agricultural Organization of the United Nations
FMI Forest management inventory
FORCLIME Forests and Climate Change Programme
GIS Geographic Information System
GIZ Deutsche Gesellschaft für Internationale Zusammenarbeit
GPS Global positioning system
HHBK Hasil Hutan Bukan Kayu (Non timber forest product)
IPSDH Direktorat Inventarisasi Dan Pemantauan Sumber Daya Hutan
(Directorate of Forest Resources Inventory and Monitoring)
KAK Kerangka Acuan Kerja (Terms of References)
KPH Kesatuan Pengelolaan Hutan (Forest Managemet Unit)
KPHL Kesatuan Pengelolaan Hutan Lindung
(Protection Forest Managemet Unit)
KPHP Kesatuan Pengelolaan Hutan Produksi (Production Forest Managemet Unit)
LAPAN Lembaga Penerbangan dan Antariksa Nasional
(National Institute of Aeronautics and Space)
MoEF Ministry of Environment and Forestry
NDVI Normalized Differenced Vegetation Index
NFI National Forest Inventory (Inventarisasi Hutan Nasional)
NTFP Non-timber forest products
(here synonymous to NWFP= Non-wood forest products)
QA Quality assurance (jaminan kualitas)
QC Quality control (kontrol kualitas)
Preface
The Forestry Law, Law No. 41/1999, mandates the management of forests to be implemented at the provincial level through establishing Forest Management Units/ Kesatuan Pengelolaan Hutan (FMUs/ KPHs) as institution under the Forestry Service (Dinas Kehutanan) that can manage the forest area efficiently and sustainably according to its function and purpose. The establishment of FMUs aims at fostering a more sustainable use of forest resources on local level and facilitating forest planning as foreseen in the Forestry Regulation No P6/Menhut-II/2010 on forest use planning and the development of forest management plans. As of 2016, 529 production (KPHP) and protection (KPHL) FMUs have already been established. Additionally there are 98 conservation FMUs (KPHK).
The application of sound and efficient forest inventory methods at FMU level is a precondition for the formulation of 10-year as well as annual management plans of FMUs and therefore of high importance to the forest sector reform of the Indonesian Government. Specific inventories need to be conducted at regular intervals at FMU, resort and compartment level to provide the basis for forest management by determining the potential of forest and non-timber forest products.
In this context, technical guidelines for forest inventories were developed by the Ministry of Forestry Directorate of Area Management and Preparation of Forest Area Utilization in 2012. The now merged Ministry of Environment and Forestry in cooperation with Deutsche Gesellschaft für Internationale Zusammenarbeit (GIZ) GmbH, FORCLIME Forests and Climate Change Programme, has initiated a review and revision process of these guidelines in 2014 based on scientific considerations, specific FMU inventory needs and current field realities.
The document at hand is the result of the extensive review process which took place over the course of two years, involving international as well as national forest monitoring and inventory experts from various institutions and agencies. It is a set of recommendations and options for improvement which have been gratefully considered to revise the previous technical guidelines for forest inventories on FMU level (No. P.67/2006).
The Director General of Forestry Planning and Environmental Governance has decided to additionally commission FORCLIME to publish a reference document on minimum standard for KPH inventories in order to provide key stakeholders of forest inventories and FMU management with the complete multifaceted recommendations.
We would like to express our sincere thanks to everyone who has contributed to the
compilation of this standard document and hope that this book will be a guiding document in the process of implementing forest management inventories at FMU level.
Director General of Forestry Planning and Environmental Governance
Preface
A Forest Management Unit (FMU/ KPH) is a provincial organisation and serves as a public service provider under national and subnational governments, a permanent management entity and an operational unit of a defined forest area. Oversight over planning and management processes within its jurisdiction is an integral part of the responsibilities implemented by the FMU. Additionally, FMUs fulfil monitoring, advisory and controlling functions within their designated forest management area. Particularly in terms of FMUs managing state forest areas (so called “wilayah tertentu”, constituting for non-licensed production and protection forests), which are not given to third parties (e.g. concession companies), appropriate forest management inventories are required as fundamental basis for Sustainable Forest Management (SFM).
This document summarizes the recommendations for the planning of forest inventories in context of forest use planning and development of forest management plans in Protection Forest Management Units (KPHL) and Production Forest Management Units (KPHP). The review of the existing technical guidelines and the discussion on proposed methods based on scientific and practical considerations were first steps towards the overall goal which is to revise the existing guidelines. Throughout the compilation of this document in 2015 – 2016, several workshops and trainings were conducted. The results of these workshops were considered during the further planning of design elements for management inventories and are included in this final version. This document is composed of two main parts:
(1) An Inventory Protocol that describes background, context and justification of forest management inventories in Indonesia; this protocol elaborates on the technical details of the inventory design elements; and
(2) A field manual that translates the inventory protocol into technical instructions and definitions of variables and that serves as a binding guideline for the field teams when implementing field work.
It should be noted here that the active involvement of local KPH staff in the further planning of inventories is a key requisite for successful KPH planning processes. Local information needs and restrictions for planning and implementation of inventories on the KPH level need to be considered and can only be formulated together with KPH managers who rely on the information from inventories for their management purposes..
The minimum standard document provides a sound basis for FMU managers and other personnel concerned with the topic to make forest management inventories an operational reality in the field.
FORCLIME Principal Advisor
Preface
(1)
(2)
Georg Buchholz
Minimum standard for forest management inventories on KPH level 1Ê
Planning inventories
on the KPH level
Ê
Ê
Ê
Ê
Ê
Part
ÊÊÊÊ ÊÊ Ê ÊÊÊÊÊÊÊÊÊÊÊÊ Ê
ÊÊÊÊ ÊÊ Ê ÊÊÊÊÊÊÊÊÊÊÊÊ Ê Minimum standard for forest management inventories on KPH level 3Ê
1
Background - Management inventories on KPH level
The formation of 120 forest management units as of 2014 is one of the key performance indicators (KPI) in the Strategic Plan of the Ministry of Forestry (Permenhut No. P.51/Menhutll/ 2010 dated 31 December 2010). The establishment of KPHs has the goal to foster a more sustainable use of forest resources at local level and
facilitate forest planning as foreseen in the Forestry Regulation No P6/Menhut-II/2010 on forest use planning and the development of forest management plans. In this context technical guidelines for forest inventories should be developed that describe the scope and goals of forest inventories and define minimum requirements for the different design elements, like sampling-, plot- and estimation design for sample based inventories that should be applied for inventories on the KPH level (KPHP, KPHL).
The main purpose for management inventories in the different areas of a KPH is to generate a sound basis for sustainable management of the respective resources. At
least two kinds of information are needed whenever a sustainable management is planned: The actual extent or amount of the resource per unit area and the expected change or future growth rate. While the first one can be estimated based on statistically planned inventories, the latter requires growth models. Such models can be created from permanent inventories or repeated assessments of the resources under study to monitor the development over time.
KPHs are highly heterogeneous in regard to their composition, the environmental circumstances, forest types, the production- or management goals, their area size and the available expertise and human capacity to carry out forest inventories. It is therefore not practical to define a fixed standard for forest management inventories
4ÊÊÊÊ ÊÊ Ê ÊÊÊÊÊÊÊÊÊÊÊÊMinimum standard for forest management inventories on KPH levelÊ
The starting point for all forest inventory strategy development is the information needs by the respective decision makers. Forest inventories are never an end in itself but they respond to explicit or implicit information needs and have the goal to satisfy these needs to the extent that is technically and economically possible.
The guiding principles of planning forest inventories on the KPH level are a result of the general aim of sustainable and planned management of resources. The inventories should provide the necessary information as basis for a planned and sustainable management, rehabilitation or conservation of available resources, depending on the actual management goals. The main guiding principles for planning management inventories can be summarized as follows:
1. Permanence (to a certain extend) and repeated in adequate time intervals
o Contrary to “one-shot” inventories that give a picture of the actual state of a resource, management inventories should be planned as permanent inventories that are able to monitor the change of respective target variables and that are consistent over time. Change information is the core information to retrospectively assess the success of forest management in the past planning period and the core information for forest management planning for the next planning period. Changes can best be estimated from repeated inventories, which are then called “permanent” inventories. That means that the same sampling locations are visited again, and observations are taken on the same plots and from the same trees in all cycles of the inventory.
2. Statistically soundness (on the KPH or stratum level, not necessarily on compartment level)
ÊÊÊÊ ÊÊ Ê ÊÊÊÊÊÊÊÊÊÊÊÊ Ê
o Inventories should be planned essentially just like any other empirical study: the defined goals shall be best achieved with the resources available in terms of money and human resources as the goals are usually defined in terms of precision of estimation for core target variables for specific units of reporting (KPH area, larger forest blocks or strata). The efficiency considerations do always refer to a joint optimization of the technical design elements and the allocation of resources: the inventory design must achieve the defined precision, and must at the same time be technically and economically feasible.
4. Consideration of the heterogeneous level of inventory expertise inside the KPHs
o All design elements of a minimum standard should be planned as easy as possible and only as complex as necessary. It cannot be expected that KPH staff has in depth knowledge about statistical sampling or remote sensing analysis. 5. Remote sensing integration
o Considering large and sometimes difficult to access areas, the integration of remotely sensed data is a means to increase the efficiency of inventories. Stratification or double sampling for stratification (DSS) are potential methods to be applied. However, also here simple to apply methods that can be reproduced by local staff should be used.
6. Adaptability to special needs and environmental conditions
o In order to be flexible, the minimum standard should define some general design options (e.g. a basic plot design) and a practical set of options on how to adapt a basic design to local needs or environmental conditions.
7. Integration with other inventories
o Inventories on the KPH level should be aligned to the national-wide grid of the National Forest Inventory (NFI). By that the sampling grid in each KPH is referenced to the NFI grid. In order to reduce costs, forest inventories should be combined with other assessments (e.g. soil sampling campaigns or biodiversity monitoring) as much as possible. For common variables that are also assessed in the NFI, the same categories and definitions should be used.
8. Comparability between KPHs
o Even if the sampling and plot design might be adapted to the actual local conditions, forest types and information needs, the results of inventories should be comparable between KPHs.
6ÊÊÊÊ ÊÊ Ê ÊÊÊÊÊÊÊÊÊÊÊÊMinimum standard for forest management inventories on KPH levelÊ
The scope of forest management inventories (FMI) is to give a picture about the extent of natural resources (timber, NTFPs, …) and their use in those forest areas of the KPH that are under active management. The term management is here not restricted to wood production, but includes also other goals, like conservation. The collected data are used for KPH wide mid-term planning of sustainable yields, as basis for management plans or as basis for decisions about conservation or rehabilitation. Forest management inventories are permanent inventories that are carried out in fixed time intervals to derive information about state and changes of resources on the whole KPH level or on the level of larger strata, like e.g. forest types or management zones. Permanence here refers to an inventory design, where most of the plots are revisited and observations are taken exactly at the same points. These “dependent” observations from two points in time are able to deliver more accurate estimates of changes than “independent” inventories, in which other plots are visited during a repetition.
Because of their spatial resolution, forest management inventories are not suitable to deliver detailed information on single forest stands, smaller blocks or individual compartments! Therefore, forest management inventories are not producing data as basis for small scale on site planning. Usually statistically planned inventories on the KPH level are therefore combined with non-statistical surveys or taxation methods on the lowest level of management compartments. These stand or compartment surveys are thereby a means to allocate a KPH-wide sustainable harvesting rate (of timber or NTFPs) to spatially explicit management units. Compartment inventories are not planned as statistical sampling studies but are rather based on non-statistical surveys of the areas. They give room to collect site specific information that does not require a statistical confidence interval (because no statistical sampling procedure is applied) and that aims at describing single forest stands. Usually also other aspects, like biotope mapping or general information is collected by means of such surveys or taxations. It is obvious that a delineation of the forest area in single management blocks or compartments is required in order to describe each one of them individually.
ÊÊÊÊ ÊÊ Ê ÊÊÊÊÊÊÊÊÊÊÊÊ Ê
ÊÊÊÊ ÊÊ Ê ÊÊÊÊÊÊÊÊÊÊÊÊ Ê Minimum standard for forest management inventories on KPH level 7Ê
1.3 Information needs on KPH level
The typical information needs that drive a FMI are the information needs of the KPH or forest enterprise. While this may vary to some extent and priorities (e.g. districts with a high population pressure will be different from those with lesser population pressure) there is always a core set of information that any KPH or forest enterprise needs. And this refers to the information about all elements of the growing stock (so to say: the “production capital”) which includes all marketable forest functions (e.g. wood production, NTFP production) and about their changes (production and productivity). Depending on the specific goals of a forest district and possibly also on legal regulations about forest management, other functions need also to be taken into account which may refer to functions like biodiversity conservation, soil protection, water protection, and recreation / tourism.
Further, the information that is needed as basis for management plans on KPH level is not static but will probably change over time. This is due to the fact that management targets might change according to the actual market situation or the changing extent and status of available resources inside the KPH. Therefore it is recommended to plan forest management inventories in such a way that they are also able to satisfy expected future information needs. Forest resources for timber production are actually widely degraded in many of the newly established KPHs. Therefore the actual mid-term management (and business-) plan will rather focus on other resources, like Non-Timber Forest Products (NTFPs) at the beginning. However, in case of a successful management of the degraded forest areas, it can be expected that the management target might change back to sustainable timber production once the respective forest stands are rehabilitated. In order to have sufficient information about the past development of timber resources at hand, it is therefore highly recommended to collect a basic set of forest variables from the beginning on. This is also necessary to monitor the rehabilitation success or the success of conservation activities. As exact yield tables and growth models are lacking for many tropical tree species, such historical data about the stand development are also a valuable basis for growth information and by that for sustainable management of timber resources.
8ÊÊÊÊ ÊÊ Ê ÊÊÊÊÊÊÊÊÊÊÊÊMinimum standard for forest management inventories on KPH levelÊ
The actual information need emerging from the relevant regulations on the establishment of management inventories on the KPH level is not defined very clearly yet and is sometimes very vague. In general information should be provided on multiple and very different aspects, such as:
NTFPs
Illegal logging
Ownership
Biodiversity of flora and fauna (priority areas)
Timber resources (in some areas)
Rehabilitation status (rehabilitation concessions)
Socio-economic information about communities
It is hardly possible to integrate all of these different and very general information needs into a forest management inventory and it is therefore highly recommended to separate information that can realistically be generated from sample based inventories from other information that rather requires additional or other techniques, e.g. interviews with local communities or remote sensing analysis. The following suggestions for a minimum standard for forest inventories concentrate on such indicators that can realistically be integrated in sample based inventories and that can be observed in the field.
1.3.1 Translation of information needs to indicators
ÊÊÊÊ ÊÊ Ê ÊÊÊÊÊÊÊÊÊÊÊÊ Ê
design. Further, the additional costs (in terms of additional time and assessment effort) should be considered carefully.
Many variables can directly be observed, like “tree species” or “tree diameter” – but for other variables more or less complex indicator systems need to be developed. Examples are “biodiversity” or “degradation status” which cannot directly be observed but they need to be based on the observation of a set of easily observable indicator variables. The development of such indicator systems is usually a matter of discussion and research and finally agreement among the national experts.
The definition of variables that are included in the forest management inventories for Indonesia has been guided by some general efficiency considerations:
In general
1. The set of variables is restricted to those variables that are not available more easily or more economically from other sources;
2. Each variable needs an individual justification why it is observed. To record data for which there is no analysis plan is usually meaningless, unless there is the suspicion that these variables may become relevant in the future in the context of “emerging issues”.
3. The set of variables for the FMI has been defined along the needs as expressed by the counterparts and along the standard variables of FMIs. Of course, there are limits when it comes to variables that require specialized skills or knowledge or that are very time consuming or that are logistically too demanding.
10ÊÊÊÊ ÊÊ Ê ÊÊÊÊÊÊÊÊÊÊÊÊMinimum standard for forest management inventories on KPH levelÊ
2
Methods
In the following a core set of methods for forest inventories are described. The different design elements of sampling studies that need to be planned are the sampling-, plot- and estimation design. The proposed methods assume a certain amount of prior information that is obligatory basis for planning an inventory and that should be available in each KPH. For planning purposes it is for example necessary, to have information about the KPH boundaries (preferably in form of vector data in a GIS) or a zoning according to different forest uses. Further, a core set of remote sensing products should be available. Some of the required data can be provided by national agencies, like e.g. LAPAN or IPSDH, other data are freely available (like e.g. multitemporal Landsat imagery or standard products derived from this data) and can be acquired by each KPH.
2.1 Definition of target areas for inventories
In sample based forest inventories the population is defined as the total area under study. Sampling locations are selected from this population. For pure management inventories that should produce data for management purposes, it is efficient to restrict the sampling frame (the areas in which field observations are collected) to those areas that are under management or are expected to be managed in near future. Management here refers to any kind of planned activity that should be monitored and is not restricted to timber production. Conservation or NTFP utilization are also forms of management. Therefore, not necessarily the whole forest area of a KPH should be inventoried. Sampling should be restricted to those areas where data for management planning are needed and not yet available from other sources. These are usually not the most inaccessible areas. As KPHs are usually composed of different forest areas (concession areas, community forests, conservation / rehabilitation areas, …),
the first step in planning is therefore to identify and prioritize those areas inside the KPH in which the KPH management is obliged to plan and implement inventories. These are usually “public forests” in which a planned and sustainable management is lacking. Areas that are already covered by permanent inventories (like e.g. concession areas) can be excluded from further planning. For the identification of target areas available official maps and the actual land register should be used to identify and delineate the target areas for inventories (sampling frame).
ÊÊÊÊ ÊÊ Ê ÊÊÊÊÊÊÊÊÊÊÊÊ Ê
ÊÊÊÊ ÊÊ Ê ÊÊÊÊÊÊÊÊÊÊÊÊ Ê Minimum standard for forest management inventories on KPH level 11Ê
the total forest area is relevant. This information need, however, should be satisfied by complementary studies that can partly also be integrated in management inventories. As the main purpose and most urgent need for information arises in context of planning for sustainable management, this goal should be addressed with a higher priority.
In order to clearly define the sampling frame it is recommended to carry out a zoning of the KPH area, if not yet done. Such a zoning will inform about the different information needs on different areas and helps to restrict inventories in the different zones to the collection of necessary data. A proper distinction of different zones as well as their monitoring priority is hardly possible without information from field visits. It might therefore be necessary to carry out basic surveys of the forest areas in order to collect basic information about the management priority, the actual use of products, the rehabilitation status or biodiversity. This survey is not intended to be a statistical inventory, but a collection of basic information about different sites by the KPH staff that help to get an overview about the area. In context of this zoning a preferably complete GIS with relevant information should be build up (if not yet existent). This GIS should also be used to plan forest inventories in the different KPH areas.
2.1.1 Integration of sample based inventories and forest zonation
12ÊÊÊÊ ÊÊ Ê ÊÊÊÊÊÊÊÊÊÊÊÊMinimum standard for forest management inventories on KPH levelÊ
could be done. This, however, should be revised and validated later, for example in context of a repetition of the inventory after a certain time period.
The collection of relevant (non-statistical) information that is assessed during the walking time is not described in detail in this guideline document. Usually a field book is used to write down relevant information or GPS coordinates (or tracks), like intersections of the walking line with rivers, special biotopes, observations of rare species, relevant terrain conditions (e.g. rocks, caves, …). The resulting data inform about the presence of these objects in the area, but will not allow estimating their total number. In order to allow field teams to mark and draw special features in the field, respective field maps, in the best case from higher resolution satellite imagery, should be prepared. More details on field maps are given in 2.3.1.
If field teams are able to navigate from one plot to the next in a straight line, then the situation is different and a statistical estimation of the total number of objects is possible following the concept of transect sampling (see 2.5.6).
2.2 Set of variables
The minimum standard proposes a core set of indicators and variables that are measured or observed in all KPHs in whole Indonesia. As the actual management goals of KPHs, the environmental and topographic conditions (forest types, terrain) and the existing resources and capacity to carry out forest inventories are very heterogeneous, a core set of variables to be assessed is a minimum requirement that should be extended by further useful indicators and variables for the actual management goals on the individual KPH level.
In order to ensure consistency of variable definitions between management inventories on the KPH level and the existing concept for a NFI, it would be most useful to adopt those variables (and their definition and classes) that are expected to be useful for management planning from the NFI guidelines. This does not mean that all variables measured in the NFI should be adopted for management inventories, but only those that are relevant and useful for planning! General categorical variables, like forest types, tree species groups, damage classes, etc. should be comparable to existing information or NFI data in order to avoid confusion and misinterpretation between different data sources.
ÊÊÊÊÊÊÊÊ ÊÊ ÊÊÊ Ê ÊÊÊÊÊÊÊÊÊÊÊÊÊÊÊÊÊÊÊÊÊÊÊÊ ÊÊ Minimum standard for forest management inventories on KPH level 13Ê
“biodiversity”, or “NTFP management”. Variables that are used as indicators can be summarized in these groups. One variable in the group “biodiversity” might be the total number of tree species, or the vertical structure of the forest (layering). This grouping is useful to explain the meaning, purpose and priority of each variable.
A comprehensive set of variables has been defined below that can be broken down according to different criteria, among them the sub-division of variables in two groups:
1. According to the object / topic on which the observation took place, for example tree, stand, topography, surroundings, soil, vegetation, …
2. According to their role in analyses. Some variables are used to characterize the forest found at the sample point (basal area, stand strata, growing stock, presence of habitat trees, ...), some serve as classifiers (forest type/species composition, slope, distance to roads,…), and some do support inventory planning, implementation and optimization (time observations, tree positions, coordinates, …).
For data management (and as basis for a database structure) it is, however, more straightforward and meaningful to organize the variables according to the “entity” that they describe or the observation unit and spatial scale on which they are assessed. An example for an entity is a “sample plot” or “sample sub-plot”.
Many different variables can be defined that describe the plot area itself (e.g. its topography by slope, elevation, aspect, …). On a sample plot there are usually trees which are also entities that can be described by variables like DBH or height or damages.
Each variable is described and defined in the “Field Manual” which is an extra section in this document. Description and definition refers to the general meaning of a variable and the measurement/observation procedure to be applied to collect the data, including the measurement devices to be applied for metric variables and complete lists of categories for categorical variables. It is important that these definitions and measurement prescriptions be strictly adhered to by all field teams.
ÊÊÊÊ
Table 1. Grouping of indicator variables according to their scale of observation (categorial, measurement), the respective entity and information category. For each variable its meaning as indicator for different purposes is given.
Scale of
Information category / management goal
Minimum requirement Categorial Measurement Wood products/
timber NT FP
Biodiv. / Conservation
Ecosyst. Services / Carbon
Point Accessability class Utilization potential Point Coordinates Co-registration YES Point GPS Error Co-registration YES Point Landscape context Isolation /
fragmentation YES Point Protection status Restrictions Restrictions Importance /
priority YES
Point Eco-zone YES
Point Catchment area Water provision /
beneficiary YES Point Elevation Conservation
priority YES Point Distance to
settlement
Disturbance risk Point Distance to road Disturbance risk
Compartment Origine (planted/natural) YES Compartment Prior management Rehabilitation
status
Loss/gain Compartment Last logging Rehabilitation
status
Table 1. Grouping of indicator variables according to their scale of observation (categorial, measurement), the respective entity and information category. For each variable its meaning as indicator for different purposes is given.
Scale of
Information category / management goal
Minimum requirement
Categorial Measurement Wood products/
timber NT FP
Biodiv. / Conservation
Ecosyst. Services / Carbon
Point Accessability class Utilization
potential
Utilization potential
Disturbance risk Vulnerability
YES
Point Coordinates Co-registration YES
Point GPS Error Co-registration YES
Point Landscape context Isolation /
fragmentation YES
Point Protection status Restrictions Restrictions Importance /
priority YES
Point Eco-zone YES
Point Catchment area Water provision /
beneficiary YES
Point Elevation Conservation
priority YES
Point Distance to
settlement
Disturbance risk
Point Distance to road Disturbance risk
Compartment Origine (planted/natural) YES
Compartment Prior management Rehabilitation
status
Loss/gain
Compartment Last logging Rehabilitation
ÊÊÊÊ
Information category / management goal
Minimum requirement Categorial Measurement Wood products/
timber NT FP
Biodiv. / Conservation
Ecosyst. Services / Carbon
Compartment Mixture/ Diversity class Potential Potential Importance Stability YES Compartment Layering Vertical structure /
heterogenity
Stability
YES Compartment Rare species Restrictions Restrictions Zoning / Priority
areas
Priority areas Compartment Special habitats biotopes Restrictions Restrictions Zoning / Priority
areas
Priority areas
YES Compartment Utilization Products Products Pressure Beneficiary YES Compartment Illegal exploitation (traps, ..) Restrictions /
sustainability
Pressure Beneficiary Compartment Orangutan (nest sites) Restrictions Restrictions Zoning / Priority
areas Compartment Evidence of intense animal
use (salt licks, …)
Restrictions Restrictions Zoning / Priority areas
Plot Forest type Training data for classification
Potential Potential Zoning / Priority
areas YES Plot Forest sub-type
Plot Development class Potential Potential YES Plot Slope Training data for
classification
Restrictions Zoning / protected areas
Protection
function YES Plot Terrain form Training data for
classification YES
Plot Aspect Training data for
classification YES
Information category / management goal
Minimum requirement
Categorial Measurement Wood products/
timber NT FP
Biodiv. / Conservation
Ecosyst. Services / Carbon
Compartment Mixture/ Diversity class Potential Potential Importance Stability YES
Compartment Layering Vertical structure /
heterogenity
Stability
YES
Compartment Rare species Restrictions Restrictions Zoning / Priority
areas
Priority areas
Compartment Special habitats biotopes Restrictions Restrictions Zoning / Priority
areas
Priority areas
YES
Compartment Utilization Products Products Pressure Beneficiary YES
Compartment Illegal exploitation (traps, ..) Restrictions /
sustainability
Pressure Beneficiary
Compartment Orangutan (nest sites) Restrictions Restrictions Zoning / Priority
areas
Compartment Evidence of intense animal use (salt licks, …)
Restrictions Restrictions Zoning / Priority
areas
Plot Forest type Training data for
classification
Potential Potential Zoning / Priority
areas YES
Plot Forest sub-type
Plot Development class Potential Potential YES
Plot Slope Training data for
classification
Restrictions Zoning / protected
areas
Protection
function YES
Plot Terrain form Training data for
classification YES
Plot Aspect Training data for
ÊÊÊÊ
Information category / management goal
Minimum requirement Categorial Measurement Wood products/
timber NT FP
Plot Disturbance species Disturbance
Plot Soil erosion Restrictions Degradation Risk/Loss
Plot Humus layer
Plot Basal area Potential Conservation value Carbon density YES
Plot Soil texture Site-Species
matching
site conditions Soil sensitivity
Plot Soil color Site-Species
matching
site conditions Soil sensitivity
Plot Soil humidity Site-Species
matching
site conditions Soil sensitivity
Plot Fire occurence Training data for classification
Information category / management goal
Minimum requirement
Categorial Measurement Wood products/
timber NT FP
Plot Disturbance species Disturbance
Plot Soil erosion Restrictions Degradation Risk/Loss
Plot Humus layer
Plot Basal area Potential Conservation value Carbon density YES
Plot Soil texture Site-Species
matching
site conditions Soil sensitivity
Plot Soil color Site-Species
matching
site conditions Soil sensitivity
Plot Soil humidity Site-Species
matching
site conditions Soil sensitivity
Plot Fire occurence Training data for classification
Quality Extend / area Biodiv. Loss Carbon loss
Plot Fire cause Pressure
ÊÊÊÊ
Information category / management goal
Minimum requirement Categorial Measurement Wood products/
timber NT FP
Biodiv. / Conservation
Ecosyst. Services / Carbon
Plot D-class of stumps legal/illegal logging
Browsing damage Sustainability Sustainability Pressure Loss
NTFP
sub-Dead wood category Natural or
(legal/illegal) logging
Illegal logging Biomass / Carbon
Information category / management goal
Minimum requirement
Categorial Measurement Wood products/
timber NT FP
Biodiv. / Conservation
Ecosyst. Services / Carbon
Plot D-class of stumps legal/illegal logging
Browsing damage Sustainability Sustainability Pressure Loss
NTFP
sub-Dead wood category Natural or
(legal/illegal) logging
ÊÊÊÊ
NTFP species Diversity / Relation between
Tree Species Commercial
species
ÊÊÊÊ ÊÊ Ê ÊÊÊÊÊÊÊÊÊÊÊÊ Ê
ti
ÊÊÊÊ ÊÊ Ê ÊÊÊÊÊÊÊÊÊÊÊÊ Ê Minimum standard for forest management inventories on KPH level 19Ê 2.2.1 Organizing variables for data management
Contrary to the subject matter grouping of variables described above, the data should be subdivided into different groups according to their reference scale and/or the respective target object for the data management. This grouping is much more suitable to construct a suitable database structure and to analyze the data. Every variable is explicitly defined in terms of scale of measurement/ observation, the possible values or classes (in case of ordinary or Boolean scale) and their precision.
Sample information [SAMPLE_ ]: General information on the sample, e.g. date of assessment, field team, etc.
Sample point [POINT_ ]:All variables describing the sampling location (dimensionless point), e.g. coordinates, height above sea level, etc.
Compartment [COMP_ ]: Characteristics of the forest stand or management compartment in which the sample point is located. This information refers to the conditions in the surrounding of the plot. Some variables could also be assessed on the way to the plot.
Plot [PLOT_ ]: Variables describing the conditions on the defined sample plot. These variables describe characteristics that are directly affecting the trees growing in the plot area and that could be correlated to remote sensing data covering the plot area and direct surrounding.
Single tree [TREE_ ]: Variables measured or observed on the individual trees in the plot.
Dead wood [DEAD_ ]: All variables observedon standing and lying dead wood, if information on deadwood is needed.
Regeneration [REG_ ]: Variables assessed on the regeneration sub-plot describing the status of regeneration.
NTFP [NTFP_]: Variables assessed on the NTFP sub-plot referring to Non Timber Forest Products.
The naming of each variable (in the database, not necessarily in the field forms) should follow this standard in order to allow a consistent data management. Following this concept the diameter of a tree (dbh measured in 1.3m height) would be named TREE_DBH as it is an attribute of the entity “TREE”.
All these variables will be further defined in the following chapters.
20ÊÊÊÊ ÊÊ Ê ÊÊÊÊÊÊÊÊÊÊÊÊMinimum standard for forest management inventories on KPH levelÊ
Management inventories should only be implemented where management (planned utilization of resources or conservation) is planned; however, for some reasons there is also interest to get information on the total forest area. Remote sensing can play an important role in this regard. In principle there are two options to integrate remote sensing data into forest inventories: 1) in the design phase of inventories, where remote sensing can help to increase the efficiency of the sampling- and plot design for field samples, or 2) in the estimation stage. In case that target variables are correlated to indicators derived from remote sensing (a typical example is NDVI or texture indices). Remote sensing data can increase the efficiency of the estimation process if correlations to field observations can be found.
Some examples on how to integrate remote sensing data in the design phase are given in context of the described sampling designs, while remote sensing integration in the estimation phase is briefly discussed in the chapter on estimation design.
2.3.1 Collection of training data for remote sensing classification
Beside the use of remote sensing data during the planning and estimation stage of forest inventories, it is also meaningful to integrate the collection of training data for remote sensing classification into the field work. This is not part of the actual inventory work, but a complementary study that can be integrated in the field work. The collection of such training data (sometimes referred to as “ground truth”) has no direct influence on the sample based estimation of target variables from field plots, but it is important information that can be used as basis for remote sensing analysis later. Training data are needed to “train” a classification algorithm during remote sensing analysis. They provide information on the actual land cover (or forest typ and structure) for a specific set of pixel values from a satellite image.
Standard plot designs of management inventories are usually relatively small and therefore not very suitable to deliver enough information for remote sensing classification. Therefore, in order to integrate a meaningful collection of training data, larger areas should be considered. These areas are not intended to take any measurements, but just to assign a land cover- or forest type.
ÊÊÊÊ ÊÊ Ê ÊÊÊÊÊÊÊÊÊÊÊÊ Ê
ÊÊÊÊ ÊÊ Ê ÊÊÊÊÊÊÊÊÊÊÊÊ Ê Minimum standard for forest management inventories on KPH level 21Ê
component analysis of spectral bands to increase the contrast between different classes as much as possible. If the distinction of different classes is possible in the imagery, it is also possible to derive a segmentation, which is a grouping of pixels into segments according to their spectral characteristics. If field teams are equipped with such maps, they can describe the actual land cover or forest type for each segment that they are passing on the way and assign the respective class (land cover code) on the map. A more statistical way to collect ground truth would be to restrict this assessment to an area around the locations of sample plots (e.g. a map window of 100*100 m). In order to allow a later classification, the respective forest- or land cover types should be determined before going to the field.
2.4 Sampling design
“Sampling design” refers (1) to the way how samples are selected and (2) to sample size (=the number of samples).
Out of the two basic sampling designs – simple random sampling and systematic sampling – it is clearly systematic sampling which is most frequently used in forest monitoring. Given the same number of plots, systematic sampling produces commonly much more precise estimates than simple random sampling. That means: a given targeted precision can be obtained with a smaller sample size with systematic sampling. This is why systematic samplings is always the first choice for forest inventories and there is no FMI that these authors are aware of that utilizes simple random sampling. Commonly, FMIs employ systematic sampling on square grids which show close to optimal properties regarding precision of estimation.
The planning of a suitable sampling design depends very much on the available a priori information about the KPH area. Considering the very different conditions in KPHs all over Indonesia, three different general design alternatives are proposed here: a)
unstratified systematic sampling, b) stratified systematic sampling and c) double sampling for stratification (two phase sampling). All of them are briefly described in the following.
22ÊÊÊÊ ÊÊ Ê ÊÊÊÊÊÊÊÊÊÊÊÊMinimum standard for forest management inventories on KPH levelÊ
With this sampling design a fixed systematic (usually quadratic) grid is superimposed over the forest area inside the KPH (or the defined sampling frame for inventories). The grid should be aligned to the base grid of the NFI that is, depending on location in Indonesia either 20x20 km, 10x10 km or 5x5 km. The sampling grid should therefore be planned in the same map projection and a NFI sampling location should be used as starting point for the KPH grid. In order to align the grid width to the NFI, the point distance should be planned as a multiple of the NFI grid distance. Based on the estimated required sample size (see 2.4.5) the closest integer grid width should be identified as a multiple of the NFI base grid. The alignment of grids with the NFI grid should ensure that the single sampling studies on individual KPH areas could in principle be combined and aggregated over multiple KPHs. Planning and implementation of the sampling grid should be done in a GIS. After defining the grid, all grid coordinates should be computed and can be uploaded to GPS receivers for field work.
With unstratified sampling, the same sampling intensity (plots per area) and the same plot design is used for all different forest types in the total area of the sampling frame.
2.4.2 Stratified systematic sampling
Whenever suitable data are available that allows subdividing the total forest area in more homogeneous subpopulations (called strata), stratification of the population can increase the efficiency of inventories. Stratified sampling is efficient especially in those cases where the variability inside the strata is low and the differences of means between the strata are large. In this case a higher precision can be achieved with the same sample size. Beside statistical issues there are further practical arguments for stratification, like e.g. the organization of field work.
We can distinguish two general approaches for stratification, the so called pre-stratification in which strata are formed before the sampling study starts, and the post-stratification, where strata are distinguished in course of the sampling or even afterwards based on the data. In the first case the strata must be defined and - in case of geographical strata - delineated to define the sampling frame.
ÊÊÊÊ ÊÊ Ê ÊÊÊÊÊÊÊÊÊÊÊÊ Ê
ÊÊÊÊ ÊÊ Ê ÊÊÊÊÊÊÊÊÊÊÊÊ Ê Minimum standard for forest management inventories on KPH level 23Ê
Most efficient from a statistical point of view, is the stratification of a population proportional to the target value of the inventory. As this target value is typically not known before the inventory, forest variables that are correlated to this value are used as stratification criteria. In large managed forest areas age classes or forest types might be good stratification criteria if the estimation of volume per ha is targeted. The statistical estimation in stratified sampling derives an independent estimate for the single strata that is then combined to a weighted estimate of the total over all strata. The weighting factors applied are derived based on the stratum areas.
As stratified sampling assumes that the strata are independent sub-populations, it is possible to adapt the sample size (also sampling intensity) and the plot design to the respective stratum conditions. With this design it is therefore possible, to adapt the plot design to the actual conditions of a specific forest type. Further, it is possible to adapt the sampling intensity to the actual information need.
As it cannot be expected that profound remote sensing analysis capacity is available in each single KPH, remote sensing based stratification criteria should build on simple approaches or even better use readily available information that does not require any additional computing or analysis. Therefore, simple indicators, like e.g. the spatial distribution of NDVI (Normalized Difference Vegetation Index) can be used to differentiate the total forest area into strata of more homogeneous expected volume or biomass. The NDVI is, to a certain extent, related to the amount of green vegetation and therefore also to volume, biomass and carbon stocks and biodiversity. Readily available multi temporal NDVI products based on Landsat imagery can be obtained freely, e.g. via the Google Earth Engine. Every KPH should be motivated to use these products and further data provided by LAPAN, IPSDH or other national and regional agencies for their own planning purposes. In case that higher resolution imagery is available, stratification can be done by delineating different forest types visually. For some KPHs high resolution imagery can be found in virtual globes, like Google Earth or Bing. If a separation of forest types is possible, the strata can be delineated and mapped.
2.4.3 Double sampling for stratification (two phase sampling)
24ÊÊÊÊ ÊÊ Ê ÊÊÊÊÊÊÊÊÊÊÊÊMinimum standard for forest management inventories on KPH levelÊ
criteria are used for stratification, like e.g. forest types, the actual area of strata is usually not known. In such cases, double sampling for stratification (DSS) is an efficient approach. This technique is a two phase sampling approach, in which a relatively large first phase sample is taken. In this first phase sample, easy to observe variables are used to classify a high number of points into different strata. In practice it is implemented by a relatively dense sampling grid over the expected forest areas. All points in this grid are observed in remote sensing imagery with sufficient resolution. The data used in this first phase of sampling might differ between KPHs. In some areas virtual globes like Google earth or Microsoft bing already offer high resolution imagery that can be used as basis for visual interpretations. In other KPHs where free imagery is not available in sufficient resolution and actuality, high resolution satellite imagery provided by LAPAN (e.g. Spot data) or medium resolution like Landsat might be used. Each point is classified according to the stratification criterion, e.g. forest type or crown density in high resolution imagery or NDVI or texture indices from Landsat imagery (in the second case visual interpretation is not possible or necessary). This first phase sample already allows estimating the total area of strata. In the second phase of sampling, a subset of all points per stratum is selected randomly for field measurements. The size of this second phase sample should be calculated based on the required sample size that is necessary to meet a defined precision level. Therefore, preliminary information about the variability of target variables from the different strata must be available.
In order to reduce the number of points that need to be classified in the first phase of sampling, remote sensing can be integrated in a half automatic way. If wall to wall satellite imagery is available (e.g. Landsat) or the NDVI product derived from it, all points below a defined threshold that are expected to be non-forest with a high probability, can be excluded from further classification. Then, only the remaining points that have a high probability to be forest needs to be interpreted visually. In contrast to stratified sampling that is usually based on spatially coherent strata, DSS might lead to spatially incoherent strata as each point is classified individually.
ÊÊÊÊ ÊÊ Ê ÊÊÊÊÊÊÊÊÊÊÊÊ Ê
ÊÊÊÊ ÊÊ Ê ÊÊÊÊÊÊÊÊÊÊÊÊ Ê Minimum standard for forest management inventories on KPH level 25Ê 2.4.4 Using available prior information
All existing prior information on the actual forest areas should be utilized during the choice of a design alternative and the further planning of inventories. Useful information are (actual) maps (geo-data) of the forest areas, but also estimates derived from prior inventories in these areas. In case of existing geo-data (shape files of boundaries, …) the quality should be checked before. To derive information about the expected variability of different target variables (e.g. basal area, diameter distribution, number of tree species, …) inside the different forest types, it might be useful to analyze plots of the NFI from these forest types or to ask the central agencies for respective results. It might be necessary to include also regional plots from neighboring KPHs. Analyzing the NFI plots, however, should not be based on a whole cluster plot. The NFI cluster plots are much larger than efficient inventory plots of a forest management inventory and therefore estimates from these plots would show a much smaller variability as can be expected on the KPH level. It would be an option to analyze single sub-plots from each NFI cluster to get a more reliable estimate of the target variables and their variability.
In case that no prior information about the target variables in different forest types or strata is available, it is recommended to plan for pilot inventories. These inventories can be integrated in the pilot phase of the management inventories.
2.4.5 Determination of required sample size
The sample size is the number of samples (plots)selected in a defined area based on a certain sampling design. The determination of sample size is an important requirement in forest inventory as it directly affects the costs of the sampling exercise as well as the confidence interval for the derived estimations. It is important to note, that the sample size is an absolute value (it refers to the number of samples) while the sampling intensity is a relative value. Sampling intensity refers to the proportion of the area that was observed. Sampling intensity has no direct influence on the precision of estimates and is not helpful during the planning of inventories. For example: the same sampling intensity of, let’s say 2%, could be achieved with some very big plots, or many smaller plots. The latter solution will be much more precise, because the sample size is larger.
26ÊÊÊÊ ÊÊ Ê ÊÊÊÊÊÊÊÊÊÊÊÊMinimum standard for forest management inventories on KPH levelÊ
The sampling and plot design can only be optimized towards one single target variable. In many cases the basal area per hectare is selected as key variable for this optimization, as it is closely related to volume and biomass. However, a sampling study optimized towards basal area estimates might not deliver the best results for other target variables, like e.g. the number of tree species (biodiversity) at the same time.
2. What is the required precision of information that is targeted?
Sample size can only be calculated (on statistical criteria) if a target precision for the estimate is determined before. The required sample size to meet this precision requirement can then be estimated based on information of the expected variability of the target variable. If one defines the desired width of the confidence interval to be and the desired error probability to be , then one can calculate the sample size which is required to reach that precision (this holds for simple random sampling only!):
,
2 2
, 2
y
A t
s
s
t s
A t
n
A
n
Where is the value from the student-t distribution (for a given -error) and is the variance of the target variable estimated from prior data or a pilot study.
However, in practice it is more usual that the available resources in terms of time and budget are restricted and by that determining the maximum number of field plots that can be visited. In this case the sample size is limited by other arguments and the aim is to get the best possible precision with the available resources.
For the time being, the limited capacity for the implementation of inventories on the KPH level will rather follow the second option. Therefore, information on the average required time for the measurement of one plot is helpful and allows calculating how many plots can realistically be implemented in total with the given resources. The precision of estimates can then only be influenced by the plot and estimation design.
ÊÊÊÊ ÊÊ Ê ÊÊÊÊÊÊÊÊÊÊÊÊ Ê
1. stratum size Nh: the larger the stratum the more samples are allocated to it;
2. the variance 2
h
within the strata: the more homogeneous a stratum is, the less
samples will be taken; and
3. Cost kh : the higher the cost per sample plot, the less samples will be allocated in a
stratum.
The respective allocation strategies are called proportional allocation, Neyman allocation and optimal allocation (For the notation used please refer to the chapter estimation design!).
The required total sample size can be calculated by: 12 2 2
2.4.6 Calculation of grid width
Once the required sample size is estimated based on precision requirements or determined by available resources, the width dof a quadratic grid can be calculated as:
√
28ÊÊÊÊ ÊÊ Ê ÊÊÊÊÊÊÊÊÊÊÊÊMinimum standard for forest management inventories on KPH levelÊ
In case that double sampling for stratification is applied, the grid with is already defined in the first phase of sampling (independent of the above calculations) and the second phase samples are selected as random subset of the first phase. The sample size in the first phase (and the resulting grid width) is here planned on other criteria: the sample should be possibly large and is only limited by the available resources for the visual interpretation of points. In practical terms a dense grid of 500x500m over all forest areas, or even denser, should be targeted. This might lead to some thousands of points (depending on the area size) that need to be interpreted. However, this desktop work is relatively cheap compared to field assessments and can usually be accomplished within reasonable time. Technical solutions to facilitate this are available and should be used. One option in this context is provided with the open source toolbox Open Foris by FAO. The Open Foris Earth collect is a tool that is especially designed for such kind of two phase sampling approaches and is easy to use and to configure for special needs.
2.4.7 Non-Response
In statistical sampling, non-response refers to those locations that cannot be observed because of special reasons. It might be that sample points fall in extremely steep slopes and cannot be reached or they are on private properties. In such cases the points should be marked (on the field form) as non-response. Points falling on an area without trees inside the forest are not defined as non-response. They yield valid observations even if they are 0 in this case! A predefined sampling location should not be shifted to another place in any case! Non response might also occur in remote sensing imagery, for example because of cloud cover or haze.
2.5 Plot design
“Plot design” refers to the “approach and actions” taken regarding observations once a sample point has been reached. “Plot design”, therefore, refers to the rules how sample trees are included around the sample point and to the measurement prescriptions for the variables to be observed.
The basic guiding principles for plot design definition in FMIs - including Indonesia- are as follows:
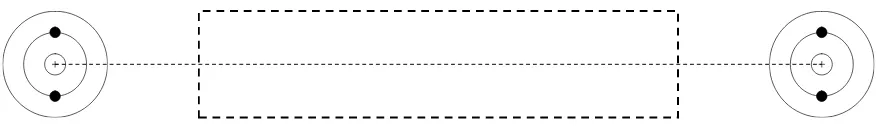
1. The plot design shall allow making observations of all variables that were identified necessary either as directly relevant variables or as indicator variables to establish complex variables. Commonly in FMIs, nested circular sample plots are established.
Ê
ÊÊÊÊ ÊÊ Ê ÊÊÊÊÊÊÊÊÊÊÊÊ Ê Ê ÊÊÊÊ ÊÊ Ê ÊÊÊÊÊÊÊÊÊÊÊÊ Ê Minimum standard for forest management inventories on KPH level 29Ê
2. Regarding recording of sample trees, it is recommended that per sample plot (or sub-plot) there should be 15-20 trees observed. This has been mentioned as a guideline for an efficient definition of a plot size.
3. The plot design shall make provisions that as much variability as possible is captured per plot. This is frequently not well understood and confused with the explicit goal in experimental design to have homogeneous plots: inventories are not experimental but observational studies and highest precision is, in fact, achieved if one captures as much variability per plot as possible. As a consequence that means that variability between plots is kept low and this leads to a higher precision of estimation. Plot design optimization is a typical research issue and can best investigated when inventory data are collected in such way that the questions can be worked on and analyzed. It can be an important aspect of pilot inventories to systematically improve the corresponding information base and to make one step further in finding an appropriate plot design for the different KPHs or forest types in Indonesia.
4. The implementation of the plot design shall be logistically, financially and technically feasible within the resources and capacities available and the overall conditions given. Depending on the grid size and the available road infrastructure, the movement from one sample plot to the next will either be on foot or by car. In any case, walking times will be often long; and careful planning is required to minimize the “unproductive” walking time when no inventory measurements are taken.
In regard to the plot- (or observation-) design that is implemented at each sampling location, a minimum standard for whole Indonesia can only suggest basic design aspects. Considering the many very different forest types, various topographies, different information needs and management targets of KPHs, it will be necessary to adapt a basic plot design to local conditions in order to make it more efficient for the respective target variable. Forest types in Indonesia are highly variable, ranging from mangrove forests over lowland rainforest, peatswamp forest, to many other forest types. It cannot be expected that one single fixed design will be efficient for all these different conditions.
30ÊÊÊÊ ÊÊ Ê ÊÊÊÊÊÊÊÊÊÊÊÊMinimum standard for forest management inventories on KPH levelÊ
However, whenever possible the basic diameter thresholds, like e.g. the minimum diameter of included trees, should be similar and comparable between KPHs. In the following the proposed basic plot designs are presented.
In context of management inventories that have the goal to describe the actual state of resources but also their change over time, the plots should be planned as permanent plots. This means, the plot locations (a base grid) are fixed and exactly the same plots are measured during the next cycle of the inventory. The repetition cycle (temporal intervals) of inventories depends very much on the expected changes. A re-measurement of sample plots should not be done after very short intervals. Usually the changes in diameter and height of trees are hardly “detectible” after time intervals less than 5 years. This is because the measurement errors are exceeding the actual increment and no statistically significant change could be found. The repetition cycle is also limited by the restricted personnel capacity in each KPH and should therefore not be shorter than 5 years. This, however, refers to the plot measurements only. As basis for yearly management plans, it might be necessary to carry out surveys of the area also in shorter intervals.
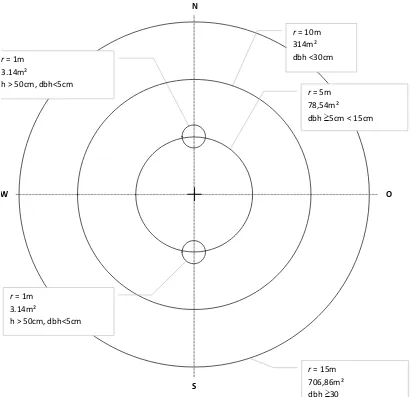
2.5.1 Nested fixed area sample plots
In natural forests but also in degraded secondary forests the density of small trees is usually much higher than that of big trees. A single plot would therefore include a high number of smaller trees and only few big trees. Therefore, nested plot designs where trees of different diameter classes are assessed on plots with different radius are usually more efficient from a statistical point of view, at least if the target variable is volume, biomass or carbon (its lesser clear if the target variable is “biodiversity” with the number of species being the indicator).