Bedugul Green Fresh Mart
A Project Feasibility Study Presented to
The Faculty of School of Business
SAINT MARY’S UNIVERSITY
Bayombong, Nueva Vizcaya, Philippines
In Partial Fulfillment Of the Requirement for the Degree
Bachelor of Science in Entrepreneurial Management
By:
Umi Nur Cholifah (405059) Sri Weni (405060)
i
Chapter 1. The Executive Summary ... 1
1.1. Visions ... 1
1.2. Missions ... 1
1.3. Objectives ... 1
1.4. Goals ... 1
1.5. Higlights ... 2
1.5.1. Project Background ... 2
1.5.2. Management and Personnal Feasibility Summary ... 2
1.5.3. Marketing Feasibility Summary ... 2
1.5.4. Production Feasibility Summary ... 3
1.5.5. Financing Feasibility Summary ... 3
1.5.6. Social and Economic Feasibility Summary ... 3
1.5.7. Project Implementation and Time Table ... 4
1.5.8. Conclusion to Feasibility ... 4
Chapter 2. Project Background ... 5
2.1. Project Proponents ... 5
2.2. Proposed Name of the Business ... 5
2.3.Type of Business Organization ... 6
2.4. Location of the Storehouse... 6
Chapter 3. Management and Personnal Feasibility Summary ... 8
3.1. Personnel (Administrative) ... 8
3.2. Proposed Salary of Personnel……….9
ii
Chapter 4. Marketing Feasibility... 12
4.1. General Market Description. ... 12
4.1.1. Target Market. ... 12
4.1.2. Demograpic. ... 12
4.1.3. Psychological and Socio Cultural. ... 12
4.1.4. Learning Involvment ... 13
4.1.5. Geograpic. ... 14
4.2. Demand. ... 16
4.2.1. Population. ... 16
4.2.2. Demand. ... 17
4.2.3. Project Demand ... 17
4.3. Demand Supply Analysis and Market Potential ... 18
4.4. Market Share... 18
4.5. Projected Sales………19 4.6. SWOT Analysis ... 20
4.6.1. SWOT Matrix ... 20
4.6.2. Questionnaire Design ... 21
4.6.3. Questionnaire Matrix ... 22
4.6.4. Result of SWOT Data Processing ... 23
4.6.5. SWOT Position ... 24
4.6.6. Internal External Factor Evaluation ... 25
4.7. Proposed Marketing Strategy ... 26
4.7.1. General Strategy………...26
4.7.1.1. Competitive Positioning ... 27
4.7.1.2. Brand Positioning ... 29
4.7.2. Pricing Strategy ... 30
4.7.2.1. Distribution Channels ... 30
4.7.2.2. Customer Relationship Management (CRM)... 31
4.7.3. Promotion Strategy ... 32
4.7.4. Place Selection Strategy ... 35
Chapter 5. Production Feasibility ... 36
iii
5.1.1. Product Categories ... 36
5.1.2. Logo of Product ... 40
5.1.3. Product Fiture ... 41
5.1.4. Product Benefit... 41
5.2. Packaging Process Description ... 42
5.3. Juice Row Vegetable ... 47
5.4. Machine and Equipment ... 49
5.5. Project Location ... 52
5.6. Project Layout... 52
Chapter 6. Financial Feasibility ... 54
6.1. Capital ... 54
6.2. Capital and Loan ... 54
6.3. Contribution ... 55
6.4. Machine and Equipment ... 55
6.5. Materials ... 56
6.6. Labor Salary ... 56
6.6.1. Direct Labor Salary ... 56
6.6.2. Indirect Labor Salary... 56
6.7. Depretiation ... 57
6.7.1. Office Depretiation... 57
6.7.2. Factory Depretiation... 57
6.8. Projected Sales ... 58
6.9. Amortization ... 58
6.10. Operating Expenses ... 58
6.10.1. Factory Overhead ... 59
6.11. Pre Operation Expenses ... 59
6.12. Cash Flow for Pre Operating Expenses ... 59
6.13. Cost of Good Sold ... 60
6.14. Project Income Statement ... 61
6.15. Cash Flows ... 63
6.16. Break Event Point ... 64
iv
6.16.2. BEP-Unit Each Product... 64
6.17. Balance Sheet ... 65
6.18. Pay Back Period... 65
6.19. Internal Rate of Return ... 66
6.20. Net Present Value ... 66
6.21. Current Ratio ... 67
6.22. Quick Ratio ... 68
6.23. Cash Ratio... 69
6.24. Interest Coverage Ratio ... 69
6.25. Inventory Turnover ... 70
6.26. Gross Profit Margin ... 70
6.27. Net Profit Margin... 71
6.28. Return on Investment... 71
6.29. Return on Equity (ROE) ... 72
6.30. Benefit Cost Ratio ... 72
Chapter 7. Socio Economy Feasibility ... 74
7.1. Project Empleyees ... 74
7.2. The Government ... 76
7.3. Other Beneficiary ... 76
Chapter 8. Project Implementation and Time Table ... 77
8.1. Time Table ... 77
8.2. Budgeting and Costing ... 78
8.3. Assignment of Activities ... 79
Chapter 9. Conclusion ... 80
References ... 82
Supplements ... 83
v
LIST OF TABLE
Table 2.1. Project Proponents ... 5
Table 3.1. Job Description ... 8
Table 3.2. Personnel Plan Salary ... 10
Table 4.1. Demographic Profile ... 12
Table 4.2. Psychological and Socio Cultural ... 13
Table 4.3. Bali’s Cities/Municipalities Population by District ... 16
Table 4.4. Population of Bali ... 16
Table 4.5. Demand of the Product ... 17
Table 4.6. Increasing Percentage ... 17
Table 4.7. Projected Demand ... 18
Table 4.8. Market Potential ... 18
Table 4.9. Market Share ... 19
Table 4.10. Projected Sales ... 19
Table 4.11. Questionnaire Matrix ... 22
Table 4.12. Result of Data Processing ... 23
Table 4.13. Internal and External Factor Evaluation ... 25
Table 4.14. Competitor Analysis ... 28
Table 4.15. Brand Positioning ... 29
Table 6.6.1. Direct Labor Salary ... 56
Table 6.6.2. Indirect Labor Salary... 56
Table 6.7.1. Office Depreciation ... 57
Table 6.7.2. Factory Depreciation ... 57
Table 6.8. Projected Sales ... 58
vi
Table 6.10. Operating Expenses ... 58
Table 6.10.1. Factory Overhead ... 59
Table 6.11. Pre Operating Expenses ... 59
Table 6.12. Cash Flow for Pre Operating Expenses ... 59
Table 6.13. Cost of Goods Sold ... 60
Table 6.14. Projected Income Statement ... 61
Table 6.15. Cash Flow ... 63
Table 6.16. Break Event Point ... 64
Table 6.16.1. Percentage Projection of Sales ... 64
Table 6.16.2. BEP - unit each product ... 64
Table 6.17. Balance Sheet ... 65
Table 6.18. Pay Back Period ... 66
Table 6.19. Internal Rate of Return ... 66
Table 6.20.1. Net Present Value ... 66
Table 6.20.2. Profitability Index/Benefit Cost Ratio ... 67
Table 8.1. Time Table ... 77
Table 8.2. Budgeting and Cost ... 78
vii
LIST OF FIGURE
Figure 2.1. Proportion Share ... 5
Figure 2.2. Location of the Storehouse... 7
Figure 3.1. Linier Type Organization ... 8
Figure 4.1. SWOT Matrix ... 20
Figure 4.2. SWOT Analysis Quadrant ... 24
Figure 4.3. Planning Phase Strategy ... 26
Figure 4.4. SWOT Analysis of Main Competitors ... 28
Figure 4.5. Competitive Advantage ... 28
Figure 4.6. Brand Positioning Chart ... 29
Figure 4.7. Distribution Flow ... 31
Figure 4.8. Distribution Channels ... 31
Figure 4.9. Promotion Strategy ... 33
Figure 4.10. Promotion Strategy ... 33
Figure 4.11. Promotion Strategy ... 34
Figure 5.1. Product Categories ... 40
Figure 5.2. Logo of Product ... 40
Figure 5.10. Machine and Equipment ... 51
Figure 5.11. Project Location ... 52
Figure 5.12. Project Layout ... 53
Figure 6.1. Chart of Capital and Loan ... 54
Figure 6.2. Net Profit Chart ... 62
viii
APPROVAL SHEET
In Partial Fulfillment of the Requirements for the Course
BACHELOR OF SCIENCE IN ENTREPRENEURIAL MANAGEMENT
This Study entitled : BEDUGUL GREEN FRESH MART
Has been submitted by : UMI NUR CHOLIFAH (Student Number : 405059)
SRI WENI
(Student Number : 405060)
Project study / paper has been accepted in partial fulfillment of the requirements for the degree of
BACHELOR OF SCIENCE IN ENTREPRENEURIAL MANAGEMENT
And which Grade for the study is:______ (ACCEPTABLE FOR COMPLIANCE)
Given this 14th day of February, 2016
DR. Angel T. Ramos, BSc, CPA, MBA
Course Operator
Ir. Fajar Kurniawan, MSc, RQP
ix
Preface
x
Introduction
Not a few companies engaged in supplier in Bali at the moment and we will be part of them. We dare to compete with them in a healthy way, as we will present a fresh vegetables product, guaranteed hygiene and health. Our products are very different from common vegetable in encounter in traditional markets and supermarkets in Bali.
xi
Acknowledgement
We would like to extend our deepest gratitude and sincere appreciation to the following individuals who helped this plan possible.
To Saint Mary’s University for offering continuing education and being an instrument in opening another door an opportunity of becoming an entrepreneur.
To DR. Angel T. Ramos. MBA, BSc, CPA, D, Ed for given us a chance to have a better future.
To Ir. Fajar Kurniawan, M.Si, RQP – GB for the guidance in understanding of Business Implementation.
Thanks also to the head of the Central Bureau of Bali Province Statistic Mr. Panusunan Siregar. And also the head of the Central Bureau of Bali Province Statistic of Social Mr. Indra Susilo which has helped us in meeting the data that we need incompleting our project.
Not to forget, to thanks to Ms. Joyce Lee, Ms. Jayadinata Linda, and Mr. Au Hin. as the parties who play an important role in the survival of our learning so that we can complete our education up to graduation.
To farmers in the area of Bedugul we say thanks very much for the
willingness to cooperate with us.
1
Raised the value of selling local farm produce International.
Being a major supplier of vegetables to Denpasar area, Kuta, and Nusa Dua.
1.2. Missions
Strive to increase the quality of service and production to match the high standards that can fulfill consumer demand.
Continually improve guidance to customers in order as business partner.
And expanding network of infinite market.
1.3. Objectives
Management based on the principles of efficient and effective, so as top and a high income to develop the business and improve the welfare of employees.
Improve the quality of human resources in accordance with the culture and the culture of the company, so it can deliver a high work ethic and sense of creative.
1.4. Goals
Government programs to help create a healthy society by providing fresh vegetables and hygienic.
Provide our customers with high quality product and excellent service at the reasonable price.
2
1.5. Highlights
1.5.1. Project Background
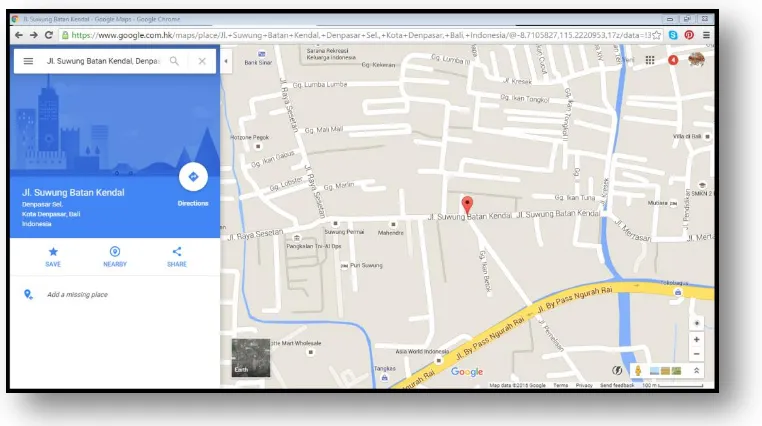
We choose supplier vegetable under the name “ Bedugul Green Fresh Mart “ in the background as the background by our growing children and was raised by parents and neighborhood farmers. The meaning of this name is supplied we started this business from Bedugul area as the largest vegetables product in Bali which become the main supplier of vegetables at the same time supporting us. The Green fresh Mart has the intention that we are the supplier of fresh vegetables. Our project will be located at Bay Pass Ngurah Rai Street, Sumbatan Kendal No.18X Denpasar. Where the location is very strategic to be close to the main target of our marketing namely Denpasar, Kuta and Nusa Dua. So that we can facilitate the delivery of our product to our customers in a very quick time.
1.5.2. Management and Personal Feasibility Summary
At the company's management system, we apply the Six Sigma system in which we will apply the DMAIC (Define, Measure, Analyze, Improve, Control) and as a means of support in running our business. ( Eckes George. The Six Sigma: How to Process product Into Profis, United States of America: John Wiley & Sons, inc. 2001).
As for the running systems to our Six Sigma for the three major groups in which each held and accounted by our members. In the division of this task; Sri Weni responsible for the Define and Measure system, Umi Nur Cholifah responsible for system Analyze and Improve, and Sri Weni responsible for control systems and equipment. This division of labor is more based on skill and ability of each of us in the field who have specified above.
1.5.3. Marketing Feasibility Summary
3 1.5.4. Production Feasibility Summary
Vegetable product which we seek is the result of a local farm where the farmer is still relatively little use of modern methods. However behind these limitations make vegetable farmers who produced has advantages compared to other local farmers. The advantage of our products is to be the sole supplier of organic vegetables.
In our cooperative relationships with the farmers, we will establish mutually support each other. At the beginning we started our business, is still not fully become advocates of the farmers, but with the passage of our efforts will be a major supporter of local farmers to become the largest producer of organic products in the area of Bedugul. By recycling existing vegetable waste, we will make as organic fertilizer and we will sell back only to the farmers at a price which is very cheap, thus the cooperation relationship between our farmers can work well because it is mutually beneficial.
1.5.5. Financing and Financial Feasibility Summary
In starting this business we support with initial capital of IDR 450,000,000.00 Which IDR 300,000,000.00 was contributed by both of us, and IDR 150,000,000.00 from the Bank Loan as for the ownership of capital we have a large number of different figures that Umi Nur Cholifah has IDR 160,000,000.00 or 53% of the contribution or share of capital, and IDR 140,000,000.00 or 47% as Sri Weni of contribution or Share of capital, resulting in a distribution of profits will be divided in proportion to each of us.
In the first planning our business we will receive gross income approximately IDR 454,416,000.00 or 110% of the proceeds will we get. So in the first year we have received 10% of net profit.
1.5.6. Social and Economic Feasibility Summary
Our business plan will be developed at this time we also have to consider the social and economic impacts for both company employees and community around the company, with the concept (Corporate Social Responsibility Wikipedia.co.id)
4
and the environment in all aspects of company operations that include social, economic and environment, so as to achieve the creation of sustainable development for our company.
1.5.7. Project Implementation and Time Table
To start this project, were quire five months of preparation. From finding the location, lobbying farmers and preparation of documents we need to support our feasibility until ready to make an agreement with our customers.
1.5.8. Conclusion to Feasibility
5
Chapter 2
Project Background
2.1. Project Proponents
Supporters of capital funding in the start of our business is the both of us. Which we areas owners of capital, also in charge of the future courses of our business. In detail can be seen in Table 2.1.
Table 2.1. Project Proponents
Name Nationality Address % ownership
Umi Nur Cholifah Indonesia East Java 53%
Sri Weni Indonesia East Java 47%
As shown in the above table in the main supporting our Project Plan is Umi Nur Cholifah who have the 53% stake in the company, and 47% of Sri Weni have the company's assets. In the implementation and sharing of the results of operations will be in proportion to the capital which has contributed to the company.
Figure 2.1. Proportion Share
2.2. Proposed Name of the Business
We are both of people involved in this business who have similar properties, namely simplicity. In the naming of our business, we deliberately
53% 47%
Proportion of Share
Umi Nur Cholifah
6
chose a simple name that is easy to remember especially our customers. “Bedugul Green Fresh Mart”. For the people familiar Bedugul, Bali 90% as the largest vegetable growing areas in Bali. In conjunction with our business, we deliberately made as a major name in the beginning because we stand in support of business by vegetable farmers from Bedugul area.
As for the "Green Fresh Mart" is an attempt to market fresh vegetables. We deliberately use the language of Britain is very easy to understand by the people of Bali which is basically 90% understand English, although not exactly the correct spelling. But in the language of the people of Bali are very familiar with the market sense of the word-for-word in English.
In addition we have a long-term goal for our business, which is our main target not only includes the people of Bali, but also to foreign tourists who have permission to stay in Bali or on business in Bali. With the name of "Bedugul Green Fresh Mart" we are sure will be a name that is easily embedded in the hearts of our customers will be, as it is very easy to remember.
2.3. Type of Business Organization
In business we use a type of business organization Functional Organization. Where this type of dross in accordance with our conditions in this type of business start with we believe can assist in starting and running a business we will, and we will transform functional into another type along with the development of our business in the future.
2.4. Location of the Storehouse
7
8
Chapter 3
Management and Personnel Feasibility
3.1. Personnel (Administrative)
Figure 3.1. Linier Type Organization
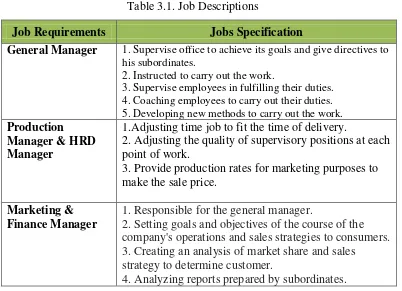
Table 3.1. Job Descriptions
Job Requirements Jobs Specification
General Manager 1. Supervise office to achieve its goals and give directives to his subordinates.
2. Instructed to carry out the work.
3. Supervise employees in fulfilling their duties. 4. Coaching employees to carry out their duties. 5. Developing new methods to carry out the work.
Production Manager & HRD Manager
1.Adjusting time job to fit the time of delivery.
2. Adjusting the quality of supervisory positions at each point of work.
3. Provide production rates for marketing purposes to make the sale price.
Marketing & Finance Manager
1. Responsible for the general manager.
2. Setting goals and objectives of the course of the company's operations and sales strategies to consumers. 3. Creating an analysis of market share and sales
strategy to determine customer.
4. Analyzing reports prepared by subordinates. General
9
5. Optimizing excellent service to every customer. 6. Responsible for the acquisition and use of funds from the sale promotion.
7. Fostering marketing and guiding all employees in the marketing department.
Head Production 1. Acquisition of funds at a low cost. 2. Uses of funds effectively and efficiently. 3. Analyzing financial statements.
4. Analyze internal and external environment associated with routine decisions and specially. Production
Planning Control
1. Helping to expedite production of receipt of the work order to complete the product.
2. Provide an explanation of each item to the order of production.
3. Follow up the development of the production gets every week.
Quality Control 1. Creating corporate standardization. 2. Checking the goods in detail.
3. Provide instruction to repeat the work as not in accordance with company quality standards.
Designer 1. Guy who would always express their creative ideas led to innovations in new and dynamic products. 2. Designers are required to always provide the latest ideas in accordance with the progress of time and technology.
Sales Selling, marketing, customer satisfaction and customer loyalty.
Expedition 1. Responsible for all items to be shipped and will return.
2. Provide reports to the entry and exit of goods marketing manager.
3.2. Proposed Salary of Personnel
General Manager is Umi Nur Cholifah, HRD & Production Manager is Sri Weni and Marketing & Finance Manager is Umi Nur Cholifah.
In addition to the three main positions within our company helped by several key positions to support part of the company’s work. Part of it are:
Head Production
Production Planning Control
Quality Control
Designer
10
Expedition
Worker
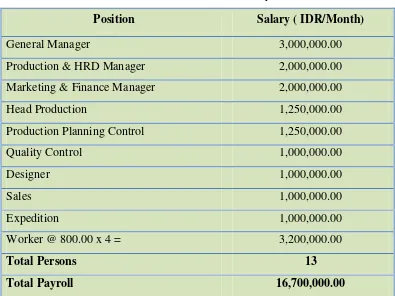
Table 3.2. Personnel Plan Salary
Position Salary ( IDR/Month)
General Manager 3,000,000.00
Production & HRD Manager 2,000,000.00
Marketing & Finance Manager 2,000,000.00
Head Production 1,250,000.00
Production Planning Control 1,250,000.00
Quality Control 1,000,000.00
If you want to build a strong brand companies should not just rely on ads. Companies should do something striking in the minds of consumers, not just selling but have long-term implications. (Marketing 3.0: From Mind to Heart to the Human Spirit; Philip Kotler, Hermawan Kartajaya, and Iwan Setiawan, John
Wiley & Sons, 2010).
11
12
Chapter 4
Marketing Feasibility
4.1. General Market Description 4.1.1. Target Market
By using the concept of marketing as the fulfillment of human needs which then turned into a desire, we are confident that our business community is very welcome. Because, basically meeting the needs of food is a basic requirement for the fulfillment of every human being. As for our marketing objectives are:
Hospital, Supermarket, Hotel , Restaurant & Canteen
By explaining in detail all of our activities regarding products, product design, promotional products, advertising products, communications to consumers through the delivery of products to consumers in order to quickly. We also hope to get to know and understand our products will be sold by its self.
4.1.2. Demograpic
Demographic over view of our efforts can be seen in the table below. Table 4.1. Demographic Profile
Demographic Criteria
Age 12 years and up
Gender Female and Male
Income Middle Income
Occupation All type of job
Lifestyle Creative, relaxed, innovative, fun,
active.
4.1.3.Psychological & Socio Cultural
13 be seen in the table below :
Table 4.2. Psychological and Socio cultural
Categories Criteria
Personality Open minded
Culture All type
Religion All Religions
Native Bali, Java, Lombok, and Foreign
Social Class Middle Class and above
Family Type Small, Middle, and Big Family
4.1.4. Learning Involvement
We are entrepreneurs vegetables are all organic agricultural products. Organic farming systems are systems that rely on agriculture natural ingredients without the use of synthetic chemicals. Some Indonesian plants that have the potential to be developed with these techniques are rice, horticulture, vegetables, fruits.
14
as lettuce, basil, cucumber etc. Other benefits of vegetables to human health among foster child's body, maintain healthy organs, increase endurance, accelerate blood circulation etc. Besides an excellent vegetable for a healthy diet.
4.1.5 Geographic
Bali is one of the provinces in Indonesia that known as Gods Island (Paradise Island). Bali lies between Java and Lombok Island. Capital of the province is Denpasar, located in the southern part of the island. Bali Island is part of the Lesser Sunda Island along the 153 km and 112 km wide, about 3, 2 km from the island of Java. Bali Province consists of a number of islands including Bali Island itself as the biggest island , Nusa Lembongan Island, Serangan Island ( located at the southern part of Bali Island ), and Menjangan Island ( located at the west side of Bali Island ).
Astronomically, Bali Province is located between 800 03ꞌ40ꞌꞌ - 800 50ꞌ 48ꞌꞌ south latitude and 1140 25ꞌ 53ꞌꞌ - 1150 42ꞌ40ꞌꞌeast longitude tropical climate which makes it like other regions in Indonesia. The boundaries of the following areas of Bali Province are : total area Indonesia archipelago. The governance of Bali Province is divided into regencies and one city, namely Jembrana, Tabanan, Badung, Gianyar, Klungkung, Bangli, Karangasem, Buleleng regencies and Denpasar City.
15
16
4.2. Demand
4.2.4. Population
Population of Bali shown in the Table 4.3.
Table 4.3. Bali’s Cities/ Municipalities population by District
Regency/City
Source: BPS-statistics of Bali Province (Result of Population Registration)
Table 4.4. Population of Bali
Source;denpasarkota.go.id(2014)
Year Population of Bali
2010 3,222,375
2011 3,312,831
2012 3,411,517
2013 4,056,323
17
Base on the population of the island at this time we can only meet about 644,475 of the total existing population or 20%of the total population of Bali 644,475. Demand of the product based on population of Bali shown in Table.4.5.
Table 4.5. Demand of the Product
Year Population of Bali Actual Demand
(20% X Population)
Using Arithmetic Methods, we can forecast increasing demand of product for the next 5 years. Increasing percentage shown in the table 4.6.
Table 4.6. Increasing Percentage
Year actual demand year to year Percentage
2010 644,475 18,091 2,81%
Our average increase/(decrease) will then be:
Increase/(decrease)average = (25.89 ÷ 5) X 100
18
We will choose the highest projected demand for next analysis. Demand in 2019 = 887,923
4.3. Demand Supply Analysis and Market Potential
Our business has competitor. According to BPS Bali, our competitor can
Yearly 887,923 - 345,600 = 542,323
Monthly 542,323 / 12 Month = 45,194
Daily 45,194 /30 Days = 1,507
Our Market Potential for Organic Vegetable product shown on Table 4.8. Projected Demand 542,323 unit per year, or 45,194 unit per month, or 1,507unit per day.
4.4. Market Share
19
Table 4.9. Market Share
Market Share
Yearly 542,323 x 6.68% = 36,227
Monthly 36,227 x 6.68% = 2,419
Daily 2,419 x 6.68% = 161
4.5. Projected Sales
Our projected sales are 161 kg daily for all list products. For details projected sales described in Table 4.10.
Table 4.10. Projected Sales
No Items Kg Price/kg
(IDR)
Daily (IDR)
Monthly (IDR)
Yearly (IDR)
1 BY 18 35 630 18,900 226,800
2 SW 28 36 1,008 30,240 362,880
3 KK 18 18 324 9,720 116,640
4 TM 10 35 350 10,500 126,000
5 SI 13 30 390 11,700 140,400
6 DS 18 32 576 17,280 207,360
7 PR 13 18 234 7,020 84,240
8 BK 18 18 324 9,720 116,640
9 BC 12 25 300 9,000 108,000
10 BE 13 18 234 7,020 84,240
20
4.6. SWOT Analysis 4.6.1. SWOT Matrix
SWOT Matrix shown in Figure 4.1.
Figure 4.1. SWOT Matrix
STRENGTH:
1. Organic vegetables have a sweeter taste compared to non-organic vegetables.
2. Organic vegetables have a higher sale value (more expensive) compared to non-organic. 3. Can be a source of food that is safe and nutritious as it contains no toxins to be able to improve public health.
4. Organic vegetables containing Vitamin C, Potassium, Beta Carotene and higher.
WEAKNESSES:
1. Organic vegetables look less attractive, such as smaller size and the leaves with holes.
2. Prices are quite expensive 3. Results products organic vegetables is lower than in conventional vegetables.
OPPORTUNITIES: 1. Has a very good prospect because it can support capital from foreign investors.
2. Eventually the whole world will drive the economy into the concept of the Green Economy as a concept that will support sustainable development. (
2. Constraint is the least fertile land area.
3. Products of high quality and has a market segment, the top layer of society.
4. Prices are set much higher than in conventional agricultural products.
21
4.6.2. Questionnaire Design
QUESTIONNAIRE
Name : _____________________ Signature:_____________________
Age : _____________________
Answer the entire question by thickening the chosen box.
Point 4: Very Agree (VA) Point 2: Acceptable (AC) Point 3: Agree (AG) Point 1: Disagree (DA)
Questions 1 2 3 4
Strength :
1. It has a sweeter taste.
2.Has a higher nutritional value compared to conventional vegetables.
3.It can be a food source that is safe for health. 4.Have a high selling price.
Weakness :
1. Physical appearance is less attractive organic vegetables (small holes)
2. more expensive price
3. Results of organic vegetable production is lower than conventional vegetables.
4. Not all people know the advantages of organic vegetables.
Opportunities :
1. It has very good prospects because little organic vegetable business
2. Having a sizeable market opportunity especial in Bali and the surrounding area.
3. likely to get capital support of foreign investors.
Threats :
1. Having segment middle to upper market economy.
2. in the set price is much higher than conventional vegetable products
22
4.6.3. Questionnaire Matrix
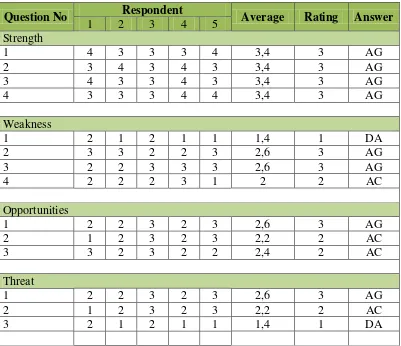
Questionnaire matrix describes in Table 4.11. Table 4.11. Questionnaire Matrix
Question No Respondent Average Rating Answer
1 2 3 4 5
Data collection techniques used in this study is: 1. Observations
2. Questionnaire 3. Interview 4. Study of library
23
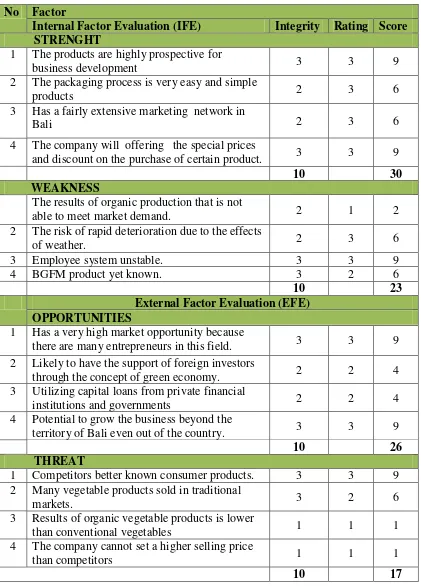
4.6.4. Result of SWOT Data Processing
Table 4.12. Result of Data Processing
No Factor
Internal Factor Evaluation (IFE) Integrity Rating Score STRENGHT
1 The products are highly prospective for
business development 3 3 9
2 The packaging process is very easy and simple
products 2 3 6
3 Has a fairly extensive marketing network in
Bali 2 3 6
4 The company will offering the special prices
and discount on the purchase of certain product. 3 3 9
10 30
WEAKNESS
The results of organic production that is not
able to meet market demand. 2 1 2
2 The risk of rapid deterioration due to the effects
of weather. 2 3 6
1 Has a very high market opportunity because
there are many entrepreneurs in this field. 3 3 9 2 Likely to have the support of foreign investors
through the concept of green economy. 2 2 4
3 Utilizing capital loans from private financial
institutions and governments 2 2 4
4 Potential to grow the business beyond the
territory of Bali even out of the country. 3 3 9
10 26
THREAT
1 Competitors better known consumer products. 3 3 9 2 Many vegetable products sold in traditional
markets. 3 2 6
3 Results of organic vegetable products is lower
than conventional vegetables 1 1 1
4 The company cannot set a higher selling price
than competitors 1 1 1
24
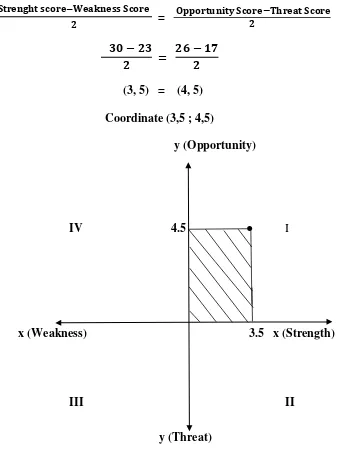
4.6.5. SWOT Position
SWOT Position shown in Figure 4.3.
=
(3, 5) = (4, 5)
Coordinate (3,5 ; 4,5)
y (Opportunity)
IV 4.5 ● I
x (Weakness) 3.5 x (Strength)
III II
y (Threat)
Figure 4.2. SWOT Analysis Quadrant
25
4.6.6. Internal External Factor Evaluation
Table 4.13. Internal and External Factor Evaluation
IFE
EFE
STRENGTH-S WEAKNESS-W
1. The products are highly prospective for business development.
2. The packaging process is very easy and simple products.
3. Has a fairly extensive marketing network in Bali.
4. The company would offering the special prices and discount on the purchase of certain product.
1. The results of organic
production that is not able to meet market demand.
2. The risk of rapid deterioration due to the effects of weather.
3. Employee system unstable.
4. BGFM product yet known.
OPPORTUNITY-O STRATEGY-SO STRATEGY-WO
1.Has a very high market opportunity because there are many entrepreneurs in this field.
2. Likely to have the support of foreign investors through the concept of green economy.
3. Utilizing capital loans from private financial institutions and governments.
4. Potential to grow the business beyond the territory of Bali even out of the country.
1. The products are highly prospective for business development.
2. The packaging process is very easy and simple products.
3. Has a fairly extensive marketing network in Bali.
4. The company would offering the special prices and discount on the purchase of certain product.
1. The results of organic
production that is not able to meet market demand.
2. The risk of rapid deterioration due to the effects of weather.
3. Employee system unstable.
4. BGFM products yet known.
THREAT-T STRATEGY-ST STRATEGY-WT
1. Competitors better known consumer products.
2. Many vegetable products sold in traditional markets.
3. Results of organic vegetable products is lower than conventional vegetables.
4. The company cannot set a higher selling price than competitors.
1. Will only circulate or market a product with attractive packaging and guaranteed fresh and hygienic.
2 The company will always put the quality of products to meet the wishes and demands of the customers as a whole.
3. The company will provide discounts to any customer who will buy in bulk.
4. Provide assurance products to maintain price stability in the market.
1. Improve training existing workforce.
2. Utilizing social media as an inexpensive means of promotion in addition to the installation of distribute brochures and products labels.
3. To maintain the quality of goods, BGFM will use a freight car that is equipped with a refrigerator a certain temperature.
26
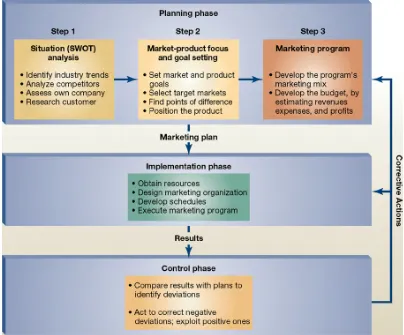
4.7. Proposed Marketing Strategy 4.7.1. General Strategy
One of the keys to tapping consumer marketplace is coming up with a product or service that addresses a specific consumer need. Finding and fulfilling costumer needs and then delivering suitable product or service are part of the marketing process. (Miranda Brookins, Demand Media 2014)
Source: Steps In The Marketing Process http://www-rohan.sdsu.edu
Figure 4.3. Planning Phase Strategy
27
Analyze:
We can identify the needs of its potential customers, and we have to take a looks at our resources and capabilities, which may include finding, time, human resource. Beyond that we have to take into account the type of competition in the market, and how technological, political, social, and economical happenings, may impact what customers want and our ability to environment we are working in.
Plan:
We plan how to pull our resources together to fulfill the need. This involves conducting market and marketing research, and creating examples of the products for testing. We can also use the planning stage to make decisions about how to price, promote, and distribute our product or service.
Implementation:
Using the distribution plan we create based on the target market we are trying to reach. Use the promotional plan we developed to help inform, persuade, and remind customers to our product or services exists.
Control:
The control portion of the marketing process involves coming up with ways to measure the tactics we decide to promote the product we are selling. This is including looking at profits, revenue, customers, satisfaction, the number of the views our website receives or the number of clicks an Email promotion we send to announce our product receives. If metrics indicate that a tactic we are using to promote the product is not working favorably, we can make changes, when access necessary, similarly, if feedback from customers shows that the product is not fulfilling a need. We have to revisit the planning phase.
4.7.1.1. Competitive Positioning
We will differentiate our offering and create value for our market, and carving out a spot in the competitive landscape, putting our stake in the ground and winning mindshare in the marketplace- being known for certain “ requirement”. Our Competitor shown below:
1. Rumah Fair Trade (RFT)
28 4. Wet Market (WM)
SWOT Analysis of Main Competitor (RFT, BOA, BROF and WM)
Strength Weakness
6. Many of cooperation network
1. Expensive 2. Location 3. Expedition 4. Service
5. Only seal at retail prices Figure 4.4. SWOT Analysis of Main Competitors
Table 4.14. Competitor Analysis
Attribute Weight Rating ( Scale=1-5; 1- Poor,
29
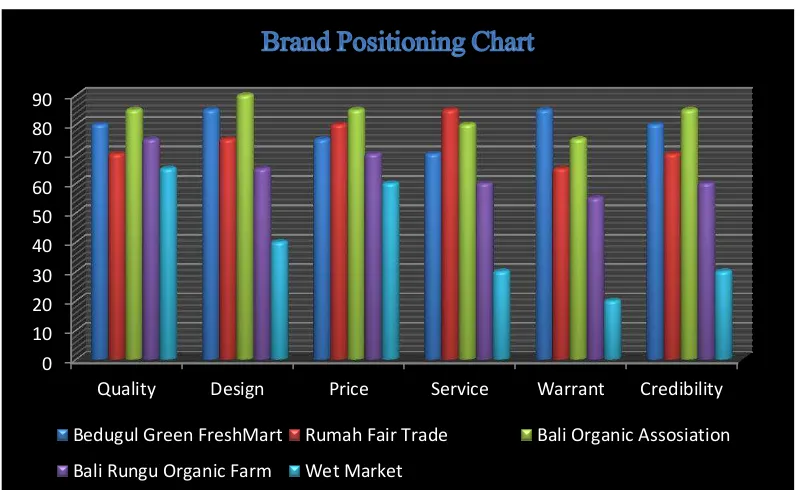
4.7.1.2. Brand Positioning
Our brand positioning are relevant to include relevant, differentiation, and credibility or attainability. Such as the customer could find our brand more appealing. Differentiation is means our brand would be an unique one. Credible and attainability is our final measure.
We will make our market recognizes our brand and know exactly what is our product. We will deliver a consistent experience that the market has come to expert, both visually and operationally at every quality, design, price service, warrant, and credibility.
Table 4.15. Brand Positioning
Quality Design Price Service Warrant Credibility
BGFM 80 85 75 70 85 80
RFT 70 75 80 85 65 70
BOA 85 90 85 80 75 85
BROF 75 65 70 60 55 60
WM 65 40 60 30 20 30
Figure 4.6. Brand Positioning Chart 0
Quality Design Price Service Warrant Credibility
Bedugul Green FreshMart Rumah Fair Trade Bali Organic Assosiation
30
Based on Brand Positioning Chart above, our brand position at the right level, our quality, design, and credibility almost equal to Bali Organic Association. Our Warrant is the superior than others, our Price is acceptable and our price and service is quilt good enough for.
4.7.2. Pricing Strategy
At the beginning of starting a business Bedugul Green Fresh Mart will use the strategy as a multi-unit pricing strategy since the beginning of Bedugul Green Fresh Mart cannot sell higher or equal to the selling price of competitors. We are confident with this strategy will be able to increase sales of our products so as to increase profits.
We believe the price is not the main thing in our develops the business, and we understand that consumer is very smart in choosing a quality product or not. Therefore we also will put the best service and fast delivery to all customers. Order to respond to the speed and how to package products is also an important factor in order for us to attract customers, so that at the right time we will be able to implement the strategy Competitive Pricing or equalize the price of a product based on the selling price of a competitor.
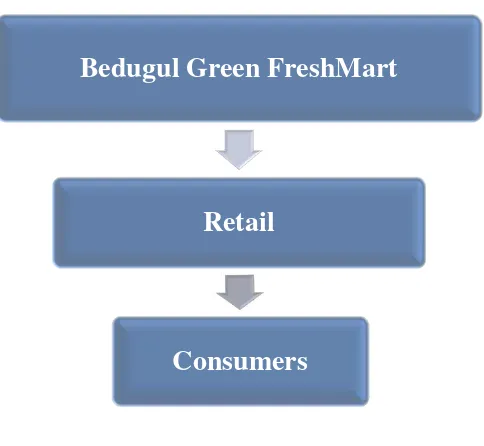
4.7.2.1. Distribution Channels
“Distribution Channels are institutions distributor or dealer institutions that have activities to distribute or deliver goods or services from producer to consumer.”Warren J. Keegan (2003) Global Marketing Management, 7th
edition. Distribution channel is a group of companies or individuals who have the right of ownership over the product or service when it is transferred from producers to consumers. Principle of Marketing (Philip Kotler 1991: 279)
We will utilize the product distribution activities as a means of gathering critical information about customers and competitors, to promote the products that we offer. It is also a means to negotiate, marketing products and also pay the bills.
31
Figure 4.7. Distribution Flow
Figure 4.8. Distribution Channels
4.7.2.2. Customer Relationship Management (CRM)
Important factor supporting the success of our company as one of them is CMR. Because we realize the dissatisfaction of a customer will tell 7-10 people friends, otherwise satisfied customers would recommend the company concerned to 3-4 of their friends. Therefore, we will prioritize the service as an important factor that we should consider. As the implementation of CMR strategy then we will choose those professionals who have sufficient quality that we expect will
Bedugul Green FreshMart
Retail
Consumers
•Carrefour Bali
•Makro Bali
Supermarket
•Surya Husada Hospital
•Balimed hospital
Hospital
•gateway of India Authentic Indian Food
•Harmony Vegetarian
•The Oberoi
Restaurant
•The Royal Beach Seminyak
•Devine Earth Bali
32
understand, as well dealing with customers and also understand how to use technology to CRM.
4.7.3. Promotion Strategy
Our company will use a mix of promotion strategy or marketing mix communication. With this strategy we believe will be able to promote our product the cost is not too high and can increase sales of the company's products.
The strategy that we will run is as follows
Personal Selling
Individual communications, or face to face in an effort to sell and create relationships.
Advertising
Advertising is a quick way to introduce our new products to the public, in this case a lot of media that we can take advantage of them Radio, TV, magazine and newspaper. But this medium requires a fairly high cost and less effective, so we will take advantage of existing social media networks in starting promote our business.
The social media are as follows:
Website: With this medium we will be able to provide much information about our products to consumers. Instead consumers will be able to learn and know the advantages and superiority of our products. We hope the website can minimize the cost of advertising.
33
Figure 4.9. Promotion Strategy
Facebook Page: Social media is very popular by people in the Americas, Asia and Europe is very suitable for promotion and we made a means of our sales process. In addition to free social media is also very easy and popular all societies. Visit our Face book Page at: www.facebook.com/BedugulGreenFreshMart
Figure 4.10. Promotion Strategy
34
through the interface website, Short Message service ( SMS ), or Through a variety of applications for mobile device.
We ensure that promoting by twitter could help our company to promoted our new product.
Follow us on http://twitter.com/BGFM1
Figure 4.11. Promotion Strategy
Instagram: One more thing that is also very popular with the people of Indonesia now is Instagram. We will utilize this medium as a means of free promotion of our products to the public by introducing new terms of our products, such as its terms we use other social networking. Visit us at: www.instagram/bedugulgreenfreshmart
E-Mail: Internet Mail is appropriate we use as a tool to introduce our products we can also use as a means of communication and negotiation with our customers in particular and can be more formal. E-mail also does not require high costs. Contact us at: [email protected]
Public Relation
35
products. For employees and customers, we will hold a tour and open house.
Sales Promotion
Sales promotion is a sales promotion incentive will be given in the near term to increase demand or sales of products. As for the sales promotion that we could give to our customers is voucher, Discounts, and free samples.
We hope to have strategy above will be able to obtain what we expect is to provide product information, to make a product that is different from the others, increase sales, sales stability as well as increase the value of our products in the future.
4.7.4. Place Selection Strategy
Bedugul Green Fresh Mart will be open at Jalan By Pass Ngurah Ray, Suwung Batan Kendal No. 18X, Denpasar, Bali, Indonesia.
36 with some healing disease with diet therapy, always prioritize organic food on the menu. Consuming organic foods proven to make people more healthy and fits, as free from chemicals and synthetic.
As for farmer themselves. WHO reported that each year there are three million victims of pesticide poisoning and approximately two hundred thousand people died because of it. Poisoning occurs because spraying is not using security syntax, exaggerated and incorrect placement of pesticides, thus contaminating food or water consumption in farm families.
In terms of the price of organic products are more expensive than conventional products. But how much it costs to be issued if they are sick, it is not comparable to the high cost of organic products they consume. Prices of organic products are also not comparable to the price of food supplement which sells to keep in shape.
37
phenomenon is supported by the emergence of organic products in the form of fresh (uncooked) and cooked (organic restaurants).
Here is our product feature that we will be marketed:
1. Spinach
In addition to high fiber, spinach is a good source of iron is very good (double other green vegetable juice) for blood health. In addition, spinach also contains Lutein which serves to maintain the health of your eyes and cataracts, as well as 13 types of chlorophyll and flavonoid components that can act as an antioxidant and anti-cancer. Spinach is also a rich source of vitamins in vitamin A, C, K, and folate.
2. Green cabbage
Mustard greens have a lot of vitamins and mineral, it is also known to have the ability of antioxidants as vitamin C and E, and carotenoids and glucosinolates. Mustard greens also contain calcium, magnesium, and folic acid which can help to nourish the bones, as well as high in fiber to help aid digestion in the human body. In addition, green cabbage can also prevent inflammation and to prevent types of cancer.
3. Kale
Kale that many in Indonesia was met at the food contains many nutrients such as vitamins A and C, although not as much as spinach and cassava leaves. The minerals found in kale include calcium, and potassium fosfar. Vitamin B complex on kale known to help increase the hormone that creates a comfortable atmosphere. In addition, extra kale also been found to help the inhibition of absorption of sugar so it is suitable for diabetics.pes of cancer.
4. Cucumber
38
5. Celery
Celery is the best source of Calcium, Iron, Potassium, and Vitamins A and C. In addition, celery also contains an Active Component of Coumarin and Acetylenics that could prevent the development of cancer cells.
6. Cassava Leaves
Vegetable that are served with various kinds of vegetables and main dishes typical of Indonesia this proved to be a very good source of nutrition. Young Cassava leaves contain protein and Iron. Cassava leaves protein also has a four-fold and two-four-fold vitamin A in spinach appeal, making it a good source of vitamins and minerals that are good for the health of the human body.
7. Bitter Cucumber
Bitter Cucumber or better known as Pare contains high fiber, which is very good for the health of the human body. In addition it also contains a lot of calcium, potassium, iron, and Vitamins C and A. The benefits of bitter melon are numerous, ranging from lowering cholesterol, and high blood pressure. Active components (saponins) may also increase the body's immunity and prevent the growth of cancer cells.
8. Broccoli
Italian native plants is a source of Vitamin C which is very good. Not only rich in fiber, vitamins and minerals, broccoli also contains antioxidants and lutein sulforaphanic good for reducing cancer risk. Broccoli is also known to be beneficial for heart health.
9. Bok Choy
This plant is often called "Spoons Soups" because of the shape of its leaves are similar to a soup spoon. Vegetables are classified as types of cabbage are rich in vitamins A, C, D, and folate. Not only that, Bok Choi is also rich in potassium which is very good for fluid balance and cardiovascular health. Another health benefit is Glucosinolates content as an antioxidant that can prevent prostate and breast cancer.
10.Beans
39
40
Figure 5.1. Product Categories
5.1.2. Logo of Product
We designed a logo as a way to facilitate the consumers to get to know our company and products.
Philosophy contained in our logo is as follows
:
BGFM stands Bedugul Green Fresh Mart.
The green color of leaves symbolize of health and freshness of vegetables. And the house is in the middle symbolizes a place of business.
So it can be concluded that BGFM is a business engaged in the field of fresh vegetables which aims to meet the needs of the community.
41
5.1.3. Product Feature
Feature of our product can be seen in the Table below. Table 5.1. Product Feature period expire is 10 days after the vegetable is packaging.
5.1.4.
Product Benefit
We conduct research on the nutrients contained in the organic vegetables. With a healthy diet and making organic vegetables as the main diet every day we believe may reduce the number of cancer patients in the population of Indonesia, especially in Bali. Here are the advantages and benefits of organic products :
Organic produce contains fewer pesticides
Pesticides are chemicals such as fungicides, herbicides, and insecticides remain on (and in) the food we eat.
Organic food is often fresher
42
Organic farming is better for the environment
Organic farming practices reduce pollution (air, water, soil) conserve, increase soil fertility, and use less energy. Farming without pesticides is also better for nearby birds and small animals as well as the people who harvest our food.
Organically raised animals are not given antibiotics, growth harmonic, or fed animal by products
The use of antibiotics in conventional meat production helps create antibiotic-resistant strains of bacteria. This means that when someone gets sick from these strains they will be less responsive to antibiotic treatment. Not feeding animal by products to other animals are given more space to move around and access to the outdoors, both of which help to keep the animals healthy. The more crowded the conditions, the more likely an animal is to get sick. (Authors: Maya W. Paul, Gina Kemp, M.A.& Robert Segal, M.A May 2014).
5.2. Packaging Process Description
Packing is one of division in the BGFM, the vegetable post-harvest handling activities to them put into a product according to the criteria customers expect. The stage are carried out in the packing includes receiving, cleaning, storage, and packing. Activity within this packing lasts for 24 hours.
Acceptance
43
delivered of land to packaging. If the suppliers come alone, then it is obligatory for them to witness the activities of sorting, so that no injured party and if there are damages that occur so that repairs can be done at the time of handling post-harvest vegetables.
Figure 5.3. During Harvest
44
Cleaning
Trimming is one process that is performed in packaging after receipt and sorting. Vegetable that have been sorted for further cleaned of dirt, as well as the disposal is done in certain part of the vegetable shape foliage leaf crops by removing by outermost layer (the type of cabbage, spinach, etc). Usually leaves trimming criteria is 2-3 outer leaves, the leave are hollow (farmer pests and diseases), as well as the leaves are damaged by a mechanical foul during the post- harvest.
Figure 5.5. Cleaning Process
Storage
45
46
Packing
In degree or unboxed is vegetable that is sold in packaged from without. For delivery by truck BGFM creates placed on the box to use the freight shipping companies, vegetables inserted in cardboard boxes that was given the ice for cooling packaged and plastic film wrapped using vegetable, wrapped using a material called plastic film. The usefulness of this is packaged in the form of: The display will looks clean and luxurious, reduce excessive evaporation to extend shelf life, protect vegetable from the touch o cross contamination. Wrapped using plastic film and vegetable laid or laid regularly over later wrapped in plastic film. The usefulness of this is packaged in the display will appear more clean, luxurious, reduce excessive evaporation to extend shelf life, protect vegetables from cross contamination, protect vegetables from physical damage by pressure. Wrapped using plastic bags vegetable put into a plastic bag of the type of PP or PE plastic there are also types. Plastic bags are hold in some parts of the surface for air circulation. The usefulness of this is packaged in the form of: Reducing excessive evaporation to extend shelf life, reducing the possibility of cross contamination. Wrapped Special uses plastic in plastic named type A. Vegetables placed in a plastic type A is better than the plastic is in “sealed” at the tip such that the plastic pitch cover tightly.
47
5.3. Juice Row Vegetables
Just like fruits, vegetables are also needed by the body because it is rich in fiber, enzymes, vitamins and minerals. Juice raw vegetables have higher nutrient content than green vegetables that have been processed. Not only that, the nutrients in the form of processed vegetable juices more digestible, more rapidly distributed by the blood so that the body is not deficient intake of substances necessary for metabolic processes. Raw vegetable juice contains micro mineral elements such as boron, selenium, and chromium that is needed by the body. These minerals will come out when foods processed into juice, not cooked instead of boiled. Mineral selenium in green vegetables actually to protect the body against Cancer. Boron helps the absorption of calcium in children, adolescents and the elderly. Chromium with insulin while helpful in carbohydrate metabolism as well as fat, and serves to facilitate the entry of glucose into cells. So, do not underestimate the benefits of green vegetable juice for the health and fitness of your body. Consider the materials that you choose to be processed into green juicebecause not all raw vegetables taste good according to the tongue of Indonesia. The addition of fruit is also very advisable to make a delicious vegetable juice in addition to useful as a natural sweetener.
Cucumber Vegetable Juice Oranges
Recipe for: 2 servings
Ingredients:
150 grams of cucumber
2 pieces of lemon
100 ml of water ginger
2 tablespoons sugar syrup
48
How to make:
Peel the cucumber and cut so easily destroyed.
Cut the lemon in half and then squeeze the water.
Blend cucumber until smooth, strain.
Mix cucumber juice with lemon juice, ginger juice and sugar syrup.
Then process of re-using a blender until well blended.
Pour into glasses and serve.
To be more fresh, serve with adding ice cubes on it.
Note:
Helpful cucumber vegetable juice recipes beauty care, keep skin smooth and toned from the inside.
Just like fruits, vegetables are also needed by the body because it is rich in fiber, enzymes, vitamins and minerals. Juice raw vegetables have higher nutrient content than green vegetables that have been processed. Not only that, the nutrients in the form of processed vegetable juices more digestible, more rapidly distributed by the blood so that the body is not deficient intake of substances necessary for metabolic processes.
Juice Celery Turnip Round
Ingredients:
750 grams of celery
1 small round pieces of turnip
1 green apple
½ tangerine
1 tablespoon sugar syrup
How to make:
Apples, tangerines and radishes washed and peeled and then blended until it is destroyed.
49
Mix the juice with the juice of celery and enter the sugar syrup and stir well.
This green vegetable juice recipes useful for patients with hypertension, coronary heart disease, prevent colon cancer, digestion, lowers cholesterol and is very good for maintaining the health of pregnant women.
(http://jussehatku.blogspot.hk/2014/05/resep-jus-sayur-hijau-enak-sehat.html).
5.4. Machine and Equipment
50
51
Source: www.googleimage.com Figure 5.10. Machine and Equipment
5.5. Project Location
52
Source Picture: www.google.com.hk Figure 5.11. Project Location
53
54
Chapter 6
Financial Feasibility
________________________________________________________
6.1. Capital
Table 6.1.Capital
No Category Total IDRP
1 Building and Transportion 208,195,000.00
2 Machine &Equipment 18,720,000.00
3 Other Civil Work 16,145,000.00
4 Pre Operating Expenses 206,940,000.00
Total Project Cost 450,000,000.00
Figure 6.1. Chart of Capital
6.2. Capital and Loan
Table 6.2. Capital and Loan
Category Percentage Amount
Share /Capital 66.67% 300,000,000.00
Loan 33.33% 150,000,000.00
Total Capital And Loan 100.00% 450,000,000.00
Building and Transportation
46% Pre Operating
Expense 46% Other Civil Work 4%
Machine & Equipment
55
6.3. Contribution
Table 6.3. Contribution
No Category Debit(Equity) Contribution%
1 Umi Nur Cholifah 160,000,000.00 53.33%
2 Sri Weni 140,000,000.00 46.67%
Total 300,000,000.00 100.00%
6.4. Machine & Equipment
Table 6.4. Machine & Equipment
No Machine &Equipment PriceIDR Units Total IDR
1 Packing Press Machine 2,000,000.00 1 2,000,000.00 2 Labeling Machine 500,000.00 2 1,000,000.00
3 Numbering/Code 350,000.00 2 700,000.00
4 Calculator 70,000.00 2 140,000.00
5 Packing Box 90,000.00 9 810,000.00
6 Refrigerator 5,500,000.00 1 5,500,000.00
7 Basket 50,000.00 9 450,000.00
8 Knifes 10,000.00 4 40,000.00
9 Scissors 10,000.00 4 40,000.00
11 Tables 750,000.00 2 1,500,000.00
12 Scales 1,000,000.00 2 2,000,000.00
13 Air Condition 4,500,000.00 1 4,500,000.00
56
6.5. Materials
Table 6.5. Materials
No Machine
&Equipment Price IDR Units Total IDR
1
Packing Press
Machine 2,000,000.00 1 2,000,000.00
2 Labeling Machine 500,000.00 2 1,000,000.00
3 Numbering/Code 350,000.00 2 700,000.00
4 Calculator 70,000.00 2 140,000.00
5 Packing Box 90,000.00 9 810,000.00
6 Refrigerator 5,500,000.00 1 5,500,000.00
7 Basket 50,000.00 9 450,000.00
8 Knifes 10,000.00 4 40,000.00
9 Scissors 10,000.00 4 40,000.00
11 Tables 750,000.00 2 1,500,000.00
12 Scales 1,000,000.00 2 2,000,000.00
13 Air Condition 4,500,000.00 1 4,500,000.00
Total 39 18,720,000.00
6.6.Labor Salary
6.6.1. Direct Labor Salary
Table 6.6. Direct Labor Salary
No Category 2 PPC & Designer Product 1 1,000,000.00 12,000,000.00
3 Sales 1 800,000.00 9,600,000.00
4 Expedition 1 800,000.00 9,600,000.00
5 Workers @ 750 x 4 4 3,000,000.00 36,000,000.00
Total Direct Labor Salary 6,600,000.00 79,200,000.00
6.6.2. Indirect Labor Salary
Table 6.6.2. Indirect Labor Salary
No Category Monthly Yearly
1 General Manager 3,000,000.00 36,000,000.00
2 Production & HRD Manager 2,000,000.00 24,000,000.00 3
Marketing & Financial
Manager 2,000,000.00 24,000,000.00
57
Condition 1,500,000.00 1 1,500,000.00 5 175,500.00
58
1 Spinach 18 35,000.00 630,000.00 18,900,000.00 226,800,000.00 2 Green Cabbage 28 36,000.00 1,008,000.00 30,240,000.00 362,880,000.00 3 Kale 18 18,000.00 324,000.00 9,720,000.00 116,640,000.00 4 Cucumber 10 35,000.00 350,000.00 10,500,000.00 126,000,000.00 5 Salary 13 30,000.00 390,000.00 11,700,000.00 140,400,000.00 6 Cassava Leaves 18 32,000.00 576,000.00 17,280,000.00 207,360,000.00 7 Bitter Cucumber 13 18,000.00 234,000.00 7,020,000.00 84,240,000.00 8 Broccoli 18 18,000.00 324,000.00 9,720,000.00 116,640,000.00 10 Beans 13 18,000.00 234,000.00 7,020,000.00 84,240,000.00
Total 149 240,000.00 4,070,000.00 122,100,000.00 1,465,200,000.00
6.9. Amortization
Principle Loan Total Amortization
0 150,000,000.00 0 0 0
1 127,680,000.00 22,500,000.00 22,320,000.00 44,820,000.00 2 102,012,000.00 19,152,000.00 25,668,000.00 44,820,000.00 3 72,493,800.00 15,301,800.00 29,518,200.00 44,820,000.00 4 38,547,870.00 10,874,070.00 33,945,930.00 44,820,000.00
5 .00 5,782,180.50 39,037,819.50 44,820,000.00
Interest Table : 15% =0,2988
6.10. Operating Expenses
Table 6.10. Operating Expenses
Item Monthly (IDR) Yearly (IDR)
Salary 7,000,000.00 84,000,000.00
Rent 1,500,000.00 18,000,000.00
Utilities 300,000.00 3,600,000.00
Thelephone 500,000.00 6,000,000.00
Promotion 500,000.00 6,000,000.00
Depreciation 1,880,775.00
Insurance 250,000.00 3,000,000.00
59
6.10.1.Factory Overhead
Table 6.10.1. Factory Overhead
Items Monthly (IDR) Yearly (IDR)
Water 300,000.00 3,600,000.00
Maintenance 350,000.00 4,200,000.00
Electricity 450,000.00 5,400,000.00
Depreciation Machine
&Equipment 937,755.00
Total 1,100,000.00 14,137,755.00
6.11. Pre Operation Expenses
Table 6.11. Pre Operation Expenses
Category Monthly(IDR)
Material 81,870,000.00
Salary Direct Labor 6,600,000.00
Factory Overhead Cost 1,100,000.00
Operation Cost 10,300,000.00
Total Pre Operation Expenses 99,870,000.00
6.12. Cash Flow for Pre Operating Expenses
Table 6.12. Cash Flow for Pre Operating Expenses
Month 1 2 3 4 5
Cash In 122,100,000.00 122,100,000.00 122,100,000.00 122,100,000.00
Cash Out 99,870,000.00 99,870,000.00 99,870,000.00 99,870,000.00 99,870,000.00
Net Cash -103,470,000.00 22,230,000.00 22,230,000.00 22,230,000.00 22,230,000.00
Cumulative