First Beijing Haidian International Forum for Earthquake Preparedness and Disaster Mitigation, November 1-3, 2004, Beijing
COMPARATIVE STUDY OF INSTITUTIONAL ARRANGEMENTS IN URBAN DISASTER REDUCTION MANAGEMENT
Antonio L. FERNANDEZ, Neil R. BRITTON, Jeannette Castro FERNANDEZ, and Zhila POOYAN
Earthquake Disaster Mitigation Research Center/ National Research Institute for Earth Science and Disaster Prevention, Kobe, Japan
I. Background
Within the governmental structure of a country, there are typically two or three levels (World Bank, 2000, pp. 114-117). These sub-national units are defined here as local governments, or local government units (LGU); they are also referred to as local authorities. The LGU is the closest level of organized government to the people, and therefore it has a key role in broad-spectrum disaster risk management practices and processes. Large cities in particular bring heavy demands on how to deal with disasters because of the very nature of their functions, the significance they have, and the resultant complexity that their socio-economic and settlement characteristics present in combination with the types of risks they are exposed to. To handle problems arising from increasing risks from both natural and technological sources, a government authority needs to ensure it has a coordination framework that ties its own system together and enables it to appropriately link with others. Government has special responsibilities in the realm of risk reduction and disaster preparedness. However, we do not mean that governments have sole responsibility for disaster risk management. In reality, disaster management is a responsibility it shares with every sector of society. Disaster management requires mechanisms, processes and institutions through which stakeholders can contribute and participate as part of good governance.1
1 The United Nations Development Program defines governance as the exercise of economic,
II. Scope and Objective of Study
This paper serves as groundwork for understanding aspects that underpin a more robust management system for dealing with urban risks. It is a truism that the type of disaster risk management structure a society adopts has an influence on the losses expected. For example a society that has a response-oriented system is likely to have more frequent impacts and greater losses per hazard occurrence because the reactive nature of this system does not provide scope for systematic risk reduction measures. By comparison, a system that incorporates a hazard mitigation program as an integral component of its disaster risk management structure is better equipped to identify and monitor risks, reduce their likelihood, anticipate likely consequences, and hence lessen overall losses. If an appropriate structure is in place, in other words, disasters may be dealt with more adequately. This is particularly important at the local governmental level, which is where disaster impact occurs: disasters are after all, a local problem even if they sometimes reach national or international significance. At the same time, it is typically at the national governmental level that a framework is established within which local governments operate. This relationship is no different for disaster management than it is for education or health (Britton, 1999). This paper aims to compare the institutional arrangements between national and local government levels in ten selected large cities in developing and industrialized nations. It is an initial step toward establishing baseline information of a group of large cities exposed to a variety of natural and man-made risks in different parts of the world. The main information source is material collected through a survey questionnaire of key respondents within the selected cities. The questionnaire is being used a tool to communicate with city representatives and provides a platform for future capacity development in those cities.
III. Methodology
responses were received between May to July 2004 were: Bogota, Colombia; Quito, Ecuador; Mexico City, Mexico; Los Angeles, US; Mumbai, India; Manila, Philippines; Kathmandu, Nepal; Tashkent, Uzbekistan; Naples, Italy; and Dakha, Bangladesh.
The main contact persons sent surveys were local government officers, researchers and academicians who represent their cities in the EMI. Survey respondents consisted of five from local government (Bogota, Colombia; Los Angeles, United States; Mexico City, Mexico; Quito, Ecuador; Mumbai, India), two non-governmental organisations (NGOs) (Dakha, Bangladesh; Kathmandu, Nepal), three academic/research institutions (Manila, Philippines; Naples, Italy; Tashkent, Uzbekistan;). Contact persons were encouraged to link up with the holders of information, especially since the type of information sought was not typically located in a single agency. The analysis presented in this paper is focused on a segment of the questionnaire.
III. Disaster Management Frameworks
As if daily living is not without major problems for most in a developing nation, the complexities of living and working in a city are further compounded by the ever present natural hazards as well as man-made hazards that help shape “urban vulnerability” (Horlick-Jones, 1995; Quarantelli, 2003; Wisner, 2003). Means ranging from technologies to institutions are typically utilized to deal with disaster-related issues. As for the institutions, a few practitioners and researchers have provided syntheses useful for this study. Based on earlier research, Mattingly (2002) identifies three evolving philosophical approaches in disaster risk management:
(1) Increased emphasis on pre-disaster not post-disaster (2) “Top-down” and “bottom-up” approaches
(3) Linking mitigation and development.
(1) Disaster relief, which stems from reacting to impacts from high risk to certain hazards, like flood or earthquake.
(2) Event control, which tends towards heavy reliance on technology regardless of how well it fits a community, thus in Bangladesh, dikes and cyclone warning system substituted for individual actions in the past. (3) Comprehensive damage reduction, which incorporates a whole list of
far-reaching nationally-sanctioned measures for a single hazard that may tend to be insensitive to local realities.
(4) Combined multi-hazard management, which links “hazard management with socioeconomic development” in the context of developing countries; it “involves equalization of risks in the industrial countries and the selection of risks for attention in the developing countries” (Burton, Kates and White, 1993, p. 183).
These tendencies can still be observed today. On the other hand, clear roles for different levels of government, organizations and individuals should be delineated in whichever type a management leans toward. Twigg (2004, pp. 198-211) suggests that agreeing to clear roles and responsibilities is the first step to setting up a process of accountability, an emerging issue in disaster reduction.
To carry out policies, again there are different types of institutions or “national disaster management models” (UN/DMTP, 1998). A model is defined as “a formal system of disaster management with institutional structure and institutional linkages, supported by national preparedness plan or strategy, and legislation.” In this definition, the words “institutional,” “plan,” “strategy” and “legislation” are significant in terms of ensuring a platform to guide city stakeholders. The models which currently dominate are:
(1) A national disaster management office (NDMO) located in the Prime Minister’s Office (such as the Cabinet Office which is under the Prime Minister is the NDMO in Japan.) ;
(2) An NDMO located in a line ministry (for example, the Royal Government of Thailand set up the Department of Disaster Prevention and Mitigation under the Ministry of the Interior in 2002 (Kesthong, 2003));
(4) A committee or council at the apex of the structure for disaster management (such as the Philippines).
Line ministries (refer model (2) above) that that have disaster management functions vary from country to country, e.g., the social welfare ministry in Sri Lanka, interior ministry in Thailand. In India, the responsibility for disaster management was moved from the agriculture ministry in 2003 to the home affairs ministry. Due to frequent disastrous cyclones that affect rural areas, the agriculture ministry was mainly focused on disaster relief. In the aftermath of the Gujarat earthquake, however, a reaction towards rehabilitation and preparedness has led to the shift (Sajnani, 2003).
The typologies mentioned above may be employed to put together a matrix (an application is shown later). The matrix sets up types of national hazard policy against the national disaster management models. One might attempt to characterize a country’s disaster management system by investigating to which box it is likely to fit in. Bearing in mind that national hazard policy types are non-exclusive, it is instructive to make a distinction among different systems.
Responding to societal needs to deal with hazards require an understanding of risks likely to occur in the city. Ordinary citizens should identify and should be assisted in identifying the risks themselves so that they can properly cope with those risks. However, as it is shown in the next section, people in cities tend to be less informed about urban risks in their cities than the whole country.
IV. Local vs. national picture
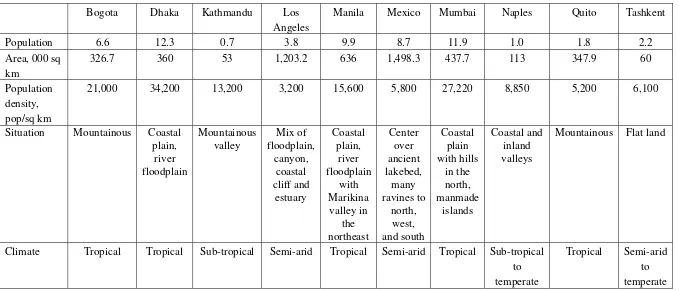
Information on the ten studies cities are shown on Table 1. It shows the range of population densities from 3,200 ppsk (persons per square kilometer) in Los Angeles to 27,200 ppsk in Mumbai. The situation and climate also create images of the setting of the city.
Table 1. Comparison of ten cities.
Bogota Dhaka Kathmandu Los
Angeles
Manila Mexico Mumbai Naples Quito Tashkent
Population 6.6 12.3 0.7 3.8 9.9 8.7 11.9 1.0 1.8 2.2
21,000 34,200 13,200 3,200 15,600 5,800 27,220 8,850 5,200 6,100
Situation Mountainous Coastal
Climate Tropical Tropical Sub-tropical Semi-arid Tropical Semi-arid Tropical Sub-tropical to
temperate
Tropical Semi-arid to
Munich Reinsurance has a hazard index for megacities2 (Munich Re, 2003) that takes into account “main” (earthquake, windstorm, flood) and “secondary” (volcanic eruption, bush fires, winter frost) hazards all at the same time. Developed for underwriting and other purposes, the index indicates a loss potential considering the risk components, namely hazard, vulnerability and exposure values. Five of the study cities are among the 50 megacities for which the indices are calculated: Greater Los Angeles, Manila, Mexico City, Dhaka and Mumbai – arranged in decreasing order of the risk index.
It is however usual to collate disaster loss data and aggregate them at the country level (see the International Disaster Database called EM-DAT of the Centre for Research on the Epidemiology of Disasters (CRED, undated), which is utilized for data summaries for Asia by the Asian Disaster Reduction Centre (ADRC, 2000)) similar to what is done with population figures. (In developing countries, city officers often refer to population figures taken from the last national census which can be more than ten years old, and hence obscure the real vulnerability that a particular locality has.)
The United Nations vulnerability report (UNDP, 2004) also introduces disaster risk indicators such as physical exposure and relative vulnerabilities to specific hazards (namely, droughts, earthquakes, floods, and tropical cyclones) at the country level. Here, data is taken for a 20-year period (i.e. from 1980 and 2000), when some level of confidence can be ascribed to the available data.
It is also useful to review the relative vulnerabilities across countries and natural hazards (Table 2). Relative vulnerability of a hazard is the number of killed per million of exposed population. As shown by the highest value of relative vulnerability, India had been most vulnerable to earthquakes with floods following far behind, followed by tropical cyclones and drought in that order. From these data, we deduce that earthquakes caused the most deaths per exposed population in seven countries out of ten. The three exceptions are Bangladesh where tropical cyclones have been the most fatal, while floods were for the Philippines and the US. The Philippines had been
2 Here a megacity “refers to the entire urban agglomeration in each case (i.e., adjacent towns and
Table 2. Relative vulnerability (killed per million exposed) to four natural hazards in the study countries for the period 1980-2000.
Relative vulnerability (killed per million exposed) by hazard
India 8.34 2.9 0.58 211.16 Earthquake
Italy 4.15 - - 175.21 Earthquake
Mexico 24.57 1.24 - 103.06 Earthquake
Nepal 11.62 - - 75.14 Earthquake
Philippines 8.13 3.33 0.05 7.43 Flood
Uzbekistan - - - 0.9 Earthquake
Note: “-“ means not applicable Source: UNDP, 2004.
as vulnerable to floods as Bangladesh. Mexico’s relative vulnerability to floods nevertheless is nearly three times larger than that of the Philippines and Bangladesh.
On a global basis, relative vulnerability of drought had been the highest over the 20-year period (about 17,000 people killed per million of exposed population in the Democratic People’s Republic of Korea), followed by earthquake, then flood. None of the countries represented in the sample come close to these maximum values.
well-off places like Iran and Turkey. Flooding is most deadly not in crowded countries like Bangladesh, but in areas where dispersed population, such as Papua New Guinea – presumably because it is harder to bring help to the victims when disaster strikes.” These cited realities illustrate a number of variables that come into play – demographic as well as the state of emergency preparedness. The latter again brings back the importance of local response capabilities as well as those higher-level or national rescue capacities.
Once again, it should be noted that these comparisons are limited to the country level; they are not useful for subnational, particular city-level analysis. In the next section, selected results of the city survey mentioned earlier are discussed.
V. Results; National-Local Relationships Pertaining to Disasters
Disaster laws, national disaster management plans and national emergency preparedness plans are examples of disaster management tools that are utilized by both national and local governments as shown by the results of the survey. Hazard-specific plans are more commonly found at city-level than at country-level; examples are flood and winter risk for Mexico City, and fire, volcano and storm for Quito.
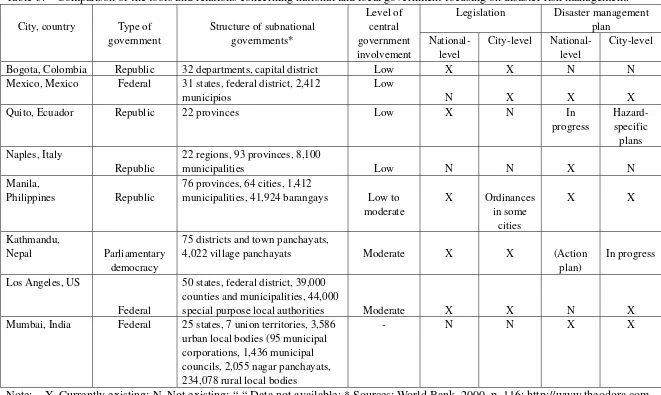
The questionnaire also asked respondent to explain the “type of relationship between the national and city government for administrative purposes,” and specifically the “type of the country’s government involvement in city policies.” The concept of decentralization3 is utilized to describe the relationship. In the context of this study, decentralization in the form of devolution, i.e. the transfer of responsibility to sub-national units of government (Cheema and Rondinelli, 1983) is the most relevant. A summary of the results is shown in Table 3. A few observations from this table are the follows. Supplementary information obtained from the survey are also provided.
• More decentralized systems do not necessarily mean disaster legislation exists in the city.
• Mexico, Colombia, and India have national-level plans with most or all the
3 “Decentralization can be defined as the transfer of responsibility for planning, management, and resource raising and allocation from the central government and its agencies to: (a) field units of central government ministries or agencies; (b) subordinate units or levels of government, (c)
Table 3. Comparison of the tools and relations concerning national and local government focusing on disaster risk management. Mexico, Mexico Federal 31 states, federal district, 2,412
municipios
22 regions, 93 provinces, 8,100
municipalities Low N N X N
Manila,
Philippines Republic
76 provinces, 64 cities, 1,412
municipalities, 41,924 barangays Low to moderate
75 districts and town panchayats,
4,022 village panchayats Moderate X X (Action plan)
In progress
Los Angeles, US
Federal
50 states, federal district, 39,000 counties and municipalities, 44,000
special purpose local authorities Moderate X X N X Mumbai, India Federal 25 states, 7 union territories, 3,586
urban local bodies (95 municipal corporations, 1,436 municipal councils, 2,055 nagar panchayats, 234,078 rural local bodies
- N N X X
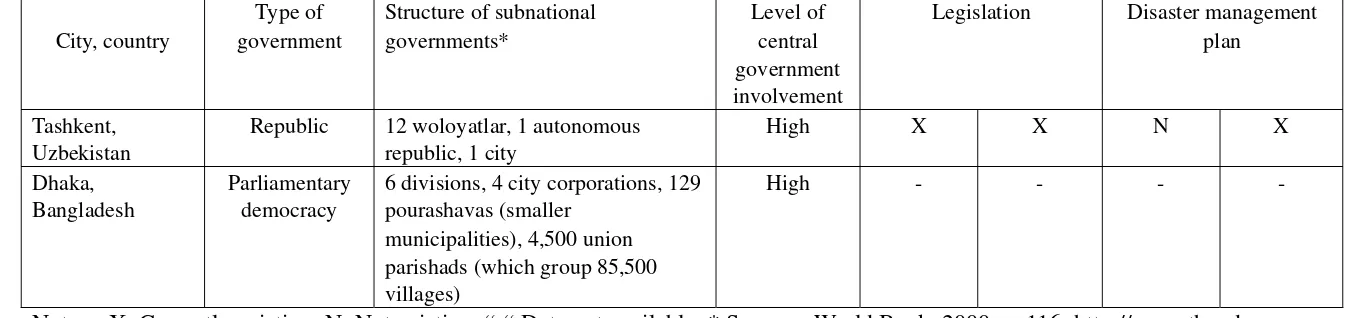
Table 3. Comparison of the tools and relations concerning national and local government focusing on disaster risk management (continued)
City, country
Type of government
Structure of subnational governments*
Level of central government involvement
Legislation Disaster management plan
Tashkent, Uzbekistan
Republic 12 woloyatlar, 1 autonomous republic, 1 city
High X X N X
Dhaka, Bangladesh
Parliamentary democracy
6 divisions, 4 city corporations, 129 pourashavas (smaller
municipalities), 4,500 union parishads (which group 85,500 villages)
High - - - -
components to handle disasters at the national level. Nepal has a disaster management action plan completed in 1996. In the Philippines, the national disaster preparedness plan specifies that disaster coordinating councils be established for national, regional, Metro Manila, provincial, city or municipal and barangay level. (The barangay is the lowest political administrative unit of government.) Each disaster coordinating council shall maintain a disaster operations center.
• City-level plans outnumber national-level plans. While six cities have disaster plans, only four countries have national plans. Mexico City has a disaster plan but Mexico, the country of which it is the capital city, does not have a national disaster plan. Plans for both levels are mostly disaster preparedness and response plans. The respondents from Bogota, Mumbai, and Quito claim that mitigation plans exist for both their cities and countries.
• Type of government (e.g., federal, republic) appears not to influence disaster management coordination. (This is admittedly a simplification as countries of the same type of government have different governance structures shaped by many factors such as history; for example, state government in India (World Bank, 2000, p. 109) is strongly influenced by the national government unlike other federal government setups like the U.S. or Malaysia .)
Countries have embarked on adopting tools that help integrate disaster management into mainstream national planning. On the other hand, sub-national units like states and cities have also adopted tools like disaster management plan covering all disasters (e.g., Mumbai) and hazard specific disaster management plan (e.g., earthquake impact reduction plan in Manila, California Earthquake Loss Reduction Plan).
some cities, there are some studies on cities like Dhaka (Huq and Alam, 2000) which are useful for this study. City disaster profiles are being reviewed with the collaboration of local researchers in the cities.
Kathmandu
Kathmandu Metropolitan City (KMC) is the capital city of Nepal, a landlocked country located in the Himalayas between China and India. Nepal became a parliamentary democracy when reforms were introduced in 1990 after almost 40 years of constitutional monarchy and 100 years of absolute monarchy. The most common natural hazards are severe thunderstorms, flooding, landslides, drought, and famine depending on the timing, intensity, and duration of the summer monsoons The Kathmandu Valley which comprises of an area of approximately 660 sq km and the districts of Kathmandu, Lalitpur and Bhaktapur witnessed the Nepal Bihar earthquake in 1934 which destroyed 60% of its buildings and killed around 4,200 people. (Kathmandu’s present area is roughly 6% of the whole of Kathmandu Valley.) At present, the country’s Ministry of Home Affairs is responsible agency for disaster management. Autonomy is given to LGUs through the Local Self Governance Act of 1999. The Act empowers the local governments to undertake disaster management activities.
management was incorporated in the country’s Tenth 5-year Development Plan. As a consequence, Nepal as a country encourages disaster prevention and mitigation. A concrete example is the Plan’s aim to contribute towards “making the infrastructural construction and development projects of the country durable, sustainable and capable of providing the intended service”. Actions are not limited to structural measures but also non-structural ones such as public awareness activities, specially at the city level through the city government’s Disaster Management Section. However, as the city lacks resources and manpower for such activities, non-governmental organizations, particularly, the National Society for Earthquake Technology of Nepal (NSET) the city government conducting courses for city officers and conducting public awareness campaigns on disaster preparedness and mitigation. Lastly, a separate act called Kathmandu Metropolitan City Act, is being formulated in order to provide a comprehensive legal and policy framework for an effective governance of the capital. This act, which is expected to be enacted by the end of the year 2004 includes disaster risk management.
Quito
Situated high on a valley in the Andes Mountains, Quito is in an area of intense volcanic activity due to Mt. Pichincha, which resumed activity in 1998 after a long period of dormancy (last major eruption in 1866). Quito is the oldest among the capitals of South American countries; its first colonial settlement was designated a UNESCO World Heritage site in 1978. Apart from volcanic eruptions, the city is threatened by earthquakes, wildfires, landslides, and technological hazards. Ecuador, as a whole is prone to floods.
city government. Currently there are separate disaster reduction plans for fires, storm and rainfall, and Cotopaxi Volcano at the city level.4 However, the plans remain unimplemented for lack of the appropriate mechanisms and comprehensiveness. No effort at the national level has been made by the national government except that ad hoc governmental entities for areas affected by the El Nino phenomenon were created. (Note: These were the Corporacion Para Enfentar el Fenomeno de El Nino 1997-1998 (COPEFEN) and the Corporation Para Reconstruccion de las Zonas Afectadas por el Fenomeno El Nino (CORPECUADOR)). Since April 2002, the National Secretary for Planning and Development (SENPLADES, formerly ODEPLAN) started a project to set the direction for national disaster management. With the support of the Andean Development Corporation (CAF) under the Regional Program for Risk Prevention and Mitigation (PREANDINO), the project ends in March 2005. The project concentrates on defining sectoral policies to prevent and mitigate risks by integrating them into planning processes at all levels (Fiallos, 2004).
Apparently with functions overlapping, the government bodies mentioned and other national ministries do not coordinate properly (Solberg, Hale and Benavides, 2003). This makes it complex for local level organizations to deal with national level organizations. Quito’s disaster management system can be given a boost as universities continue to be involved together with civil society groups in the project.
IV. Synthesis and Integration
Using the national disaster management models and typology of policies as two axes for a matrix to characterize the national-level disaster institutions in the study countries, the product is shown in Table 4. For instance, it is shown in the table that Ecuador has disaster units in various government entities, and relief and reconstruction are the focus of attention of the existing national disaster management structure. The other countries are characterized in such a manner as well. As shown in Table 3, combinations of disaster management plans and legislation are utilized in the countries.
As experience in Istanbul (Turkey) shows, a disaster risk management plan is a
4 The Municipality of Quito collaborated with Escuela Politecnica Nacional, a local university and
Table 4. Characterizing national-level disaster institutions in the study countries.
tool for all stakeholders.5 Ideally, it contains the following components: risk
assessment, prevention, response, mitigation, capacity building and others (Bendimerad, 2000). It also becomes important to have vehicles or platforms for communicating with the various stakeholders of a city. It remains a difficult and challenging task to direct energies to disaster mitigation or to incorporate as many or all components mentioned above. Future work on the format and items that need to be included city disaster profiles is imperative and will be pursued by the research team.
The comparative study at this stage has established that local or city government and national government need to agree on their working arrangements, or “rules of the game.” Exactly which institutions are the key stakeholders in dealing
5
In the aftermath of two damaging earthquakes in 1999, the Istanbul Metropolitan Municipality signed a protocol with four universities to prepare an earthquake master plan for Istanbul. Public funds are being spent to put the master plan together wherein a “road map” wherein roles and commitment of stakeholders will be delineated. The plan is considered “a social contract between the governorate, greater city municipality, local municipalities, institutions, enterprises, and NGOs. A contingency plan to coordinate all actors and link entities is being drafted. Local action programs to designate high risk areas, perform local surveys, and the like are combined with encouraging property owners to reducing physical vulnerability through retrofitting, and synchronizing mitigation with development.
Type of national hazard policy National
disaster management
model
Disaster relief Event control
Comprehensive
with disaster risks in an integrated way? We shall call these institutions “disaster institutions.” The terms used by Mattingly (2002) - nodal agencies (or focal points – see Britton and Wettenhall, 1990), coordination bodies, tier or levels - fit the types of disaster institutions as gleaned from the discussion of the two cities earlier. There are nodal agencies that are part of inter-institutional set-ups (involving coordination bodies) at different levels. (The same terms are as equally applicable for framing other urban services particularly those related to social welfare like health.) In the previous discussion about Kathmandu, the levels consists of an intermediate tier of 75 districts and town panchayats, and lowest tier of 4,022 village panchayats. Various institutional arrangements through mechanisms are essential to run the machinery of disaster management. All of these feed back to a nodal agency, which is the Ministry of Home Affairs of Nepal.
The nodal disaster agency at the apex essentially provides guidelines and the “rules of the game” but allows for feedback, in “bottom-up” fashion. In light of the “long indigenous histories of local governance” of all countries, resistance to governance and partnership at the local level is experienced particularly where colonial powers exercised administrative command and control in the past. Regarding autonomy of governance, Sproats (2000) writes: “Administration can be delegated, as an agency function, but governance, particularly local self-governance, must have a local or grass-roots basis. Local governance is ultimately about control. It is the ability to reach decisions locally outside the control of a higher level of government.”
that can be drawn is one in which the public is not adequately protected, and each stakeholder cannot do effectively what he or she can do, i.e. failing to enable local efforts to take root in the overall system.
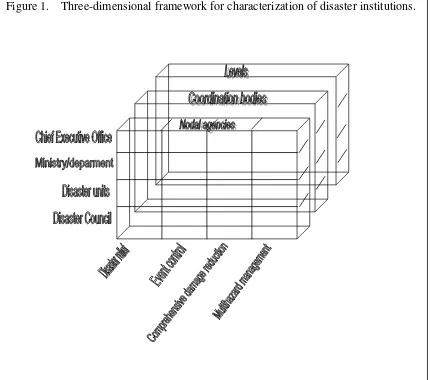
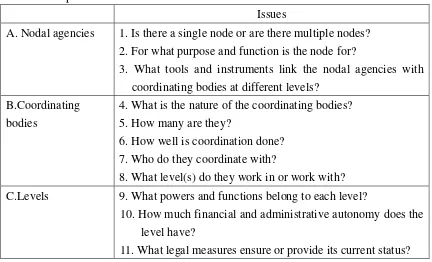
Lastly, future work will take into account three dimensions as shown in Figure 1. The characterization of disaster institutions here should be highly relevant to multi-level coordination. Each of the ‘boxes’ in the large ‘cube’ contain a significant amount of information that can be incorporated in the city disaster profile. The goal here as set earlier is finding means to integrate disaster risk management into the development process. As a practical guide in using the framework, a set of classified yet interrelated questions (called “issues”) are given in Table 5 for the analyst and decision maker to articulate their responses to.
Table 5. Issues to consider when integrating urban disaster risk management with other development functions.
Issues A. Nodal agencies 1. Is there a single node or are there multiple nodes?
2. For what purpose and function is the node for?
3. What tools and instruments link the nodal agencies with coordinating bodies at different levels?
B.Coordinating bodies
4. What is the nature of the coordinating bodies? 5. How many are they?
6. How well is coordination done? 7. Who do they coordinate with?
8. What level(s) do they work in or work with? C.Levels 9. What powers and functions belong to each level?
10. How much financial and administrative autonomy does the level have?
11. What legal measures ensure or provide its current status?
VII. Conclusions
Over the last decade, the same tendencies of national disaster management policy may not have entirely changed from what Burton, Kates and White (1993) described. However, mitigation has been found to emerge in a few of the cities surveyed. Decentralization introduces new possibilities in institutional arrangements. It is apparent that decentralization reforms do influence the governance structures prevalent in disaster management in different countries. On the other hand, history and politico-administrative traditions strongly influence the process of change. As far as disaster management is concerned, more empirical observations appear to be necessary but these shall now be guided by a framework such as the one presented in this paper.
stakeholders with the help of loss inventories. The relative vulnerabilities at the city-level are desirable. Current work on the Global Disaster Identifier Number (GLIDE) to expand the sequential disaster number to identify the disaster-stricken area in the country (ISDR, 2004, p 196) will be very important in deriving city-level relative vulnerabilities. After GLIDE partners agreed in 2003 was important to incorporate this positive change to city-level disaster planning processes for stakeholders. This would reinforce communication platforms in addition to city disaster profiles mentioned in this paper. This will enable make more useful comparison among cities rather than just among countries, as was shown in the paper.
Acknowledgment
The authors wish to thank members of the Crosscutting Capacity Development Program (3cd) of the Earthquake and Megacities Initiative (EMI) who contributed ideas to the constructing the questionnaire: Fouad Bendimerad, Friedemann Wenzel, Louise Comfort. We also thank Shirley Mattingly, program director for her guidance during the critical initial phase of 3cd and Shadi Hijazi for his highly competent support.
References
ADRC, 2000. 20th Century (1901-2000) Data Book on Asian Natural Disasters Vol. 2. Kobe: Asian Disaster Reduction Center (ADRC).
AllRefer.com, undated. Country Study and Guide: Ecuador – Civil Defense. Available at http://reference.allrefer.com/ country-guide-study/ ecuador/ecuador112.html.
Bendimerad, Fouad, 2000. Megacities, Megarisk. Available at http://www.proventionconsortium.org/articles/megacities.htm.
Britton, Neil, 1999. Political Commitment. Pp. 214-216 in Ingleton, Jon (ed.), Natural Disaster Management. Leicester, England: Tudor Rose.
Britton, N.R. and R.L. Wettenhall, 1990. Evolution of a Disaster Focal Point: Australia’s Natural Disaster Organisation. International Journal of Mass Emergencies and Disasters 8(3): 237-274.
Burton, Ian, Robert W. Kates and Gilbert F. White, 1993. The Environment as Hazard (2nd ed). New York: The Guilford Press.
CRED, undated. Emergency Events Database (EM-DAT). Brussels: Centre for Research on the Epidemiology of Disasters (CRED). Available at
http://www.em-dat.net/.
Cheema, G. Shabbir and D.A. Rondinelli (eds.), 1983. Decentralization and Development: Policy Implementation in Developing Countries. Beverly Hills: Sage.
The Economist, 2004. Natural Disasters: Earth, Wind and Water (February 7). Fiallos, Blanca, 2004. Personal communication (October.)
Freeman, Paul K., Leslie A. Martin, Joanne Linnerooth-Bayer, Koko Warner, Alan Lavell, and Omar D. Cardona, 2001. National Systems and Institutional Mechanisms for the Comprehensive Management of Disaster Risk (Phase 1 Background Study). Inter-American Development Bank Regional Policy Dialogue. Available at http://www.aiaccproject.org/, accessed on August 21, 2003.
Horlick-Jones, Tom, 1995. Urban Disasters and Megacities in a Risk Society. GeoJournal 37.3: 239-334.
Huq, Saleemul and Mozaharul Alam, 2000. Pp. 121-135 in Kreimer, Alcira, Margaret Arnold and Anne Carlin (eds.). Building Safer Cities: the Future of Disaster Risk. Washington D.C.: World Bank.
ISDR, 2004. Living with Risk: A Global Review of Disaster Reduction Initiatives. Geneva: International Strategy for Disaster Reduction (ISDR).
Kesthong, Kosin, 2003. Pp. 5-11 in EDM/NIED, EDM Technical Report No. 16, Fifth Multi-lateral Workshop on Development of Earthquake and Tsunami Disaster Mitigation Technologies and Their Integration for the Asia-Pacific Region, 2-3 December 2002, Bangkok. Earthquake Disaster Mitigation Research Center (EDM)/ National Research Institute for Earth Science and Disaster Prevention (NIED).
Kreimer, Alcira, Margaret Arnold and Anne Carlin (eds.), 2000. Building Safer Cities: the Future of Disaster Risk. Washington D.C.: World Bank.
Mattingly, Shirley, 2002. Disaster Risk Management Experiences and Models. Proceedings, Regional Workshop on Policy, Legal and Institutional Arrangements and Planning for Disaster Management, Bangkok, 25-27 April 2002.
May, Peters J. and Walter Williams, 1986. Disaster Policy Implementation: Managing Programs under Shared Governance. New York: Plenum Press.
Review: Natural Catastrophes 2002. Available in
http://www.munichre.com/default_e.asp.
Quarantelli, E.L., 2000. Urban Vulnerability to Disasters in Developing Countries: Managing Risks. Pp. 211-231 in Kreimer, Alcira, Margaret Arnold and Anne Carlin (eds.), Building Safer Cities: the Future of Disaster Risk. Washington D.C.: World Bank.
Sajnani, M.P., 2003. Interview (December 9).
Solberg, Scott, David Hale and Juan Benavides, 2003. Natural Disaster Management and the Road Network in Ecuador: Policy Issues and Recommendations. Washington D.C.: Inter-American Development Bank. Available at
http://www.iadb.org.
Sproats, Kevin, 2002. Local Government in Asia and the Pacific: A Comparative Analysis of Fifteen Countries. Bangkok: UN/ESCAP. Available at
http://www.unescap.org.
Twigg, John, 2004. Disaster Risk Reduction: Mitigation and Preparedness in Development and Emergency Programming (Good Practice Review No. 9, March). London: Humanitarian Practice Network (HPN)/ Overseas Development Institute. United Nations Development Programme (UNDP), 2004. A Global Report –
Reducing Disaster Risk: A Challenge for Development. New York: John S. Swift Co.
UN/DMTP, 1998. Model for a National Disaster Management Structure, Preparedness Plan, and Supporting Legislation, United Nations Disaster Management Training Program (UN/DMTP), InterWorks, July 1998. Available at http://undmtp.org/English/nationaldisaster/nationaldisaster.pdf.
Wisner, Ben, 2003. Disaster Risk Reduction in Megacities: Making the Most of Human and Social Capital. Pp. 181-196 in Kreimer, Alcira, Margaret Arnold and Anne Carlin (eds.), Building Safer Cities: the Future of Disaster Risk. Washington D.C.: World Bank.
Work, Robertson, 2001. Decentralization, Governance, and Sustainable Regional Development. Pp. 21-33 in Stohr, Walter B., Josefa S. Edralin, and Devyani Mani (eds.), Decentralization, Governance, and the New Planning for Local-Level Development (Vol. 3, New Regional Development Paradigms). Westport: Greenwood Press.