56
Determinant Factors of The Performance Indicator of Local Government
(Study towards Performance Indicator of Economic Growth and Open
Unemployment Rate in Sidoarjo Regency)
Andy Kurniawan
11Researcher in Laboratory of Public Policy and Development Planning (Laboratorium Kebijakan Publik dan Perencanaan Pembangunan/ LKP3), Lecture in Development Planning Studies, Faculty of Administrative Science, University of Brawijaya
Abstract
Indicator of performance is an aspect to evaluate how successful local government is in carrying out development plan that had been established previously. The indicator is frequently referred to as Key Performance Indicator (Indikator Kerja
Utama/IKU) stated in Medium-Term Development Planning of Local Government (Rencana Pembangunan Jangka Menengah
Daerah/RPJMD), a document elaborating 5-year development planning. Implementation of development programs and
activities by local government is an effort to achieve the targeted performance. Various, different factors affect successful achievement of the indicators of performance. The objective of the study was to describe several factors that affected the achievement of the development performance indicator, more particularly one for economic growth (Pertumbuhan
Ekonomi/ PE) and open unemployment rate (Tingkat Pengangguran Terbuka/ TPT). The descriptive quantitative study
analyzed quantitative indicators to describe specific dimension of the economic growth and open unemployment rate. Based on the analysis, the determinant factors for the economic growth in Sidoarjo were financial services and insurance sector, as well as unemployment variable, while those of the open unemployment rate were number of unemployment supported by inflation rate, economic growth and education level. In other words, local governments should focus on the most determinant factors to get priority for intervention programs and local government activities.
Keywords: Performance Indicator of Local Government, Economic Growth, Open Unemployment Rate
INTRODUCTION
Local development planning system is an integral part of national development planning system. Article 260 paragraph (1) of the 2014 Decree number 23 about local government states that “local government in accordance with their authority has rights to develop local development plan as a whole in the national development planning system [1]. Furthermore, Article 3 paragraph (2) of the 2004 Decree number 25 about National Development Planning System states that “National Development plan consists of a set of plan related to development arranged in an integrated manner by the Ministry/ public institution and development planning by local government in accordance to their authority.” [2] Based on the Decrees, there are two elements local government in cities/ regencies should pay attention to in local development planning formulation.
Authors Correspondence Address: Andy Kurniawan, SAP, MAP Email : [email protected]
Address : Jl. MT. Haryono 163, Kota Malang-65145, Jawa Timur - Indonesia
First, the local development planning should be based on higher government level standar, either provincial or central government. Development program and its priority elaborated in local development document developed by city/ regency are supposed to be in line with those developed by provincial and central government. Therefore, there are synergy and harmony between development in the city/ regency and that in the province or capital city. Secondly, local development planning is developed in order to carry out government affairs which become authority of city/ regency government. Development planning programs formulated in the planning documents, mentioned previously, should be able to ensure implementation of government programs city/ regency government is responsible for.
Eventually, local development planning will become a set of action plan; as the consequence, it should consist of consisten, clear and realistic objective, target, policy, program and activities. Therefore, it is critical for the government of Sidoarjo to meet performance indicator established previously in consistent manner.
Based on the Regulation of the Minister of the Utilization of State Apparatus,
57 Performance Indicator Development Guideline,
performance refers to quantitative and qualitative measure describing how successful a program is and how much the program meets its target. Performance indicator gives quantitative and qualitative explanation on which element to evaluate in order to determine whether a program has met its target or not. Having developed the performance indicator, the government of Sidoarjo gets clear idea about what, how much progress implementation of development activities, programs and policies they design have made, and is able to establish the basis for measurment, analysis, and evaluation.
In the study, the performance indicator is narrows down to the Key Performance Indicator (IKU) of the government of Sidoarjo, namely Economic Growth and Open Unemployment Rate (TPT). The Key Performance Indicator (IKU) described on previously is part of Key Performance Indicator (IKU) to realize and to matches core area/ business of the government of Sidoarjo. The economic growth and unemployment are pivotal variables to discuss in relation to the government of Sidoarjo’s effort to develop public independence and welfare as stated in the 2016-2021 vision of Sidoarjo, “Innovative, Independent, Prosperous and Sustainable Sidoarjo.”
Economic growth is development of economic activities where society produces goods and service in order to increase their welfare [3]. It is generally a benchmark of economic development implemented by a region, including Sidoarjo. Objective of economic development is to improve economic and social welfare of the society. One example of economic development implementation is job vacancy accessible by the society so that labor force in Sidoarjo can participate in economic activities and as the result, unemployment rate in the area will reduce. Unemployment is one of the most complex issues, because it affects and is influenced by many factors interacting of which pattern is occasionally hard to understand. According [4], stated that unemployment is a macroeconomic problem that directly affects people and it is the most serious issues at the moment. Unemployment lowers down incomes of the society and ultimately reduces level of prosperity one has achieved [5].
Based on the elaboration, an effort should be conducted to make sure the Key Performance Indicator (IKU) is met, particularly one related to economic growth and open unemployment rate (TPT) by describing determining factors or determinant in achieving the IKU. The determinant
factor will facilitate intervension and acceleration the government of Sidoarjo does in order to guarantee that they meet the indicators of the IKU. Besides that, the study may function as focus learning for the government of Sidoarjo to achieve the IKU, particularly one related to economic growth and open unemployment rate (TPT). Fulfilment of the IKU is an indicator that local government has worked well in terms of planning (document) and implementation (field operation).
METHODOLOGY
The study was an objective study that evaluated local government performance and their determinant factor. It used descriptive quantitative approach assessing quantitative indicator to describe specific dimension of economic growth and open unemployment rate (TPT).Therefore, the objective of the study was to describe local government performance and to analyzed the determiant factor to develop the performance.The purpose of performance evaluation was to describe objective evaluation the government may use to make decision, develop organizational performance and develop accountability.
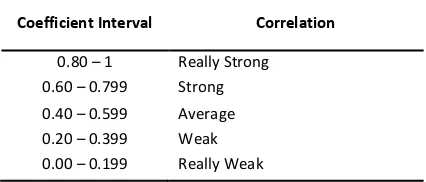
Data collection method referred to technique or method researchers conduct to gain data. The data collection method of the study was desk study, which refer to a method of collecting data and information by evaluating and analyzing data and information in the form of secondary data. The data analysis method was descriptive statistic analysis, correlational analysis. The analysis employed SPSS (Statistical Package for the Social Sciences) to obtain Pearson Correlation (r) score. The result of the analysis was interpreted using the following criteria:
Table 1. Correlation Score (r) Interpretation
Coefficient Interval Correlation
0.80 – 1 Really Strong 0.60 – 0.799 Strong 0.40 – 0.599 Average 0.20 – 0.399 Weak 0.00 – 0.199 Really Weak
Source: Riduwan as cited in [6]
FINDINGS AND DISCUSSIONS Economic Growth
In their 2016-2021 Middle-Term Development Planning of Local Government
(RPJMD), the government of Sidorajo has
58 macro indicators of economic welfare. As an
addition, economic growth is one of the elements of the Key Performance Indicator (IKU). The second mission of the 2016-2021 RPJMD through optimization of particular industry such as manufacturing, agriculture, fisheries and tourism, MSMEs and cooperatives as well as public empowerement and the fifth mission of the RPJMD is sufficient, qualified and environmentally sustainable public infrastructure as facilities for economic growth. Therefore, one should analyze growth of economy to find determinant factor developing the IKU so that the government of Sidorjo is able to establish and carry out their program and regulation. In addition, IKU allows the government to focus on the targeted performance based on the indicators they had established previously.
Prior to analyzing the determinant factors of the economic growth IKU achievement, one should identify various factors that may have correlation to economic growth based on the related literature and previous research. Gross Regional Domestic Product (GRDP) is one of the main factors used to analyze economic growth. According to the production approach, the Gross Regional Domestic Product (GRDP) is total value of final goods and services produced as the result of economic activities in an area subtracted by cost of each Gross Total Production (GTP) per sub sector or sector activity. Looking at the formula of economic growth proposed by the Central Bureau of Statistics (BPS), GRDP on the basis of Constant Price (ADHK) is a component used to calculate economic growth of a region each year. GRDP based on its understanding reflects the net economic output value generated by all economic activities in a region, while output according to Solow (as cited in [7]) is one of the variables that plays a major role in economic growth in addition to capital, labor and knowledge. Investment is inseparable part of creating economic growth because it is a major need in type of development that requires a growth rate. Investment is the first step in production activities and a factor to promote economic growth. Therefore, investment is essentially the first step in economic development activities. Rostow stated that any attempt to take-off requires mobilization of domestic and foreign savings with the intent to create sufficient investment, in order to accelerate economic growth [8]. Issues related to employment reviewed based on the number of unemployed are also a factor affecting the output of a region. The
Okun’s law, derived from Arthur Okun, an
economist who first studied it, can explain
relationship between unemployment and economic growth. The finding of his empirical study showed that one-point increase in unemployment will reduce GDP (Gross Domestic Product) by 2 percent. This means there is negative influence between unemployment and economic growth and vice versa between economic growth and unemployment. In addition, another factor that has a relationship with economic growth is inflation. According to [5], described inflation as a process of rising prices prevailing in the economics. Stable inflation is a prerequisite for sustainable economic growth and will provide benefits to welfare of the society. The relationship between inflation and economic growth has become an important economic issue. It has been disputed in the economic literature and has shown different relationship depending upon the world economic conditions [9]. The controversy between inflation and economic growth originated in Latin America in the 1950s, with debates between structuralists and monetarists [10]. The structuralists argued that inflation was important for economic growth, on the contrary, monetarist mentioned that inflation brought disadvantage to economic growth. In the 1970s, the growth rates began to decline due to high inflation rates, particularly high inflation and hyperinflation taking place in Latin American countries in the 1980s, resulting in the view that inflation had negative effect on economic growth [9].
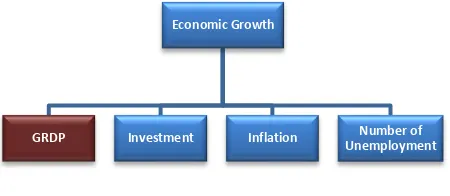
Based on the literatures and findings of the previous studies, the researcher developed a framework describing relationship between GRDP, capital/ investment, unemployment rate, inflation and economic growth discussed in the study.
Figure 1. Relationship between GRDP (Gross Regional Domestic Product), Capital/ Investment, Number of Unemployment, Inflation and Economic Growth Analysis Framework
GRDP relationship which is a variable of economic growth in the context of the study was seen based on the average growth rate generated by each sector of GRDP in Sidoarjo within the last 4
Economic Growth
GRDP Investment Inflation Number of
59 years. High/ significant growth generated by certain
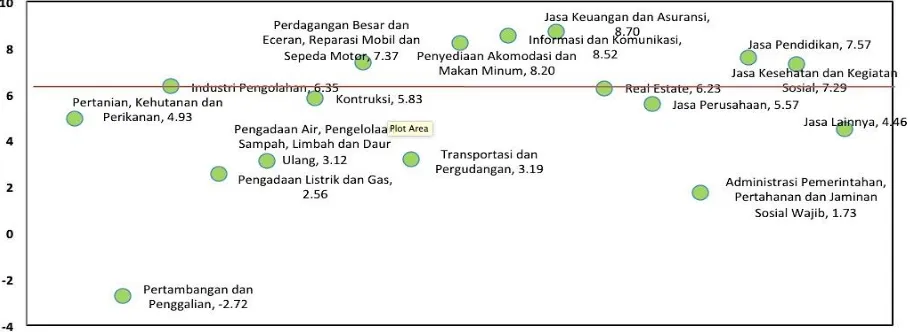
sectors in the GRDP structure of Sidoarjo over the last few years indicated that the sector had critical role in determining the economic growth in Sidoarjo. Based on the analysis, it was obtained that from 17 business sectors in the economic structure of Sidoarjo, there were 8 business sectors of which growth rates were beyond the average GRDP growth of Sidoarjo; the average GRDP growth of Sidoarjo was 6.19%. Some sectors of which growth rate was higher than that of Sidoarjo were manufacturing industry (6.35%), wholesale and retail, car and motorcycle repair (7.37%), accommodation and food (8.25%), information and communication (8.52%), financial services and insurance (8.70%), real estate (6.23%), education (7.57%) and health services and social activities (7.29%). (see Figure 2)
Change in structural economic was reflected by role of the sectors that developed Gross Regional Domestic Product (GRDP) in each sector of the economics. The role or contribution of the primary sectors (agriculture and mining) in the development of GRDP would decrease, and on the other hand, the role of the secondary sectors (manufacturing industry, real estate) and tertiary sector (services) would increase along with the growth of the regional economics. Among the sectors of which growth rate was higher than the average GDP growth, the sectors that became the determinant of economic growth in Sidoarjo were financial servcice and insurance, and financial intermediary service became the sub-sector, given that the sectors had the highest average growth within the last few years, besides the roles of the 7 other key sectors.
Furthermore, economic growth had relationship to other variables, including investment, inflation, and employment in terms of
the number of unemployment. Table 2 described data related to development of each of the variables.
Table 2. Types of Variables Correlated to the Economic Growth in Sidoarjon and Their Development between 2012 and 2015
Variable Year
2012 2013 2014 2015
Economic
Growth (%) 7.26 6.89 6.44 5.24 Investment
(Million of Rupiahs)
15,676,100 13,242,700 14,074,500 16,632,000
Inflation Rate
(%) 4.01 7.72 7.67 3.20
Number of Unemployment (person)
50,816 42,416 41,465 68,311
SPSS for Windows was the instrument to conduct the correlational analysis describing the relationship between investment, inflation rate, and the number of unemployment towards the economic growth in Sidoarjo. Table 3 described the result of the cotrrelational analysis.
Table 3. Correlational Analysis towards the Variables of the Economic Growth in Sidoarjo
Variable Pearson
Correlation
Criteria of the Correlation
Investment -0.543 Average
Inflation Rate 0.402 Average Number of
Unemployment -0.756 Strong
Further elaboration about the correlation for each of the variables was as follow:
60 of the analysis found that there was negative
relationship between the investment and economic growth meaning that increase in investment would reduce the economic growth in Sidoarjo. At glance, the finding was at the opposite to the general theories that investment was one of the biggest supporting factors of economic growth. Balasubramanyam, et.al (as cited in [11]) conducted similar study and found out that certain parameter of quality of human capital in a country that got investment determined whether or not FDI had positive impact towards the economic growth. They also revealed that FDI was complement to domestic investment. Li and Liu (as cited in [11]) conducted panel data analysis for 84 countries between 1970 and 1999 and observed that FDI interactions with human capital resulted in strong positive effect on the economic growth. Having made correlation between the result of the analysis and the findings of Balasubramanyam, et.al (as cited in [11])’s study, it may be concluded that the investment made in Sidoarjo to date had yet been productive. The cause was the capability of the human capital.
2. The correlation between the inflation rate and the economic growth was average. The correlation between the two was 0.402, which was categorized as average. The nature of the correlation was positive so these variables went hand-in-hand. An increase in the inflation rate would result to an increase in the economic growth in Sidoarjo. Basically, not all type of inflation had negative impact towards the economics. Low inflation rate taking place in Sidoarjo (lower than 10%) would boost growth of economics since inflation encouraged entrepreneurs to increase production. Price increase would lead to increasing production and eventually encourage entrepreneurs to obtain higher profit.
3. The number of unemployment had strong correlation to the economic growth. The correlation score between the two was 0.756. The nature of the correlation between the two was negative so the two variables were at the opposite. An increase in the economic growth of Sidoarjo would result in decreasing number of unemployment in the area. The economic growth basically described economic activities by business persons in Sidoarjo; increasing economic activities would lead to more job vacancy and minimize unemployment rate.
Having analyzed the three variables, the unemployment rate had strong correlationship to the economic growth and therefore, the output growth of GRDP, the unemployment rate, also became determinant factor of the economic growth in Sidoarjo.
Open Unemployment Rate (Tingkat
Pengangguran Terbuka/ TPT)
In their 2016-2021 Middle-Term Development Planning of Local Government
(RPJMD), the government of Sidorajo has
established that Open Unemployment Rate (TPT) is one indicator that the second mission of the 2016-2021 RPJMD has been achieved. The second vision states that the method to improve local/ regional economics was through optimization of particular industry such as manufacturing, agriculture, fisheries and tourism, MSMEs and cooperatives as well as public empowerement. Besides that, TPT was also one of the indicators of the IKU of the 2016-2021 RPJMD. Therefore, one should analyze TPT (Open Unemployment Rate) to find determinant factor developing the IKU so that the government of Sidorjo was able to establish and carry out their program and regulation. In addition, IKU allowed the government to focus on the targeted performance based on the indicators they had established previously.
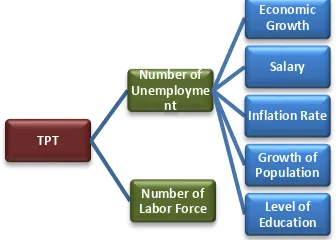
TPT indicaties working age population included in the unemployment group. TPT, according to the formula determined by the Central Bureau of Statistics (BPS), is calculated based on the ratio (percentage) between number of unemployment and total labor force. Looking at the definition, it can be seen that unemployment rate and the labor force are two main variables that developed the TPT. Looking at the literatures and previous research findings, it was predicted that the number of unemployment in Sidoarjo had relationship to other variables, such as: economic growth, salary, inflation, growth of population growth, and level of education.
61 every increase in economic growth would create job
and decrease unemployment rate. According to [13] explained correlation between salary and unemployment rate. Employee set minimum wage/ salary based on regional minimum wage; when the regional minimum wage was too low, the unemployment rate in the area was relatively high. On the other hand, based on employer’s perspective, increasing salary would increase cost and decrease efficiency; as the consequence, the employers would cut down employees to minimize cost of production. These increase number of unemployed individuals.The first study discussing the correlation between inflation and unemployment rate was conducted by [14] and the finding was well-known as the Phillips Curve. The inverse relationship between the unemployment rate and the inflation rate was shown by the Phillips curve in which the parabolic image headed upwards. The effect of population growth towards the unemployment rate or labor market showed that population growth had important implication towards employment. According to Oberai (as cited in [15]), rapid population growth without greater investment proportion caused lack of employment, increase unemployment rate and prevented structural transformation in the workforce. Unemployment was also closely related to the quality of human resources through the level of educational indicating the high and low quality of education employees had. The relationship
between education background and
unemployment may also be explained using the signaling and screening theory. The theory explained that job applicants may consider their education background as "warranty card" or guarantee.
The formula to obtain the TPT, related literatures and findings of the previous studies about the relationship between the variables may function as framework for analysis that elaborate unemployment rate in detail and its relation to TPT.
Figure 3. Open Unemployment Rate Analysis Framework and Relationship between Economic
Growth, Salary, Inflation Rate, Growth of Population as well as Background of Education and Numbner of Unemployment
Prior to analyzing the relationship between the economic growth, salary, inflation, growth of number of labor force in Sidoarjo within the last few years.
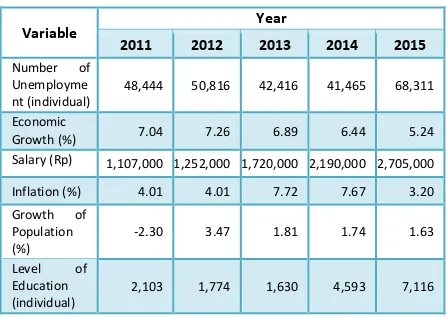
Table 4. Open Unemployment Rate (TPT), Number of
Unemployment and Number of Labor Force in Sidoarjo between 2011 and 2015
Referring to the unemployment rate and number of labor force within the last 5 years, the average unemployment rate per year was 12.72%, while the annual growth of labor force was 1.61% and as the consequence, the average TPT increased 0.39% every year. Based on the data, annual increase of unemployment rate within the last 4 years;
2. There was tendency that number of labor force increased as the growth of population. When the number of labor increased and unemployment rate decreased, TPT would grow smaller.
62 Based on the analysis, having compared
the unemployment rate and labor force, the earlier variable had more significant influence towards TPT. Therefore, between the two variables, unemployment rate was the determinant factor of TPT in Sidoarjo.
Unemployment was closely related to the current economic growth. Rapid economic growth would create positive business climate and eventually, create more job. At the opposite, slow economic growth would increase unemployment rate. As an addition, based on the literatures and previous related studies, unemployment rate was also closely related to other variables such as salary, inflation, growth of population and level of education. Table 5 describes the annual development of each of the variables; these were the bases for the correlational analysis.
Table 5. Variables Correlated to Unemployment Rate in Sidoarjo and their Development between 2011 and 2015
Salary (Rp) 1,107,000 1,252,000 1,720,000 2,190,000 2,705,000
Inflation (%) 4.01 4.01 7.72 7.67 3.20
The SPSS for Windows was the instrument to describe the correlation between the economic growth, salary, inflation, growth of population as well as the level of education and the unemployment rate in Sidoarjo. Table 6 described the result of the analysis.
Table 6. Correlational Analysis of the Unemployment Rate in Sidoarjo
Variable Pearson
Correlation Criteria
Economic Growth -0.743 Strong
Salary 0.505 Average
Inflation -0.802 Very Strong
Growth of Population 0.063 Very Weak
Level of Education 0.698 Strong
Further elaboration about the correlation between the variables was as follow:
1. There was strong correlation between the inflation and unemployment rate. The Pearson correlation score was 0.802, and therefore, fell into very strong category. The nature of the relationship was negative so these two was inversely proportional. Increasing inflation would result in increasing unemployment rate in Sidoarjo. It corroborated to A.W. Phillips (1958)’s theory where increasing the two aspects contributed to inflation were increasing demand of goods and increasing number of offer. Increasing demand of goods and increasing number of offer would encourage the manufacturer/ entrepreneurs in Sidoarjo to hire more employees to keep up with production. These would decrease unemployment rate. 2. There was strong correlation between the
economic growth and unemployment rate. The Pearson correlation score was 0.743. The nature of the correlation between the tow was negative so they were inversely proportional. Positive economic growth in Sidoarjo would decrease unemployment rate in the area. Growth of economics basically described economic activities of manufacturers/ entrepreneurs in Sidoarjo; increasing economic activities would create mote job vacancy and decrease unemployment rate in Sidoarjo.
3. There was a level of education has a strong relationship with the variable number of unemployed. The strength of the relationship can be seen from the correlation value of 0.698. Positively related relationships indicate that the nature of the relationships of the two variables is unidirectional. So with the increasing number of job seekers who are educated high school upwards will tend to be followed by an increase in the number of unemployed in Sidoarjo regency, because job opportunities available in each year is still limited and each job vacancy has specific requirements specifications that not all job seekers can meet the requirements Desired by the employer.
4. There was average correlation between salary and unemployment rate. The Pearson correlation score was between 0.40 and 0.599. The nature of the correlation was positive describing that although salary gradually increased every year, the unemployment rate kept increasing due to limited job vacancy. Furthermore, seen from the entrepreneur/
manufacture’s point of view, manufacturer/
63 and reduce cost of production when salary
increased. As the result, they opted to decrease labor for the sake of efficiency. In the formal sector, there was strong correlation between salary and unemployment rate; however, in the informal sector, the correlation between the two was really weak.
5. There was positive correlation between growth of population and unemployment rate, but the degree of the correlation was really low (between 0.00 and 0.199). Various growth of population contributed to such low degree of correlation. The growth of population caused by nativity did not contribute to unemployment rate because new-born was not categorized as working group. Furthermore, the majority of migrants in Sidoarjo moved to the area due to their job. Therefore, the current growth of population in Sidoarjo had weak correlation to the unemployment rate in the area.
Based on the analysis towards the 5 variables, it was concluded that the economic growth and the level of education had strong relationship to the unemployment rate, while the inflation had very strong relationship to the unemployment rate. Thus, the three variables were the determinant factors of the unemployment rate in Sidoarjo.
CONCLUSION
Based on the findings and the analyses, the conclusion is elaborated as follow:
Having analyzed the average growth of economic sectors in Sidoarjo, financial service and insurance are the determinant factors that determine the economic growth in Sidoarjo and financial intermediary service is the sub-factor. Furthermore, the correlation between the three variables (investment, inflation, and unemployment rate) and economic growth, the unemployment rate is variable that has strong correlation to the economic growth and the determinant factor of the economic growth in Sidoarjo.
Having analyzed the role of unemployment rate towards TPT in Sidoarjo, unemployment rate is the determinant factor that determines TPT in Sidoarjo, while the determinant factors of the unemployment rate are inflation, economic growth and education background.
In order to achieve the IKU targets, more particularly one related to economic growth and TPT, the government of Sidoarjo should focus on developing financial and insurance sector besides the other 7 potential sectors; these should be directed towards increasing output and creating
more job vacancy. Furthermore, the government should conduct some training and workshop in order that future employees can meet requirement of the labor market. At last, they should maintain inflation specifically one related to basic need/ food since inflation affects purchasing power.
ACKNOWLEDGMENT
The researcher would like to thank Research Team from the Laboratory of Public Policy and Development Planning (Laboratorium
Kebijakan Publik dan Perencanaan Pembangunan/
LKP3) Faculty of Administration Science Brawijaya University, Government of Sidoarjo, more particularly Local Development Planning Agency of Sidoarjo and all institutions as well as individuals for their contribution to the study.
REFERENCES
[1] Indonesia, The 2014 Decree number 23 about
Local Government. Jakarta, 2014.
[2] Indonesia, The 2004 Decree number 25 about
National Development Planning System.
Jakarta, 2004.
[3] Sadono Sukirno, Ekonomi Pembangunan Proses, Masalah dan Dasar Kebijakan
Pembangunan. Jakarta: UI-Press, 2000.
[4] Gregory N Mankiw, Pengantar Ekonomi
Makro, Third Edition ed. Jakarta: Salemba
Empat, 2006.
[5] Sadono Sukirno, Makroekonomi: Teori
Pengantar. Jakarta: PT Raja Grafindo Persada,
2004.
[6] Haryadi dan Winda Julianita Sarjono, SPSS vs LISREL: Sebuah Pengantar, Aplikasi untuk
Riset. Jakarta: Salemba Empat, 2011.
[7] Eva, Haryadi, Amril Riani, "Faktor Penentu Pertumbuhan Ekonomi Kabupaten Bungo,"
Jurnal Perspektif Pembiayaan dan
Pembangunan Daerah, vol. Vol. 2 No. 1,
Juli-September 2014.
[8] Michael P, dan Smith, Stephen C Todaro,
Pembangunan Ekonomi di Dunia Ketiga, Eight
Edition ed. jakarta: Erlangga, 2004.
[9] Erbaykal, Erman, Okuyan, and H.Aydin, "Does inflation Depress Economic Growth? Evidence from Turkey," nternational Research Journal
of Finance and Economics, 2008.
64
Development Journal, vol. Voi.8, No.1, June
2001.
[11] A Khaliq and I Noy, "Foreign Direct Investment and Economic Growth: Empirical Evidence from Sectoral Data in Indonesia," Working
paper, University of Hawaii, 2007.
[12] L Arsyad , Pengantar Perencanaan dan
Pembangunan Ekonomi Daerah, First Edition
ed. Yogyakarta: BPFE, 2000.
[13] Kaufman and Hotchkiss Julie, The Economics
Of Labor Market, Fifth Edition ed.: The Dryden
Press.
[14] A.W. Phillips, The Relation Between Unemployment and the Rate of Change of Money Wage Rates in the United Kingdom.
1861-1957. UK: Economica 25, 1958.
[15] Farid Alghofari, "Analisis Tingkat Pengangguran di Indonesia Tahun 1980-2007," Jurnal Ilmiah Pengangguran, vol. Vol.1 (No.2), 2010.
[16] Minister of the Utilization of the Government Apparatus, The State of the Utilization of the
Government Apparatus
PER/20/M.PAN/11/2008 about Guideline for
Key Performance Indicator Development.
Jakarta, 2008.
[17] Government of Sidoarjo, Midium-Term Development Planning of Local Government
(RPJMD) of Sidoarjo 2016-2021. Sidoarjo,