AGRIVITA VOLUME 36 No. 2 JUNE - 2014 ISSN : 0126-0537
http://dx.doi.org/10.17503/Agrivita-2014-36-2-p101-111
DISSECTING QUANTITATIVE TRAIT LOCI FOR AGRONOMIC TRAITS RESPONDING
TO IRON DEFICEINCY IN MUNGBEAN [
Vigna radiata
(L.) Wilczek]
Prakit Somta1), Prayoon Prathet 1,2), Alisa Kongjaimun1) and Peerasak Srinives 1 *)
1)
Department of Agronomy, Faculty of Agriculture at Kamphaeng Saen, Kasetsart University Kamphaeng Saen, Nakhon Pathom 73140, Thailand
2)
Center of Advanced Studies for Agriculture and Food, KU Institute for Advanced Studies, Kasetsart University, Bangkok 10900, Thailand (CASAF, NRU-KU, Thailand)
*) Corresponding author Phone: +66-34-281267 E-mail: [email protected]
Received: April 23, 2014 /Accepted: May 6, 2014
ABSTRACT
Calcareous soil is prevalent in many areas causing substantial yield loss of crops. The research previously identified two quantitative trait locus (QTL) qIDC3.1 and qIDC2.1 controlling leaf chlorosis in mungbean grown in calcareous soil in 2010 and 2011 using visual score and SPAD measurement in a RIL population derived from KPS2 (susceptible) and NM10-12-1 (resistant). The two QTLs together accounted for 50% of the total leaf chlorosis variation and only qIDC3.1 was confirmed, although heritability estimated for the traits was 91.96%. It detected QTLs associated with days to flowering, plant height, number of pods, number of seeds per pods, and seed yield in the same population grown under the same environment with the aim to identify additional QTLs controlling resistance to calcareous soil in mungbean. Single marker analysis revealed 18 simple sequence repeat markers, while composite interval mapping identified 33 QTLs on six linkage groups (1A, 2, 3, 4, 5 and 9) controlling the five agronomic traits. QTL cluster on LG 3 coincided with the position of qIDC3.1, while QTL cluster on LG 2 was not far from qIDC2.1. The results confirmed the importance of qIDC3.1 and qIDC2.1 and revealed four new QTLs for the resistance to calcareous soil.
Keywords: alkaline soil, calcareous soil, green gram, yield-related traits
INTRODUCTION
Mungbean (Vigna radiata (L.) Wilczek) is an important source of protein in South and
Southeast Asia. It is mainly cultivated in Bangladesh, China, India, Indonesia, Myanmar, Pakistan, the Philippines, Sri Lanka, Thailand, and Viet Nam. In Thailand and the Philippines, planting area of mungbean is more than any other legume crops. Seed of mungbean is an inexpensive source of dietary proteins and amino acids for common people and vegetarians in the region. One of the key targets of mungbean breeding programs is to develop high yielding varieties. However, yield is the most complex trait in crops. It is directly determined by three yield-component traits (pod number, seed number per pod, and seed size) and is also indirectly influenced by other yield-related traits such as plant height, branch number, and resistance to biotic and abiotic stresses. Each of these traits is complex and quantitatively controlled by polygenes. Hence, it is difficult to accurately evaluate and select for high yield trait in conventional breeding programs, owing to the interplay between genotype and environment and the in all growth and development stages (Quarrie et al., 2006).
Thailand is a major producer and exporter of mungbean seeds and products with the main production in the lower north and upper central regions. In these regions, high pH soil appears in patches across several hundred thousand hectares. Yield loss due to iron deficiency has been observed in most high yielding mungbean varieties (Nopparat et al., 1997). The susceptible varieties show significantly lower yield and yield-related traits as compared to the resistant ones. Recently, QTLs controlling resistance to iron deficiency in mungbean have been identified (Prathet et al., 2012). The research reported one major and one minor QTLs for leaf chlorosis in a
Prakit Somta et al.: Dissecting Quantative Trait Loci for Agronomic Traits………
RIL population grown in iron deficient field in two years. The major QTL was located on linkage group 3, and was named as qIDC3.1. qIDC3.1 was consistently detected in two years by visual scoring and greenness (soil-plant analysis development; SPAD) measurement of leaves, whereas the minor QTL (qIDC2.1) was detected in only one year by visual scoring. Although heritability of the resistance measured by SPAD values was as high as 91.96%, the detected QTLs explained less than 40% of trait variation. Thus it appears that additional QTL(s) conditioning the resistance undetectable in the study of Prathet et al. (2012). The nutrient use efficiency of a genotype is defined as the ability to produce higher yield in soils with limited nutrient supplies. A better understanding of genetic control of the macro- or micronutrient deficiency can be achieved by QTL mapping of yield and yield-related traits as demonstrated by Zhao et al. (2012) and Shi et al. (2013). In mungbean, the information of QTLs for yield and yield-related traits under iron deficiency is not known, although these traits can be employed as indicators for measuring resistance to iron deficiency.
The objective of this study was to identify QTLs for agronomic, yield and yield-related traits under iron deficiency using a RIL population.
MATERIALS AND METHODS identifying QTLs controlling leaf chlorosis grown under calcareous soil, and mungbean yellow mosaic India virus (MYMIV) disease, respectively. In brief, an F1 seed from the cross was grown, self-fertilized and generations advanced as F2-derived lines by single seed agarose gel stained with ethidium bromide.
Traits Measurement
Field experiments were carried out at Nakhon Sawan Field Crops Research Center, Nakhon Sawan province, Thailand in the dry season (March-May) of 2010 and 2011. The soil in this field had pH of 7.92, 2.1% organic matter, 17.83 mg/kg of available P, 97.01 mg/kg of exchangeable K, 15,883 mg/kg of exchangeable Ca, 499.63 mg/kg of exchangeable Mg, 0.99 mg/kg of extractable Fe, 13.62 mg/kg of extractable Mn, 1.63 mg/kg of extractable Cu, and 0.47 mg/kg of extractable Zn.
The 122 RILs and their parents were Irrigation was performed at 7-days interval. Pesticides were applied as per a standard recommendation for mungbean (Park 1978). In both experiments, five agronomic traits, namely days to flowering (DF), plant height (PH; cm), number of pods per plant (PN), number of seeds per pod (SN), and seed yield per plant (SY; g) were recorded. Five competitive plants of each row were randomly chosen and used for trait measurement. The average data from five plants was used for further analysis.
Linkage Map and QTL Analysis
Prakit Somta et al.: Dissecting Quantative Trait Loci for Agronomic Traits………
0.50. Map distance in centimorgan (cM) was calculated using Kosambi mapping function (Kosambi, 1944).
For QTL analysis, markers associated with a trait were each determined by single regression analysis at P < 0.01 using R-program version 2.10.0 (R Development Core Team 2010). Then the software WinQTL Cartographer version 2.5 (Wang et al., 2012) was used to locate QTLs for the traits by composite interval mapping (CIM) with standard model (model 6),
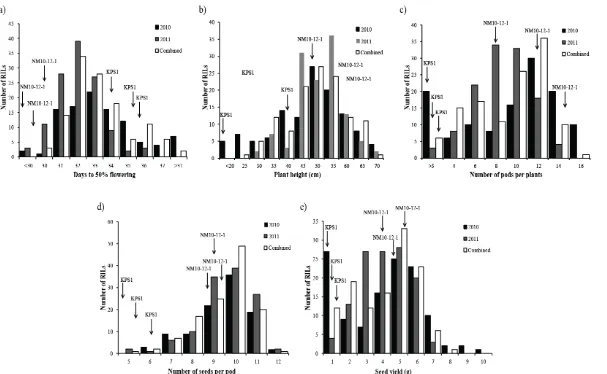
“window size” of 10 cM, and forward regression. Walking speed was set at 1 cM. Significant threshold for the QTLs of each trait was computed by 1,000 runs of a permutation testat P = 0.01. combined data are presented in Table 1. A wide variation was observed for all the traits between the two parents and among the RILs in both years. In all cases, the trait values of NM10-12-1 were higher than those of KPS2 (Table 1). For all traits, frequency distributions were continuous and segregations were transgressive. These suggested that the traits are controlled by polygenes and one parent possessed alleles for increased values and the other for decreased value.
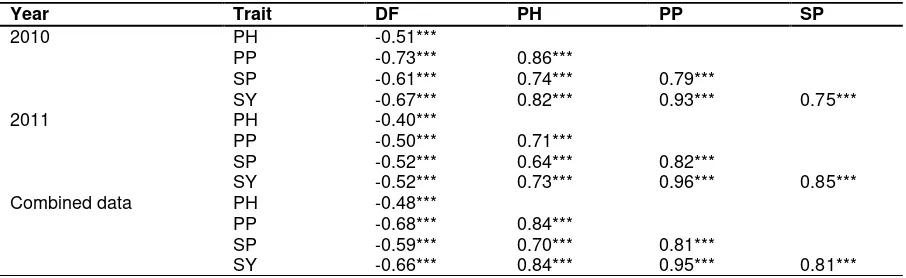
Correlation analysis among days to flowering, plant height, seed yield, and yield-the oyield-ther traits,that showed positive correlation between each others. The correlation among the traits suggested that they may be controlled by some common genetic factors.
QTLs for Mungbean Yield and Yield-Related Traits Grown Under Calcareous Soil
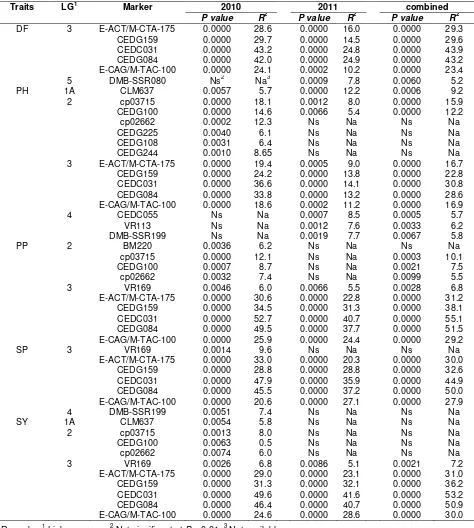
Single marker analysis revealed markers on LGs 1A, 2, 3, 4, 5 and 9 associate
with DF, PH, PP, SP and SY of the mungbean RILs (Table 3). Five markers on LG3, including E-ACT/M-CTA-175, CEDG159, CEDC031, CEDG084 and E-CAG/M-TAC-100, showed consistent association with all the traits. In general, these markers explained more than 30% of the trait variation. The rest of the significant markers accounted for less than 10% of the trait variation, with exception to a few of them.
Composite interval mapping was carried out to locate QTLs controlling yield and yield-related traits responded to calcareous soil onto the linkage map. In total, 33 QTLs were identified for the five traits (Table 2). In 2010, a major QTL with one or four minor QTLs were found for PH, PP, SP and SY but only one (major) QTL was identified for DF. Major QTLs for these traits were all overlapped on LG 3 (Fig. 2). The major QTLs explained between 44.29% and 60.50% of the trait variation, depending on traits. At all detected QTLs, except qSP4.1_2010, alleles from NM10-12-1 increased trait values. A cluster of minor QTLs for PH, PP, SP and SY was found on LG 2, while additional minor QTLs were identified two each on LG 4 and LG 9. In most cases, the minor QTLs accounted for less than 10% of trait variation.
In 2011, QTL analysis showed similar results to that in 2010. The results revealed that a major QTL with one to three minor QTLs control DF, PH, PP, SP and SY. The locations of major QTLs for five traits were similar to those found in 2010. The major QTLs explained 18.22% to 50.55% of the trait variation. Similar to 2010 data, in most cases, alleles from NM10-12-1 increased trait values. Again, minor QTLs for PH, PP and SY were identified on LG 2 and accounted for less than 10% of the trait variation.
AGRIVITA VOLUME 36 No. 2 JUNE - 2014 ISSN : 0126-0537
http://dx.doi.org/10.17503/Agrivita-2014-36-2-p101-111
Table 1. Minimum, maximum, mean, and standard deviation (SD) values of days to flowering (DF), plant height (PH), number of pods per plant (PN), number of seeds per pod (SN), and seed yield per plant (SY) in the mungbean RIL population of KPS2 x NM10-12-1 grown in calcareous soil in Thailand in 2010 and 2011
DF PH PP SY SP
2010 2011 combined 2010 2011 combined 2010 2011 combined 2010 2011 combined 2010 2011 combined min 29.00 29.00 29.50 15.53 25.33 20.43 0 1.33 0.67 0 0.48 0.24 5.57 4.31 4.75 max 41.00 36.00 38.00 70.10 68.93 68.72 16.85 13.07 14.66 9.95 6.22 6.77 11.08 11.42 11.16 mean 33.90 31.68 32.79 45.62 48.37 47.00 8.65 7.56 8.10 3.58 3.56 3.57 8.94 9.01 8.93
SD 2.95 1.33 1.83 12.65 7.69 9.81 4.71 2.59 3.42 2.36 1.38 1.74 1.33 1.28 1.25
104
Pra
k
it
S
o
m
ta
e
t
a
l.:
Dis
se
cti
ng
Q
ua
nta
tiv
e Tra
it L
oc
i fo
r Ag
ro
no
m
ic T
ra
its
………
Prakit Somta et al.: Dissecting Quantative Trait Loci for Agronomic Traits………
Table 2. Correlation among days to flowering (DF), plant height (PH), number of pods per plant (PP), number of seeds per pod (SP) and seed yield per plant (SY) in the mungbean RIL population (KPS2 x NM10-12-1) grown in calcareous soil in Thailand in 2010 and 2011
Year Trait DF PH PP SP
2010 PH -0.51***
PP -0.73*** 0.86***
SP -0.61*** 0.74*** 0.79***
SY -0.67*** 0.82*** 0.93*** 0.75***
2011 PH -0.40***
PP -0.50*** 0.71***
SP -0.52*** 0.64*** 0.82***
SY -0.52*** 0.73*** 0.96*** 0.85*** Combined data PH -0.48***
PP -0.68*** 0.84***
SP -0.59*** 0.70*** 0.81***
SY -0.66*** 0.84*** 0.95*** 0.81*** Remarks: *** Significant at P = 0.001
DISCUSSION
Iron (Fe) is one of the most important micronutrients which is required for the formation of chlorophyll in plant cells. Fe is taken up by plants as ferrous ions (Fe++). In calcareous soils, iron-inefficient mungbean genotypes often display deficiency symptoms which affect seed yield and yield component in crops. In this study, field trials were conducted under iron deficiencyfor two years to identify QTLs for days to flowering (DF), seed yield (SY) and yield-related traits (SN, PN, and PH), using an F8 RIL population of mungbean derived from a cross between two cultivars, ‘KPS2’ and
‘NM10-12-1’. The parents showed significant differences in the seed yield and yield-related traits under iron deficiency with NM10-12-1 showed higher values of all the traits. In the RIL population, considerable transgressive segregation was observed for all the traits under iron deficiency chlorosis (IDC) except for SN (Fig. 1). Similar results were reported by Zhao et al. (2012) and Shi et al. (2013) who reported respectively that Brassica napus grown under boron and phosphorus deficiency showed highly variation in PH, SP, PP and especially SY.
In total, 24 QTLs associated with DF, PH, SP, PP and SY of the RIL population were detected in two years and combined data (Table 4). All except one of these QTLs were clustered onto four main genomic regions of LGs 1A, 2, 3,
Prakit Somta et al.: Dissecting Quantative Trait Loci for Agronomic Traits………
Table 3. Markers associated with days to flowering (DF), plant height (PH), number of pods per plant (PP), number of seeds per pod (SP) and seed yield per plant (SY) determined by regressions analysis in the mungbean RIL population of KPS2 x NM10-12-1 grown in calcareous soil in Thailand in 2010 and 2011
Traits LG1 Marker 2010 2011 combined
P value R2 P value R2 P value R2
DF 3 E-ACT/M-CTA-175 0.0000 28.6 0.0000 16.0 0.0000 29.3 CEDG159 0.0000 29.7 0.0000 14.5 0.0000 29.6 CEDC031 0.0000 43.2 0.0000 24.8 0.0000 43.9 CEDG084 0.0000 42.0 0.0000 24.9 0.0000 43.2 E-CAG/M-TAC-100 0.0000 24.1 0.0002 10.2 0.0000 23.4 5 DMB-SSR080 Ns2 Na3 0.0009 7.8 0.0060 5.2 PH 1A CLM637 0.0057 5.7 0.0000 12.2 0.0006 9.2 2 cp03715 0.0000 18.1 0.0012 8.0 0.0000 15.9 CEDG100 0.0000 14.6 0.0066 5.4 0.0000 12.2
cp02662 0.0002 12.3 Ns Na Ns Na
CEDG225 0.0040 6.1 Ns Na Ns Na
CEDG108 0.0031 6.4 Ns Na Ns Na
CEDG244 0.0010 8.65 Ns Na Ns Na
3 E-ACT/M-CTA-175 0.0000 19.4 0.0005 9.0 0.0000 16.7 CEDG159 0.0000 24.2 0.0000 13.8 0.0000 22.8 CEDC031 0.0000 36.6 0.0000 14.1 0.0000 30.8 CEDG084 0.0000 33.8 0.0000 13.2 0.0000 28.6 E-CAG/M-TAC-100 0.0000 18.6 0.0002 11.2 0.0000 16.9 4 CEDC055 Ns Na 0.0007 8.5 0.0005 5.7 VR113 Ns Na 0.0012 7.6 0.0033 6.2 DMB-SSR199 Ns Na 0.0019 7.7 0.0067 5.8
PP 2 BM220 0.0036 6.2 Ns Na Ns Na
cp03715 0.0000 12.1 Ns Na 0.0003 10.1 CEDG100 0.0007 8.7 Ns Na 0.0021 7.5 cp02662 0.0032 7.4 Ns Na 0.0099 5.5 3 VR169 0.0046 6.0 0.0066 5.5 0.0028 6.8 E-ACT/M-CTA-175 0.0000 30.6 0.0000 22.8 0.0000 31.2 CEDG159 0.0000 34.5 0.0000 31.3 0.0000 38.1 CEDC031 0.0000 52.7 0.0000 40.7 0.0000 55.1 CEDG084 0.0000 49.5 0.0000 37.7 0.0000 51.5 E-CAG/M-TAC-100 0.0000 25.9 0.0000 24.4 0.0000 29.2
SP 3 VR169 0.0014 9.6 Ns Na Ns Na
E-ACT/M-CTA-175 0.0000 33.0 0.0000 20.3 0.0000 30.0 CEDG159 0.0000 28.8 0.0000 28.8 0.0000 32.6 CEDC031 0.0000 47.9 0.0000 35.9 0.0000 44.9 CEDG084 0.0000 45.5 0.0000 37.2 0.0000 50.0 E-CAG/M-TAC-100 0.0000 20.6 0.0000 27.1 0.0000 27.9
4 DMB-SSR199 0.0051 7.4 Ns Na Ns Na
SY 1A CLM637 0.0054 5.8 Ns Na Ns Na
2 cp03715 0.0013 8.0 Ns Na Ns Na
CEDG100 0.0063 0.5 Ns Na Ns Na
cp02662 0.0074 6.0 Ns Na Ns Na
AGRIVITA VOLUME 36 No. 2 JUNE - 2014 ISSN : 0126-0537
http://dx.doi.org/10.17503/Agrivita-2014-36-2-p101-111
Table 4. Quantitative trait loci for five agronomic traits detected by composite interval mapping in the RIL population of KPS2 x NM10-12-1 grown in calcareous soil in Thailand in 2010 and 2011
Trait Year QTL name LG1 Marker interval Position2 LOD
score
PVE3 (%)
Additive effect
Days to flowering (DF) 2010 qDF3.1_2010 3 CEDC031 – CEDG084 127.9 18.53 51.01 2.18
2011 qDF3.1_2011 3 CEDG084 – E-CAG/M-TAC100 128.5 12.12 31.24 0.79
qDF5.1_2011 5 DMB-SSR080 – CEDG014 0.1 3.40 7.54 0.37
Combined qDF3.1_combined 3 CEDG084 – E-CAG/M-TAC100 128.5 20.45 47.58 1.29
Plant height (PH) 2010 qPH2.1_2010 2 BM220 – cp03715 24.00 12.31 22.46 -6.10
qPH3.1_2010 3 CEDC031 – CEDG084 127.9 21.51 44.29 -8.57
2011 qPH1.1_2011 1A VR194 – CLM637 53.0 3.36 13.82 2.95
qPH2.1_2011 2 BM220 – cp03715 20.00 4.40 12.75 -2.76
qPH3.1_2011 3 CEDG084 – E-CAG/M-TAC100 133.50 6.79 18.22 -3.37
Combined qPH11.1_combined 1A VR194 – CLM637 45.0 2.98 9.64 3.02
qPH2.1_combined 2 BM220 – cp03715 21.01 3.68 21.56 -3.16
qPH3.1_combined 3 CEDC031 – CEDG084 126.90 17.0 32.74 -5.42
qPH4.1_combined 4 VR113 – DMB-SSR199 79.15 2.72 4.42 2.09
Number of pods per plant (PP)
2010 qPP2.1_2010 2 BM220 – cp03715 23.0 3.34 5.58 -1.49
qPP3.1_2010 3 CEDG159 – CEDDC031 123.5 27.40 60.50 -3.71
2011 qPP2.1_2011 2 BM220 – cp03715 26.10 3.33 6.40 -0.66
qPP3.1_2011 3 CEDC031 – CEDG084 125.9 11.99 45.32 -1.77
Combined qPP2.1_combined 2 BM220 – cp03715 23.00 10.31 16.89 -1.42
qPP3.1_combined 3 CEDG159 – CEDDC031 124.50 28.51 60.93 -2.69
Number of seeds per pod (SP)
2010 qSP2.1_2010 2 CEDG108 – CEDG244 69.8 2.79 5.42 -0.34
qSP3.1_2010 3 CEDC031 – CEDG084 126.9 20.35 54.73 -1.05
qSP4.1_2010 4 VR113 – DMB-SSR199 79.15 3.31 5.44 2.32
qSP5.1_2010 9 CEDG304 – CEDG172 69.4 2.60 6.33 -0.34
2011 qSP2.1_2011 2 CEDG108 – CEDG244 62.8 2.65 5.42 -0.31
qSP3.1_2011 3 CEDC031 – CEDG084 127.9 15.25 40.91 -0.83
Combined qSP2.1_combined 2 CEDG108 – CEDG244 69.80 2.84 5.32 -0.34
qSP3.1_combined 3 CEDC031 – CEDG084 126.90 3.29 40.10 -1.05
qSP4.1_combined 4 VR113 – DMB-SSR199 79.15 2.92 5.98 2.32
qSP9.1_ combined 9 CEDG304 – CEDG172 69.40 19.53 6.54 -0.34
Seed yield (SY) 2010 qSY2.1_2010 2 CEDG100 – cp02662 35.7 6.13 10.92 -0.79
qSY3.1_2010 3 CEDG159 – CEDDC031 123.5 25.30 59.90 -1.85
2011 qSY2.1_2011 2 CEDG108 – CEDG244 62.8 3.61 6.50 -0.36
qSY3.1_2011 3 CEDG159 – CEDDC031 124.5 19.92 50.55 -1.00
qSY9.1_ 2011 9 VR098 – cp01225 132.7 3.12 5.66 0.41
Combined qSY2.1_combined 2 cp02662– CEDG225 47.7 6.94 11.64 -0.60
qSY3.1_combined 3 CEDC031 – CEDG084 126.9 26.12 57.91 -1.35
qSY9.1_combined 9 CEDG304 – CEDG172 67.8 3.50 4.87 -0.39
Remarks: 1 Linkage group, 2 Position of detected QTL on the linkage group, 3 Phenotypic variance explained by the QTL
107
Pra
k
it
S
o
m
ta
e
t
a
l.:
Dis
se
cti
ng
Q
ua
nta
tiv
e Tra
it L
oc
i fo
r Ag
ro
no
m
ic T
ra
its
………
Prakit Somta et al.: Dissecting Quantative Trait Loci for Agronomic Traits………
Figure 1. Frequency distribution of days to 50% flowering (a), plant height (b), number of pods per plant (c) , number of seeds per pod (d), and seed yield per plant (e) of the RIL population of KPS2 x NM10-12-1 grown in calcareous soil in Thailand in 2010 and 201
108
Pra
k
it
S
o
m
ta
e
t
a
l.:
Dis
s
e
c
ti
n
g
Q
u
a
n
ta
ti
v
e
Tra
it L
o
c
i f
o
r
Ag
ro
no
m
ic T
ra
its
………
Prakit Somta et al.: Dissecting Quantative Trait Loci for Agronomic Traits………
Figure 2. Positions of QTLs for days to flowering, plant height, number of pods per plant, number of seeds per pod, and seed yield per plant on linkage groups of the RIL population of KPS2 x NM10-12-1 grown in calcareous soil in Thailand in 2010 and 2011
Although Prathet et al., (2012) found that a QTL on LG 2, qIDC2.1, also involved in the leaf chlorosis in 2010, the authors failed to confirm its existence in the following year. However, this study showed and confirmed the association between qIDC2.1 and resistance to iron deficiency, and also demonstrated the involvement of four additional minor QTLs, one each on LG 1 (qIDC1.1), LG4 (qIDC4.1), LG5 (qIDC5.1) and LG9 (qIDC9.1) for the resistance. Altogether, the results reported by Prathet et al., (2012) and from our study showed that as high as six (one major and five minor) QTLs control resistance to iron deficiency in mungbean. This is in agreement with the studies in soybean that the resistance to iron deficiency is a complex trait being controlled by a major QTL with three
to four minor QTLs (Lin et al., 1997; Lin et al., 2000). However, it is noteworthy that qIDC1.1 was only found in 2010 using days to flowering.
CONCLUSIONS AND SUGGESTIONS
CONCLUSSIONS
Prakit Somta et al.: Dissecting Quantative Trait Loci for Agronomic Traits………
previously using leaf chlorosis score and SPAD values in the same population, and revealed four new QTLs for the resistance as measured from yield and yield-related traits.
SUGGESTIONS
A major QTL controlling resistance to iron deficiency was located on the linkage group 3 franking by SSR markers CEDC031 and CEDG084. These two markers can be used for marker-assisted selection of mungbean resistance to iron deficiency. Four additional QTLs can also considered if the breeder wants to accumulate more resistance genes with yield benefit in the selected mungbean genotypes.
ACKNOWLEDGEMENTS
This research was funded by the Center of Advanced Studies for Agriculture and Food, Institute for Advanced Studies, Kasetsart University under the National Research University Program of Office of the Higher Education Commission, Ministry of Education, Thailand.
REFERENCES
Blair, M.W., F. Pedraza, H.F. Buendia, E. Gaitán-Solís, S.E. Beebe, P. Gepts and J. Thome. 2003. Development of a genome-wide anchored microsatellite map of common bean (Phaseolus vulgaris L.). Theor. Appl. Genet. 107: 1362–1374.
Buso, G.S.C., Z.P.S. Amaral, R.P.V. Brondani and M.E. Ferreira. 2006. Microsatellite markers for the common bean Phaseolus vulgaris. Mol. Ecol. Notes. 6: 252–254.
Chankaew, S., P. Somta, W. Sorajjapinun and P. Srinives. 2011. Quantitative trait loci mapping of Cercospora leaf spot resistance in mungbean, Vigna radiata (L.) Wilczek. Mol. Breed. 28:255–264. Guerra-Sanz, J.M. 2004. New SSR markers of
Phaseolus vulgaris from sequence databases.Plant Breed. 123:87–89.
Isemura, T., A. Kaga, S. Tabata, P. Somta, P. Srinives, T. Shimizu, U. Jo, D.A. Vaughan and N. Tomooka. 201 2. Construction of a genetic linkage map and genetic analysis of domestication related traits in mungbean (Vigna radiata). PLoS ONE 7(8): e41304. doi: 10.1371/jou rnal.pone.0041304.
Kajonphol, T., C. Sangsiri, P. Somta, T. Toojinda and P. Srinives. 2012. SSR map construction and quantitative trait loci (QTL) identification of major agronomic traits in mungbean (Vigna radiata (L.) Wilczek). SABRAO J. Breed. Genet. 44: 71–86.
Kitsanachandee, R., P. Somta, O. Chatcha-wankanphanich, K.P. Akhtar, T.M. Shah, R.M. Nair, T.S. Bains, A. Sirari, L. Kaur and P. Srinives. 2013. Detection of quantitative trait loci for mungbean yellow mosaic India virus (MYMIV) resistance in mungbean (Vigna radiata (L.) Wilczek) in India and Pakistan. Breed. Sci. 63: 367–373. Kongjaimun, A., A. Kaga, N. Tomooka, P. Somta,
T. Shimizu, Y. Shu, T. Isemura, D.A. Vaughan and P. Srinives. 2012. An SSR-based linkage map of yardlong bean (Vigna unguiculata (L.) Walp. subsp. unguiculata Sesquipedalis Group) and QTL analysis of pod length. Genome 55: 81–92.
Kosambi, D.D. 1944. The estimation of map distances from recombination values. Ann. Eugen. 12: 172–175.
Li, C.D., C.A. Fatokun, B. Ubi, B.B. Singh and G.J. Scoles. 2001. Determining genetic similarities and relationships among cowpea breeding lines and cultivars by microsatellite markers. Crop Sci. 41: 189–197.
Lin, S., S. Cianzio and R. Shoemaker. 1997. Mapping genetics loci for iron deficiency chlorosis in soybean. Mol. Breed. 3: 219–229.
Prakit Somta et al.: Dissecting Quantative Trait Loci for Agronomic Traits………
Lodhi, M.A., G.N. Ye, N.F. Weeden and B.I. Reisch. 1994. A simple and efficient method for DNA extraction from grapevine cultivars and Vitis species. Plant Mol. Biol. Rep. 12: 6-13
Nopparat, S., P. Srinives, R. Kaveeta and S. Jintakanon. 1997. An inheritance of mungbean tolerance to microessential element deficiency in Takhli soil series. P. 78–82. In Romkaew J. et al. (Editors) Proceedings of National Mungbean Research Conference VII, Phitsanulok, Thailand.
Park, H.G. 1978. Suggested cultural practices for mungbean. Asian Vegetable Research and Development Center, Tainan, Taiwan.
Prathet, P., P. Somta and P. Srinives. 2012. Mapping QTL conferring resistance to iron deficiency chlorosis in mungbean [Vigna radiata (L.) Wilczek]. Field Crops Res 137:230–236.
Quarrie, S., S.P. Quarrie, R. Radosevic, D. Rancic, A. Kaminska, J.D. Barnes, M. Leverington, C. Ceoloni and D. Dodig. 2006. Dissecting a wheat QTL for yield present in a range of environments: from the QTL to candidate genes. J. Exp. Bot. 57: 2627–2637
R Development Core Team. 2010. R: A Language and Environment for Statistical Computing. R Foundation for Statistical Computing, Vienna, Austria. Seehalak, W., P. Somta, W. Musch and P.
Srinives. 2009. Microsatellite markers for mungbean developed from sequence database. Mol.Ecol. Resour.9: 862–864. Shi, T., R. Li, Z. Zhao, G. Ding, Y. Long, J.
Meng, F. Xu and L. Shi. 2013. QTL for yield traits and their association with functional genes in response to phosphorus deficiency in Brassica napus. PLoS ONE 8(1): e54559. doi:10.1371/journal.pone. 0054559
Somta, P., W. Musch, B. Kongsamai, S. Chanprame, S. Nakasathien, T. Toojin-da, W. Sorajjapinun, W. Seehaluk, S. Tragoonrung and P. Srinives. 2008. New microsatellite markers isolated from mungbean (Vigna radiata (L.) Wilczek). Mol. Ecol. Resour. 8: 1155– 1157
Somta, P., W. Seehalak and P. Srinives. 2009. Development, characterization and cross-species amplification of mungbean (Vigna radiata) genic microsatellite markers. Conserv. Genet. 10: 1939– 1943.
Tangphatsornruang, S., P. Somta, P. Uthaipai-sanwong, J. Chanprasert, D. Sangsrakru, W. Seehalak, W. Sommanas, S. Tragoonrung and P. Srinives. 2009. Characterization of microsatellites and gene contents from genome shotgun sequences of mungbean (Vigna radiata (L.) Wilczek). BMC Plant Biol. 9:137. doi:10.1186/ 1471-2229-9-137
Wang, S., C.J. Basten and Z.B., Zeng. 2012. Window QTL Cartographer 2.5. Department of Statistics, North Carolina State University, Raleigh, NC, USA. Wang, X.W., A. Kaga, N. Tomooka, D.A.
Vaughan. 2004. The development of SSR markers by a new method in plants and their application to gene flow studies in azuki bean (Vigna angularis (Willd.) Ohwi & Ohashi]. Theor. Appl. Genet. 109:352–360.
Zhao Z., L. Wu, F. Nian, G. Ding, T. Shi, D. Zhang, L. Shi, F. Xu and J. Meng. 2012 Dissecting quantitative trait loci for boron efficiency across multiple environments in Brassica napus. PLoS ONE 7(9): e45215. doi:10.1371/ jour-nal. pone.0045215