Cardiovascular Costs and Hospitalizations in Managed-Care
Patients After Ischemic Stroke
Craig S. Roberts, PharmD, MPA; Philip B. Gorelick, MD, MPH; Xin Ye, PhD;
Carolyn Harley, PhD; George A. Goldberg, MD
Background and Purpose—Prior stroke confers an increased risk of future cardiovascular events. Because the incremental economic impact of this added risk is unknown, we assessed the additional cardiovascular costs and hospitalizations associated with ischemic stroke.
Methods—Patients hospitalized for ischemic stroke during 2002 to 2005 were identified from a large US managed-care plan and matched to control patients hospitalized for a noncardiovascular acute event. Cumulative stroke-related and non–stroke-related cardiovascular medical costs were determined for each group. Stroke and nonstroke cardiovascular hospitalization rates were calculated with the Kaplan–Meier method; risk of hospitalization was estimated with a Cox regression model. Results—Stroke patients and matched controls (N⫽11 883) were identified (mean age ⬇58 years; 47.8% female).
Compared with controls, patients hospitalized for ischemic stroke had higher stroke and nonstroke cardiovascular medical costs at 6 months (stroke: $1756 vs $50,P⬍0.01; nonstroke cardiovascular: $1437 vs $658,P⬍0.01) and 12
months (stroke: $2109 vs $68, P⬍0.01; nonstroke cardiovascular: $2203 vs $1167,P⬍0.01) of follow-up. Among
stroke patients, cumulative stroke and nonstroke cardiovascular hospitalization rates were 9.06% and 5.63% at 6 months, respectively, and 21.09% and 22.05% at 36 months, respectively. Stroke patients were at significantly increased risk of repeat stroke hospitalization (hazard ratio⫽12.55; 95% CI, 10.50 to 15.01) and nonstroke cardiovascular hospitalization (hazard ratio⫽1.95; 95% CI, 1.77 to 2.14).
Conclusions—After ischemic stroke, patients have significantly greater stroke and nonstroke cardiovascular costs and hospitalizations than do matched controls. Attention to total cardiovascular risk reduction in this population could potentially reduce downstream costs. (Stroke. 2009;40:1425-1432.)
Key Words:stroke 䡲 health care costs 䡲 hospitalization 䡲 risk factors 䡲 managed care
S
troke represents a major public health problem in the United States, where it is the third leading cause of mortality, accounting for⬎150 000 deaths annually, and is one of the leading causes of long-term adult disability.1There are an estimated 5.8 million survivors of stroke in the United States alone, and up to one third of stroke patients may be left permanently disabled or require several months of institu-tional care after an attack.1Patients with prior stroke are at increased risk of future cerebrovascular events: of the⬇780 000 strokes occurring in the United States each year,⬇180 000 are recurrent attacks.1 Ischemic strokes account for 87% of all strokes.1Although a repeat stroke is the most common secondary ischemic event in the years after an ischemic stroke,2– 4these patients are also at increased risk of coronary events such as myocardial infarction (MI) and cardiac death.5–7 The observation that ischemic stroke may predict future cardiac events is
indica-tive of the shared risk factors and pathophysiologic mecha-nisms underlying these events and the systemic nature of atherosclerotic vascular disease.
Owing to the high level of morbidity associated with stroke, the economic burden of this disease is substantial. For 2008, it is estimated that stroke will cost the US economy $65.5 billion in health care services, medications, and lost productivity.1 Few studies have estimated the incremental health care costs and resource utilization associated with ischemic stroke, particularly those costs and hospitalizations that arise from non–stroke-related cardiovascular events (eg, MI, angina, revascularization, and heart failure) in the poststroke follow-up period. Therefore, using claims data from a large US managed-care health plan for 2002 to 2005, we assessed the long-term stroke-related and non– stroke-related cardiovascular costs and hospitalization risk in patients hospitalized for ischemic stroke compared with
Received August 12, 2008; accepted September 12, 2008.
From Pfizer Inc (C.S.R.), New York, NY; the University of Illinois at Chicago (P.B.G.); and i3 Innovus, Eden Prairie, Minn (X.Y., C.H.), and Santa Monica, Calif (G.A.G.).
Correspondence to Craig S. Roberts, PharmD, MPA, Global Outcomes Research, Pfizer Inc, 235 East 42nd St, New York, NY 10017. E-mail [email protected]
© 2009 American Heart Association, Inc.
Strokeis available at http://stroke.ahajournals.org DOI: 10.1161/STROKEAHA.108.534354
matched control patients hospitalized for a noncardiovas-cular event.
Subjects and Methods
Data Source and Claims
This retrospective claims database analysis used anonymous eligi-bility, pharmacy claims, and medical claims data from a large US managed-care health plan. This claims database is updated on a regular basis and includedⱖ15 million enrollees insured through their employers or as dependents of enrolled employees.
Medical claims are collected from all available sources (eg, inpatient hospital, outpatient hospital, Emergency Department, phy-sician’s office, and surgery center) for all types of provided services, including specialty, preventive, and office-based treatments. Ninety-five percent of medical claims data are captured within⬇6 months of payment of the underlying claim. Pharmacy claims are provided by pharmacies and included drug name, dosage form, drug strength, fill date, days of supply, and cost, allowing for longitudinal tracking of medication refill patterns and changes in medications. Incorporation of pharmacy claims data occurs within ⬇6 weeks of payment of the underlying claim.
Study Cohorts
The study cohort selection procedure is shown in Figure 1. Patients hospitalized for ischemic stroke between January 1, 2002 and December 31, 2005 were identified from the claims database according to the International Classification of Diseases, 9th Revi-sion, Clinical Modification (ICD-9-CM) coding system currently
used to classify medical claims in the United States. Diagnosis codes in the 433.xx series (where “x” indicates that any number was valid as the fourth and fifth digit) were used for occlusion and stenosis of precerebral arteries, and codes in the 434.xx series were used for occlusion of cerebral arteries. Patients with hemorrhagic stroke were excluded from the stroke cohort by not including diagnoses with ICD-9-CM codes 430 to 432.9, which relate to intracranial hemor-rhage. Patients with a stroke that had not been specified as ischemic or hemorrhagic (ICD-9-CM: 436 [acute, but ill-defined, cerebrovas-cular disease]) were also excluded, as were those with a diagnosis of transient ischemic attack (ICD-9-CM: 435.x). Patients with chronic comorbidities that have a high mortality rate (ie, HIV/AIDS, cancer/ chemotherapy, end-stage renal disease, and transplantation) were excluded from the final stroke cohort. A control cohort of patients hospitalized during this period for an acute noncardiovascular event was also identified among those who were not included in the stroke cohort by: (1) extracting all facility claims with codes indicating inpatient hospitalization; (2) excluding hospitalizations with diag-noses (primary or secondary position), procedures, and medications for chronic disorders with a high mortality rate (ie, HIV/AIDS, cancer/chemotherapy, end-stage renal disease, and transplantation); (3) assessing the frequency of primary diagnosis and procedure codes on the claims; (4) reviewing these diagnosis codes and excluding hospital-izations with diagnoses (primary position) associated with cardiovascu-lar disease (CVD), routine or nonspecific visits (eg, pregnancy/child-birth, nausea/vomiting, and diarrhea), and mental disorders; and (5) reviewing the length of hospital stay and total hospital costs. The final comparison cohort consisted of those with an index hospitalization without the codes and medications listed in supplemental Table I, available online at http://stroke.ahajournals.org.
Patients hospitalized for ischemic stroke, Jan 1, 2002–Dec 31, 2005
n=45,163
Patients without HIV/AIDS, cancer, ESRD, or transplantation
n=35,150
Patients continuously enrolled for 12 months prior to index hospitalization
n=25,141
Patients ≥18 years of age n=24,955
Patients without negative/zero costs for the first inpatient hospitalization
n=24,686
Patients without unknown gender n=24,684
Patients continuously enrolled between the discharge date for the first inpatient
hospitalization and end date n=24,523
Patients hospitalized for a non-stroke event, Jan 1, 2002–Dec 31, 2005
n=2,115,881
Patients without HIV/AIDS, cancer, ESRD, or transplantation
n=1,861,207
Patients continuously enrolled for 12 months prior to index hospitalization
n=866,821
Patients ≥18 years of age n=792,908
Patients without negative/zero costs for the first inpatient hospitalization
n=763,707
Patients without unknown gender n=763,605
Patients continuously enrolled between the discharge date for the first inpatient
hospitalization and end date n=352,419 Patients without other exclusionary
ICD-9-CM codes during index hospitalization n=353,696
Patients matched 1:1 on age, gender, month of index hospitalization,
length of follow-up, CCI, and CVD history
t Patients hospitalized for ischemic stroke,
Jan 1, 2002–Dec 31, 2005 n=45,163
Patients without HIV/AIDS, cancer, ESRD, or transplantation
n=35,150
Patients continuously enrolled for 12 months prior to index hospitalization
n=25,141
Patients ≥18 years of age n=24,955
Patients without negative/zero costs for the first inpatient hospitalization
n=24,686
Patients without unknown gender n=24,684
Patients continuously enrolled between the discharge date for the first inpatient
hospitalization and end date n=24,523
Patients hospitalized for a non-stroke event, Jan 1, 2002–Dec 31, 2005
n=2,115,881
Patients without HIV/AIDS, cancer, ESRD, or transplantation
n=1,861,207
Patients continuously enrolled for 12 months prior to index hospitalization
n=866,821
Patients ≥18 years of age n=792,908
Patients without negative/zero costs for the first inpatient hospitalization
n=763,707
Patients without unknown gender n=763,605
Patients continuously enrolled between the discharge date for the first inpatient
hospitalization and end date n=352,419 Patients without other exclusionary
ICD-9-CM codes during index hospitalization n=353,696
The first hospitalization during the identification period was defined as the index hospitalization. A preindex baseline period was defined as the 12 months preceding the index hospitalization admission date, and the postindex follow-up period was defined as the period between the index hospitalization discharge date and the earliest of disenrollment, death, or June 30, 2006. Inclusion in the final study sample was dependent on a patient being continuously enrolled for ⱖ12 months before the index date through to the discharge date for the index hospitalization, insured with drug and medical benefits for the entire study, andⱖ18 years of age in the year of the index hospitalization.
Patients in the ischemic stroke cohort were paired with matched controls on the basis of age (⫾1 year), sex, month of index hospitalization, length of follow-up (⫾30 days), Charlson Comor-bidity Index score (⫾1 point), and baseline CVD history. The stroke and control cohorts were also stratified into subgroups according to presence or absence of history of prior stroke or other CVD in the preindex period. Evidence of stroke history was defined as any medical claim having ICD-9-CM codes 433.xx to 436.xx, or a pharmacy claim for anticoagulation or antiplatelet therapy. Evidence of other CVD history was defined as any medical claim with a diagnosis or procedure code indicating aortic and mitral valve stenosis, MI, ischemic heart disease, angina pectoris, congestive heart failure, congenital heart disease, coronary artery disease, percutaneous transluminal coronary angioplasty, coronary artery bypass graft, limb bypass surgery, asymmetrical septal hypertrophy,
malfunctioning prosthetic valve, constrictive pericarditis, heart trans-plant, subarachnoid hemorrhage, or a prescription claim for nitrates.
Cost and Resource Utilization Outcomes
The identification of stroke-related and non–stroke-related cardio-vascular costs and resource use was based on the diagnosis and procedure codes entered on medical claims (listed in supplemental Table II). Cardiovascular pharmacy claims were identified for the following drug classes: anticoagulants, antiplatelets, antihyperten-sives, statins, ezetimibe, bile acid sequestrants, fibrates, insulins, and oral hypoglycemics. All-cause costs were calculated from all claims regardless of diagnosis.
Cumulative costs (mean costs per patient within the specified time window) were calculated for stroke-related, non–stroke-related car-diovascular, and all-cause medical services, as well as for cardio-vascular pharmacy costs, for patients in each cohort who were continuously enrolled for the entire period. All diagnosis and procedure codes were used in the identification of related costs. Cost calculations reflected the actual amount paid, including both the patient liability (in the form of copayment and deductible) and the health plan liability, to best reflect the true cost of care. Costs are reported in US dollars and were adjusted for inflation to 2005 according to the medical component of the Consumer Price Index.
Cumulative risk of hospitalization (risk of an event within the specified time window) was calculated for stroke-related and non– stroke-related cardiovascular hospitalizations based on ICD-9-CM Table 1. Baseline Demographic and Clinical Characteristics of the Stroke and Control Cohorts by CVD History
Parameter
Stroke Cohort Control Cohort
Subgroups (Based on Prior Disease)
All Patients (n⫽11 883)
Subgroups (Based on Prior Disease)
All Patients (n⫽11 883)
No CVD (n⫽8415)
Stroke (n⫽958)
Other CVD (n⫽1398)
Stroke⫹Other CVD (n⫽1112)
No CVD (n⫽8415)
Stroke (n⫽958)
Other CVD (n⫽1398)
Stroke⫹Other CVD (n⫽1112)
Age, mean (SD), y 57.8 (12.9) 55.5 (12.8) 60.9 (11.3) 63.4 (11.6) 65.7 (10.3) 57.7 (12.9) 55.3 (12.7) 60.9 (11.3) 63.3 (11.7) 65.7 (10.4)
Female, % 47.8 49.9 53.4 40.7 35.4 47.8 49.9 53.4 40.7 35.4
Follow-up, mean (SD), d
550.6 (400.5) 524.1 (398.1) 625.1 (400.4) 602.5 (406.9) 622.1 (387.8) 550.9 (400.5) 524.4 (398.2) 624.8 (400.7) 602.6 (406.8) 622.2 (387.6)
CCI, mean (SD) 0.62 (0.92) 0.31 (0.62) 1.10 (0.76) 1.07 (1.03) 1.97 (1.12) 0.62 (0.92) 0.31 (0.62) 1.10 (0.76) 1.07 (1.03) 1.97 (1.12)
Comorbidities, %
Hypertension 48.2 38.3 62.8 71.5 80.9 44.3 35.0 57.1 65.2 77.2
Lipid metabolism disorders
37.6 28.1 48.2 60.7 71.1 39.3 31.2 49.9 59.5 66.5
Diseases of the heart
36.1 19.7 41.0 88.1 90.3 37.2 21.1 45.4 86.7 90.0
Medications, %
Antihyperlipid-emics
Statins 24.6 15.7 33.0 43.9 60.7 25.3 17.3 33.5 41.3 58.8
Other (EZEs/ fibrates/BASs)
6.0 3.4 6.2 12.7 17.5 6.1 4.0 7.7 10.7 15.0
Antihypertensives
ACE inhibitors 17.9 13.0 20.7 30.3 36.2 15.7 10.7 20.1 24.7 38.3
ARBs 10.5 8.6 12.5 15.0 17.2 10.2 7.9 14.5 14.1 19.2
CCBs 14.7 11.2 18.8 23.2 27.2 12.9 8.9 19.5 20.0 28.8
Diuretics 17.8 13.5 21.6 28.0 34.2 18.3 13.6 26.0 26.8 36.7
Other (VDs/BBs)
1.4 1.0 2.4 2.3 2.6 1.3 0.9 2.3 1.9 2.8
Antidiabetics
Oral hypoglycemics
11.3 9.7 11.0 15.6 18.1 10.4 7.1 14.2 16.6 24.6
Insulin 5.9 5.0 4.7 9.3 9.4 5.4 3.5 8.1 8.5 13.7
codes in the primary diagnosis position for all patients in each cohort regardless of length of enrollment.
Statistical Methods
Student’sttest was used to assess differences between the stroke and control cohorts for continuous outcome variables, whereas categor-ical outcome variables were compared with a2test. Hospitaliza-tions rates were estimated from the Kaplan–Meier method based on first events per patient. Hazard ratios (HRs) and 95% CIs were calculated from a Cox regression model.
Results
Cohort Selection
The results of the study cohort selection procedure are shown in Figure 1. A total of 45 163 patients were identified as having an ischemic stroke hospitalization between January 1, 2002 and December 31, 2005, of whom 24 523 patients were included for matching to control patients. Exclusion from the study was primarily due to the requirement of 12-month continuous enrollment in the preindex period or absence of a chronic comorbidity.
After matching, the study cohorts consisted of 11 883 stroke patients and 11 883 control patients matched 1:1 on
age, sex, month of index hospitalization, length of follow-up, Charlson Comorbidity Index score, and baseline CVD his-tory. Stratification of these cohorts into subgroups based on history of prior stroke or other CVD revealed that the majority of patients (70.8%, n⫽8415) had no prior CVD history in the preindex period.
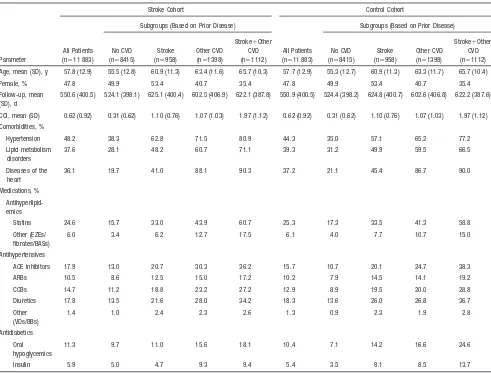
Baseline Demographic and Clinical Data
Baseline demographic and clinical characteristics of the stroke and control cohorts are shown in Table 1. Overall, the stroke and control cohorts were well-matched in terms of age, sex, length of follow-up, and Charlson Comorbidity Index score. Hypertension was the most prevalent comor-bidity documented in the preindex period, both in stroke patients (48.2%) and in control patients (44.3%). The most common prior medications were antihypertensive therapies (stroke patients, 41.0%; control patients, 38.8%). Prior statin use was similar between the stroke (24.6%) and control (25.3%) cohorts. The patient subgroups strat-ified on the basis of prior CVD history were generally well-matched on demographic and clinical parameters (Table 1).
(n=13,584) (n=1760) (n=2488) (n=2072)
A
P<0.01
Subgroups (Based on Prior Disease) Stroke-Related Costs at 6 Months
0
All Patients No CVD Stroke Other CVD Stroke+Other CVD
B
P<0.01
Stroke Cohort Control Cohort
Subgroups (Based on Prior Disease) Non–Stroke-Related CV Costs at 6 Months
P<0.01
Effect of Ischemic Stroke on Health Care Costs Before baseline, patients hospitalized for ischemic stroke had higher mean total health care costs when compared with control patients hospitalized for a noncardiovascular event ($5847 vs $5347 per patient; P⬍0.001), driven by higher Emergency Department and inpatient costs but offset by lower outpatient and pharmacy costs. Stroke patients also had higher mean index hospitalization costs than did control patients ($16 889 vs $12 036;P⬍0.001).
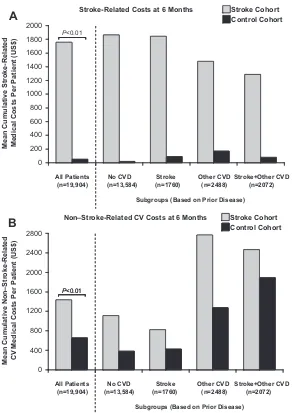
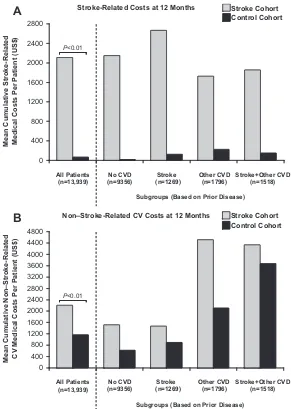
For stroke-related medical services, the mean cumulative costs per patient at 6 months of follow-up were $1756 for the stroke cohort compared with $50 for the control cohort (P⬍0.01; Figure 2A). After 12 months of follow-up, these costs increased to $2109 and $68 for stroke and control patients, respectively (P⬍0.01; Figure 3A). Significantly higher costs were also incurred by the stroke cohort than by the control cohort for non–stroke-related cardiovascular medical services, both at 6 months ($1437 vs $658;P⬍0.01; Figure 2B) and at 12 months ($2203 vs $1167;P⬍0.01; Figure 3B) of follow-up. This trend of higher stroke-related and non–stroke-related cardiovascular medical costs for stroke patients versus control patients was also
observed in the patient subgroups stratified on the basis of prior CVD history (Figures 2 and 3).
Compared with the control cohort, patients hospitalized for ischemic stroke had higher all-cause health care costs at 6 months ($5613 vs $3492;P⬍0.01) and at 12 months ($6544 vs $4406; P⬍0.01) of follow-up. Additionally, ischemic stroke patients had higher cardiovascular pharmacy costs at 6 months ($402 vs $272; P⬍0.01) and at 12 months ($794 vs $563;
P⬍0.01) of follow-up compared with the control cohort. Higher all-cause health care costs and cardiovascular pharmacy costs for stroke patients versus control patients were also observed in the patient subgroups stratified by CVD history (data not shown), with the exception of cardiovascular pharmacy costs in the subgroup of patients with a history of both stroke and other CVD, which were marginally higher in the control cohort compared with the stroke cohort at 6 months ($628 vs $588;
P⫽0.11) and 12 months ($1283 vs $1200;P⫽0.16).
Effect of Ischemic Stroke on Health Care Resource Use
Patients hospitalized for ischemic stroke had a mean length of stay for the index hospitalization of 7.6 days compared with 0
(n=9356) (n=1269) (n=1796) (n=1518)
A
P<0.01
Stroke Cohort Control Cohort
Subgroups (Based on Prior Disease) Stroke-Related Costs at 12 Months
0
All Patients No CVD Stroke Other CVD Stroke+Other CVD
P<0.01
Stroke Cohort Control Cohort
Subgroups (Based on Prior Disease) Non–Stroke-Related CV Costs at 12 Months
B
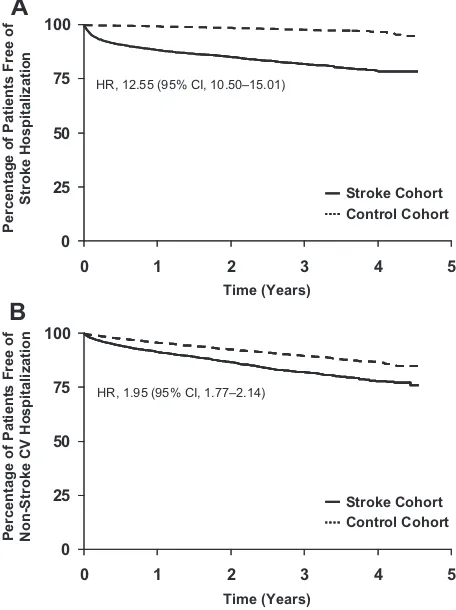
4.9 days for control patients hospitalized for a noncardiovas-cular event (P⬍0.001). The cumulative rate of stroke-related and non–stroke-related cardiovascular hospitalizations at 6, 12, 24, and 36 months of follow-up for the stroke and control cohorts is shown in Table 2. The rate of stroke-related hospitalizations at 6 months of follow-up was markedly higher in the stroke cohort compared with the control cohort, and this difference was maintained during a follow-up period of 36 months. The rate of non–stroke-related cardiovascular hospitalizations was also higher in the stroke cohort compared with the control cohort for the duration of the study. Overall, stroke patients were at significantly higher risk of both stroke-related hospitaliza-tions (HR⫽12.55; 95% CI, 10.50 to 15.01) and non– stroke-related cardiovascular hospitalizations (HR⫽1.95; 95% CI, 1.77 to 2.14) when compared with control patients (Figure 4).
Higher rates of stroke-related and non–stroke-related car-diovascular hospitalizations were observed in stroke patients versus control patients irrespective of CVD history at base-line (Table 2). However, the risk of stroke differed across the patient subgroups stratified on the basis of prior CVD history. At 36 months, patients with a history of stroke (with or without other CVD) had a higher stroke rate than those with no history of stroke, and those with a history of CVD other than stroke had a stroke rate between those with prior stroke and those with no CVD (Table 2). Similarly, the risk of non–stroke-related cardiovascular hospitalizations in patients with a history of other CVD was⬎2 times that of those with no CVD history and was moderately increased in those with a history of stroke versus no CVD history, both in stroke patients and controls. Within the stroke cohort, the rate of stroke-related hospitalizations was higher than the rate of non–stroke-related cardiovascular hospitalizations among
those with prior stroke history and those with no CVD history, whereas those with a history of other CVD had a nonstroke cardiovascular hospitalization rate that exceeded their stroke hospitalization rate.
Table 2. Cumulative Rate of Stroke-Related and Non–Stroke-Related Cardiovascular Hospitalizations for the Stroke and Control Cohorts by CVD History
CVD History
Cumulative Rate of Stroke-Related Hospitalizations, % (95% CI) Cumulative Rate of Non–Stroke-Related Cardiovascular Hospitalizations, % (95% CI)
6 Months 12 Months 24 Months 36 Months 6 Months 12 Months 24 Months 36 Months All patients, n⫽11 883
Stroke cohort 9.06 (8.54–9.61) 11.53 (10.93–12.16) 17.88 (16.89–18.92) 21.09 (19.59–22.69) 5.63 (5.21–6.08) 8.49 (7.96–9.06) 17.91 (16.81–19.06) 22.05 (20.37–23.84) Control cohort 0.34 (0.25–0.47) 0.60 (1.75–2.70) 2.17 (0.46–0.77) 3.34 (2.50–4.45) 2.37 (2.11–2.68) 4.24 (3.85–4.66) 10.29 (9.41–11.25) 13.04 (11.71–14.52) Subgroups (based
on prior disease) No CVD, n⫽8415
Stroke cohort 8.72 (8.12–9.37) 10.87 (10.18–11.61) 16.06 (14.93–17.26) 19.06 (17.33–20.93) 4.18 (3.75–4.65) 5.87 (5.35–6.45) 11.93 (10.84–13.11) 15.81 (14.03–17.79) Control cohort 0.17 (0.10–0.28) 0.30 (0.20–0.47) 1.24 (0.85–1.79) 1.44 (0.99–2.10) 1.26 (1.03–1.54) 2.17 (1.85–2.56) 5.70 (4.87–6.66) 8.08 (6.62–9.84) Stroke, n⫽958
Stroke cohort 11.33 (9.46–13.54) 15.81 (13.57–18.39) 25.30 (21.68–29.41) 26.40 (22.32–31.06) 4.12 (3.01–5.61) 6.54 (5.08–8.41) 14.55 (11.49–18.34) 19.25 (13.81–26.47) Control cohort 0.65 (0.29–1.44) 1.19 (0.64–2.21) 3.18 (1.76–5.74) 5.03 (2.68–9.36) 2.08 (1.33–3.23) 4.24 (3.07–5.83) 8.07 (5.94–10.91) 11.94 (8.17–17.27) Other CVD, n⫽1398
Stroke cohort 8.14 (6.79–9.74) 10.47 (8.90–12.30) 18.37 (15.75–21.37) 22.92 (18.74–27.86) 10.76 (9.20–12.55) 17.10 (15.10–19.33) 34.67 (31.02–38.61) 40.74 (35.40–46.57) Control cohort 0.75 (0.40–1.38) 1.14 (0.67–1.93) 2.58 (1.62–4.10) 3.92 (1.88–8.06) 5.24 (4.16–6.58) 8.81 (7.33–10.58) 19.32 (16.34–22.78) 22.54 (18.71–27.02) Stroke⫹other CVD,
n⫽1112
Stroke cohort 10.63 (8.94–12.63) 13.53 (11.58–15.77) 22.25 (18.88–26.11) 27.17 (21.53–33.93) 10.85 (9.14–12.86) 17.26 (15.06–19.75) 37.29 (32.91–42.05) 38.92 (34.13–44.12) Control cohort 0.85 (0.44–1.63) 1.40 (0.83–2.35) 6.51 (4.54–9.29) 13.13 (7.55–22.30) 6.98 (5.61–8.67) 12.59 (10.66–14.82) 30.18 (26.13–34.69) 33.74 (28.93–39.12)
A
0 25 50 75 100
0 1 2 3 4 5
Time (Years)
Percentage of Patien
ts Free
of
Stroke Hosp
itali
zation HR, 12.55 (95% CI, 10.50–15.01)
Stroke Cohort Control Cohort
B
0 25 50 75 100
0 1 2 3 4 5
Time (Years)
Percentage of
Patien
ts
Free
of
Non-St
roke CV Hospital
ization
HR, 1.95 (95% CI, 1.77–2.14)
Stroke Cohort Control Cohort
Discussion
This retrospective claims database analysis has demonstrated that ischemic stroke is associated with significant increases in downstream health care costs and resource utilization within a US managed-care setting. To our knowledge, this study is the first economic analysis of stroke to differentiate between stroke-related and non–stroke-related cardiovascular costs and resource use in the poststroke follow-up period.
Patients hospitalized for ischemic stroke had an⬇30-fold increase in stroke-related medical costs at 1 year of follow-up compared with matched control patients hospitalized for a noncardiovascular event. Moreover, 1-year medical costs associated with non–stroke-related cardiovascular events in the ischemic stroke cohort were nearly double that of the control cohort. Ischemic stroke patients also incurred higher all-cause health care costs and cardiovascular pharmacy costs. In addition to increased health care costs, patients hospitalized for ischemic stroke were at significantly higher risk of a repeat stroke hospitalization, as well as hospitaliza-tion for a non–stroke-related cardiovascular event, during the follow-up period than were controls.
This trend toward higher health care costs and resource utilization in stroke patients versus control patients was independent of CVD history at baseline. Comparisons across patient subgroups suggest that a history of CVD in ischemic stroke patients, whether prior stroke history or other CVD history, identifies patients at higher risk for future events and cost. Such comparisons also suggest that CVD history does not confer a uniform increase in risk across vascular beds. For example, patients with nonstroke CVD histories have a greater relative risk of non–stroke-related cardiovascular hospitalizations, whereas those with stroke histories have higher stroke rates, both in stroke patients and controls. Notably, the nonstroke cardiovascular hospitalization rate of the control cohort with a history of other CVD is greater than that of the stroke cohort with no CVD history, suggesting that ischemic stroke alone may not be as strong a predictor of future cardiovascular events as a history of other CVD. One must be cautious with these comparisons, however, because patients were matched within but not across subgroups, and those with a history of other CVD were more likely to have more cardiovascular risk factors, including cardiovascular comorbidities, use of statins and antihypertensive agents, a greater proportion of male patients, and older age.
This analysis highlights the significant risk of recurrent cardiovascular events and, in turn, additional economic bur-den associated with hospitalization for ischemic stroke. Ex-trapolation of these results to the estimated 520 000 Ameri-cans who experience a first ischemic stroke annually1 indicates that ischemic stroke is associated with an average
⬇$1.1 billion in excess direct medical costs for stroke-related events and a further ⬇$540 million for non–stroke-related cardiovascular events in the United States each year. It is important to emphasize that these costs relate only to direct medical service costs associated with cardiovascular events as paid by the managed-care organization in the first year after the initial hospitalization and do not include the initial stroke hospitalization costs, noncardiovascular medical costs, pharmacy costs, indirect costs due to lost productivity,
nursing home costs, or the considerable costs associated with ambulatory care in the longer term.8 The observation that ischemic stroke patients have additional costs and resource use for non–stroke-related cardiovascular events, such as MI and coronary heart disease (CHD), in addition to stroke-related events, supports the notion that stroke patients are at high risk of future coronary events as well as recurrent cerebrovascular events.2–7 Therefore, therapeutic strategies aimed at total cardiovascular risk reduction in stroke patients may have the potential to reduce both the morbidity and mortality associated with stroke as well as downstream hospitalizations and health care costs.
A recent update to the American Heart Association/Amer-ican Stroke Association recommendations for prevention of stroke in patients with ischemic stroke or transient ischemic attack supports the administration of intensive statin therapy in patients with prior stroke but without evidence of CHD to reduce the risk of recurrent stroke or cardiovascular events.9 Our data provide support for the potential economic benefits of this recommendation, noting the financial contribution of non–stroke-related cardiovascular events to the overall direct cost of ischemic stroke patients with no prior CVD history. In addition, we found that increasing history of CVD further amplifies the incremental economic impact of both stroke-related and non–stroke-stroke-related events, raising awareness of the relevance of stroke as an indicator of greater overall cardiovascular risk and cost, both as a primary cardiovascular event and in patients with preexisting CVD.
Given the high prevalence of CVD and the baseline cardiovascular risk in a middle-aged population with cardio-vascular risk factors, we used a control group to distinguish between added cardiovascular costs in the poststoke cohort versus the baseline rate expected from a nonstroke popula-tion. Controls were selected from a pool of patients hospital-ized for an acute noncardiovascular cause. Although this population may have more severe illness than a general community population, potentially resulting in an underesti-mate of incremental non–stroke-related cardiovascular costs in the stroke cohort, the hospitalized pool of patients offers advantages of a reference date for matching (via their discharge date) and confirming that this is a population that utilizes hospital-based care. A few observations support this strategy for selection of controls. First, cases and controls were similar with regard to nonmatched variables indicative of cardiovascular risk by subgroup, such as statin and antihypertensive use. Second, the rate of stroke and the level of stroke costs in controls without a stroke history were nearly zero and increased as demographic indicators of cardiovas-cular risk increased, conforming to expectation. One conse-quence of the sample selection process was the elimination of a large number of stroke patients from the initial pool of cases, giving a final stroke cohort of 11 883 (from 24 523) after matching to controls. However, the analysis of event rates produced consistent relative event rates across sub-groups, suggesting that the relative risk of events between cases and controls for stroke-related and non–stroke-related cardiovascular events was robust.
plan claims database. First, clinical diagnosis and procedure codes were used to identify the patient cohorts and determine stroke-related and non–stroke-related cardiovascular costs and resource use in the follow-up period. Hence, the validity of this analysis relies on the accurate assignment of these codes to patient records. Second, although claims data can allow researchers to model and understand “real world” patterns of health care cost and resource utilization, the degree to which claims data can accurately capture an individual’s clinical history can vary. Third, the claims data used for this analysis came from a managed-care population, and hence the results are primarily applicable to patient populations who receive their care through similar health delivery systems. However, as the health plans used for analysis included a wide geographic distribution across the United States, these results may be generalized to comparable managed-care populations on a national level. Fourth, al-though some confounding factors were adjusted for through patient matching, it is possible that there were other differ-ences between the stroke and control populations that might have affected the interpretation of the results.
These limitations notwithstanding, the observation of in-creased cardiovascular costs and hospitalizations after ische-mic stroke has highlighted the significant risk of recurrent cardiovascular events associated with stroke. Current recom-mendations to manage ischemic stroke patients as CHD risk equivalents5,9 –11has the potential to reduce both the morbid-ity and mortalmorbid-ity of stroke and the economic burden attached to these events.
Acknowledgments
Editorial support was provided by Dr Shirley Smith at Envision Pharma Ltd and was funded by Pfizer Inc.
Sources of Funding
This study was funded by Pfizer Inc. The topic of the study was agreed upon with the funding organization at the outset of the project; however, the authors retained full rights in the design, analysis, interpretation, and publication of the results. Dr Ye, Dr Harley, and Dr Goldberg are employees of i3 Innovus and were paid consultants to Pfizer Inc in the development of this manuscript.
Disclosures
Dr Roberts is an employee of Pfizer Inc (significant) with ownership of stock in Pfizer Inc (significant). Dr Gorelick is a consultant for Pfizer Inc (modest), Novartis (modest), Brainsgate (modest), Daiichi Sankyo (modest), diaDexus (modest), Statistical Collaboration Inc (for a Merck study; modest), TAP Pharmaceuticals (significant),
Bayer (significant), and Boehringer Ingelheim (significant) and is a speaker for (and received honoraria from) Boehringer Ingelheim (significant). As employees of i3 Innovus, Dr Ye, Dr Harley, and Dr Goldberg received financial support from Pfizer Inc (modest) to conduct this study; Dr Goldberg has ownership of stock in Pfizer, Inc (significant).
References
1. Rosamond W, Flegal K, Furie K, Go A, Greenlund K, Haase N, Hailpern SM, Ho M, Howard V, Kissela B, Kittner S, Lloyd-Jones D, McDermott M, Meigs J, Moy C, Nichol G, O’Donnell C, Roger V, Sorlie P, Stein-berger J, Thom T, Wilson M, Hong Y. Heart disease and stroke statis-tics—2008 update: a report from the American Heart Association Sta-tistics Committee and Stroke StaSta-tistics Subcommittee.Circulation. 2008; 117:e25– e146.
2. Vickrey BG, Rector TS, Wickstrom SL, Guzy PM, Sloss EM, Gorelick PB, Garber S, McCaffrey DF, Dake MD, Levin RA. Occurrence of secondary ischemic events among persons with atherosclerotic vascular disease.Stroke. 2002;33:901–906.
3. Brown DL, Lisabeth LD, Roychoudhury C, Ye Y, Morgenstern LB. Recurrent stroke risk is higher than cardiac event risk after initial stroke/ transient ischemic attack.Stroke. 2005;36:1285–1287.
4. Dhamoon MS, Sciacca RR, Rundek T, Sacco RL, Elkind MS. Recurrent stroke and cardiac risks after first ischemic stroke: the Northern Man-hattan Study.Neurology. 2006;66:641– 646.
5. Adams RJ, Chimowitz MI, Alpert JS, Awad IA, Cerqueria MD, Fayad P, Taubert KA. Coronary risk evaluation in patients with transient ischemic attack and ischemic stroke: a scientific statement for healthcare professionals from the Stroke Council and the Council on Clinical Cardiology of the American Heart Association/American Stroke Association. Circulation. 2003;108:1278 –1290.
6. Touze E, Varenne O, Chatellier G, Peyrard S, Rothwell PM, Mas JL. Risk of myocardial infarction and vascular death after transient ischemic attack and ischemic stroke: a systematic review and meta-analysis. Stroke. 2005;36:2748 –2755.
7. Dhamoon MS, Tai W, Boden-Albala B, Rundek T, Paik MC, Sacco RL, Elkind MS. Risk of myocardial infarction or vascular death after first ischemic stroke: the Northern Manhattan Study. Stroke. 2007;38: 1752–1758.
8. Taylor TN, Davis PH, Torner JC, Holmes J, Meyer JW, Jacobson MF. Lifetime cost of stroke in the United States.Stroke. 1996;27:1459 –1466. 9. Adams RJ, Albers G, Alberts MJ, Benavente O, Furie K, Goldstein LB, Gorelick P, Halperin J, Harbaugh R, Johnston SC, Katzan I, Kelly-Hayes M, Kenton EJ, Marks M, Sacco RL, Schwamm LH. Update to the AHA/ASA recommendations for the prevention of stroke in patients with stroke and transient ischemic attack.Stroke. 2008;39:1647–1652. 10. Grundy SM, Cleeman JI, Merz CN, Brewer HB Jr, Clark LT,
Hun-ninghake DB, Pasternak RC, Smith SC Jr, Stone NJ. Implications of recent clinical trials for the National Cholesterol Education Program Adult Treatment Panel III guidelines.Circulation. 2004;110:227–239. 11. Sacco RL, Adams R, Albers G, Alberts MJ, Benavente O, Furie K,
Craig S. Roberts, Philip B. Gorelick, Xin Ye, Carolyn Harley and George A. Goldberg
Print ISSN: 0039-2499. Online ISSN: 1524-4628
Copyright © 2009 American Heart Association, Inc. All rights reserved.
is published by the American Heart Association, 7272 Greenville Avenue, Dallas, TX 75231 Stroke
doi: 10.1161/STROKEAHA.108.534354
2009;40:1425-1432; originally published online February 26, 2009;
Stroke.
http://stroke.ahajournals.org/content/40/4/1425
World Wide Web at:
The online version of this article, along with updated information and services, is located on the
http://stroke.ahajournals.org//subscriptions/
is online at: Stroke
Information about subscribing to
Subscriptions:
http://www.lww.com/reprints
Information about reprints can be found online at:
Reprints:
document.
Permissions and Rights Question and Answer
process is available in the
Request Permissions in the middle column of the Web page under Services. Further information about this Once the online version of the published article for which permission is being requested is located, click
can be obtained via RightsLink, a service of the Copyright Clearance Center, not the Editorial Office. Stroke
in
Requests for permissions to reproduce figures, tables, or portions of articles originally published