The Economic Benefit of
Palm Oil to Indonesia
A Report by World Growth
Alleviating Poverty through Wealth Creation
Palm oil provides developing nations and the poor a path out of poverty. Expanding efficient and sustainable agriculture such as Palm Oil Plantations provides small and large plantation owners and their workers with a means to improve their standard of living.
Sustainable Development
Sustainable development of palm oil plantations and growth of the palm oil industry in developing nations can and will be achieved through consultation and collaboration with industry, growers, lobby groups and the wider community.
Climate and the Environment
Palm Oil is a highly efficient, high yielding source of food and fuel. Palm Oil plantations are an efficient way of producing fossil fuel alternatives and capturing carbon from the atmosphere.
Opportunity and Prosperity
Developing nations must be allowed the chance to grow and develop without political intervention by environmental groups or developed nations. It is crucial that developing nations be given the same opportunities which developed nations have benefited from.
Property Rights
Table of Contents
Executive Summary . . . 4
I. Introduction . . . 5
II. Global Economic Importance of Palm Oil . . . 6
Trends in the Global Production
and Trade of Palm Oil . . . 6
Trends in the Global Consumption
of Palm Oil . . . 7
Trends in the Global Consumption
of Vegetable Oils . . . 9
III. Economic Importance of Palm Oil
to Indonesia . . . 10
Agriculture’s Contribution to the Indonesian Economy . . . 10
Palm Oil’s Contribution to the Indonesian Economy . . . 11
Palm Oil and Rural Development
in Indonesia . . . 11
Returns from Palm Oil Production . . . 14
IV. Future Prospects for Palm Oil . . . 15
Future Prospects for Global
Palm Oil Demand . . . 15
Global Palm Oil Production
and Opportunities . . . 15
Key Challenges and Opportunities for the Indonesian Oil Palm Sector . . . 16
References . . . 22
Annex
Executive Summary
Environmental NGO’s have been pushing a “no-conversion” agenda, in an attempt to halt the conver-sion of forest land to agriculture, including palm oil plantations. This agenda has extended into the opera-tions of international organisaopera-tions and governments.
In May 2010, the Indonesia and Norway signed a Letter of Intent comprising a framework for Indonesia to receive financial contributions from the Norwegian Government in return for the implementation of emission reducing policies, including a two-year sus-pension on all new concessions for conversion of peat and natural forest.
In July 2010, The World Bank proposed a framework for its engagement in the palm oil sector, acting at the behest of environmental NGOs to toughen the policies of the Group on the terms financial support is provid-ed to Palm Oil projects. A revisprovid-ed version of the frame-work was released for consultation in January 2011.
Restrictions on the conversion of forest area will neg-atively impact economic growth and food security in Indonesia and directly impact those living in poverty. For this reason, developing countries refused to include “no conversion” in the approach to forestry and REDD at the UN Climate Change conference in Cancun in December 2010.
Economic Benefits of Palm Oil
The palm oil industry has the potential to generate significant economic and social development in Indonesia. Palm oil is Indonesia’s second most suc-cessful agricultural product, after rice paddy, and largest agricultural export. It provides a means of income and economic development to a large number Indonesia’s rural poor. The Indonesian palm oil
industry is expected to continue its rapid growth in the medium-term; however, its competitiveness will be negatively impacted by the anti-palm oil agenda.
The global market for palm oil has experienced rapid growth in recent decades with current production of palm oil estimated at over 45 million tonnes. Indonesia is one of the world’s largest producers and exporters of palm oil, producing over 18 million tonnes of palm oil, annually.
Agriculture and Regional Poverty
Although only contributing around 14 percent to GDP, agriculture provides employment for over 41 percent of the Indonesian population and provides around two-thirds of rural household income. The palm oil industry is a significant contributor to rural income in Indonesia. In 2008, over 41 percent of oil palm plantations were owned by small land holders, producing 6.6 million tonnes of palm oil.
With over half of Indonesia’s population lives in rural areas—of which over 20 percent live below the poverty line—the palm oil industry provides an incomparable means of poverty alleviation. Limiting the conversion of forest to agriculture or palm denies considerable prospective economic benefits and improvements in living standards to the rural population, condemning them to declining standards of subsistence.
Future Industry Growth
With global demand for palm oil expected to grow further into the future, palm oil offers the most prom-ising economic prospects for Indonesia. World pro-duction of palm oil is expected to increase by 32 percent to almost 60 million tonnes by 2020.
Restrictions on the conversion of forests to oil palm plantations Indonesia would reduce the availability of fertile land and impede expansion of the industry. Government policies should aim to improve produc-tivity and not implement anti-growth NGO policies.
Restrictions on the conversion of forest area
will negatively impact economic growth and food
security in Indonesia and directly impact those
living in poverty.
EXECUTIVE SU
MMAR
I.
Indonesia is one of the world’s largest producers of palm oil and the industry has been the economy’s most valuable agricultural export sector for the past decade.
The palm oil industry is a significant contributor to production in Indonesia. In 2008, Indonesia produced over 18 million tonnes of palm oil. The industry also contributes to regional development as a significant source of poverty alleviation through farm cultivation and downstream processing. Palm oil production pro-vides a reliable form of income for a large number of Indonesia’s rural poor, with one source suggesting that employment generated from palm oil production in Indonesia could potentially reach over 6 million lives and take them out of poverty. Over 6.6 million tonnes of palm oil is produced by smallholders repre-senting over 41 percent of total palm oil plantations. In 2006, it was found that around 1.7 to 2 million people worked in the palm oil industry.
The Indonesian palm oil industry has recently come under fire from a number of NGOs who have cam-paigned against the industry and its perceived contri-bution to deforestation, carbon emissions, and biodiversity loss. As a result, there have been wide spread complaints that palm oil is not sustainable and proposals to have all future forest land conversion halted or restricted.
In May 2010, the Indonesian Government foreshad-owed a two-year moratorium on new concessions to clear natural forests and peatland under a deal signed with the Norwegian Government, aimed at reducing greenhouse gases. In return for the agreement, Norway has agreed to invest $1 billion in forest conservation projects in Indonesia. A year prior, the Indonesian government had announced it would dou-ble palm oil production to 40 million tonnes by 2020. The successful growth of the Indonesian palm oil industry will be impacted greatly by any restrictions on land conversion as well as negative campaigns targeting the industry. The achievement of the Indonesian government’s target of doubling oil palm production will also be significantly impacted by the moratorium, as some level of land conversion is required for economic development.
This report has been prepared as an independent
assessment of the economic benefits of the palm oil industry to inform policy makers and officials. It exam-ines recent industry performance and considers the prospects for future growth. Key components include:
• Current trends and future projections for global oil demand;
• The contribution of agriculture and palm oil to the Indonesian economy;
• Palm oil’s contribution to rural development; and
• Key challenges and opportunities for the Indonesian palm oil industry.
This report has been prepared as an independent
assessment of the economic benefits of the palm
II.
II. Global Economic Importance of Palm Oil
Palm oil is a vegetable oil derived from the fruit of the palm tree, it is used for both food and non-food con-sumption. Total global production of palm oil is esti-mated at over 45 million tonnes, with Indonesia and Malaysia as the major world producers and exporters. Major importers include India, China and the European Union.
The palm oil industry has experienced rapid growth in recent decades, and has become a significant contrib-utor to the world market for vegetable oils. Demand for palm oil has further increased in recent years as many developed economies are shifting away from the use of trans-fats, to healthier alternatives. Palm oil is often used as a substitute for trans-fat as it is one of the few highly saturated vegetable fats that are semi-solid at room temperature, and is relatively low cost.
World trade in palm oil has increased significantly due to increased global demand. However, there has also been public concern surrounding the impact of palm
oil on deforestation, carbon emissions and biodiversi-ty loss. High returns have encouraged investment in the Indonesian palm oil industry, and the resulting industry growth has contributed significantly to rural economic development and poverty alleviation. However, despite the expected increase in future demand, land use restrictions (such as the recent two year moratorium on new concessions to clear natural forests and peatland in Indonesia) may constrain industry development, as some level of land conver-sion is needed for industry growth.
Trends in the Global Production and Trade of Palm Oil
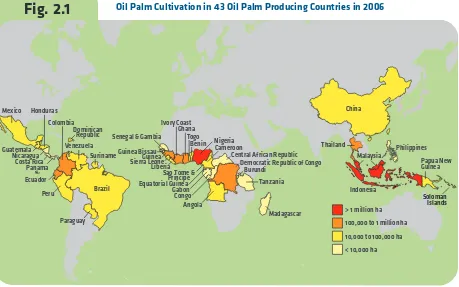
Originating in Africa, the oil palm was introduced into Malaysia and Indonesia in the colonial period. Current cultivation is concentrated in the tropical areas of the Americas, Africa and Southeast Asia, particularly Indonesia and Malaysia—where the climatic growing conditions are ideally suited for palm oil trees. Other key palm oil producing countries include Nigeria, Thailand, Columbia, Ecuador and other African economies.
Source: Koh and Wilcove 2008
Fig. 2.1
Oil Palm Cultivation in 43 Oil Palm Producing Countries in 2006Mexico
Democratic Republic of Congo
Angola
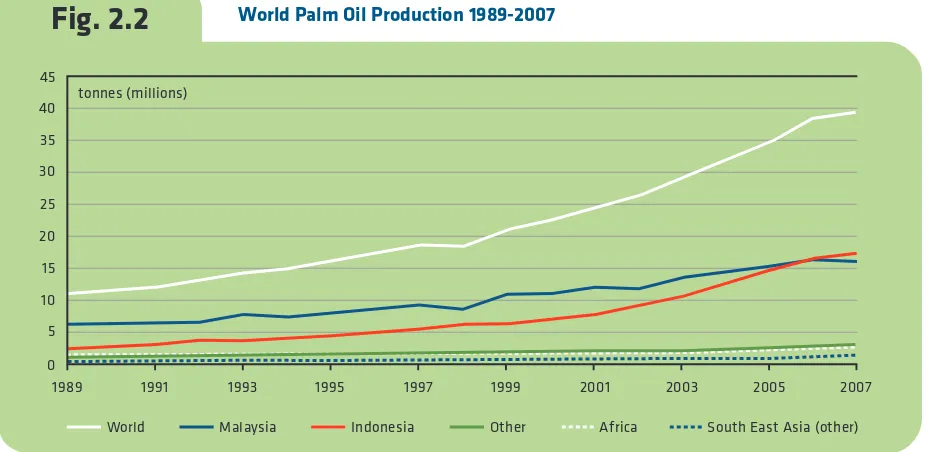
Total world production of palm oil has increased almost threefold over the past 3 decades to 20091. In
2009/10, total palm oil production was estimated at 45.1 million tonnes,2 with Indonesia and Malaysia
accounting for more than 85 percent of the world total. Indonesia and Malaysia each produced over 18 million tonnes of palm oil.
Total trade in palm oil and palm kernel oil is over 35 million tonnes, imported and exported. Major exporters of palm oil include Indonesia and Malaysia who exported 15.7 and 15.1 million tonnes, respective-ly. Key importing economies included India, China and the European Union, who imported 6.7 million, 6.3 million and 4.6 million tonnes, respectively.3
Trends in the Global Consumption of Palm Oil
Approximately 80 percent of global palm oil produc-tion is used for food purposes including as cooking oil, in margarines, noodles, baked goods etc. In addition, palm oil is used as an ingredient in non edible
prod-ucts including in the production of bio-fuel, soaps, detergents and surfactants, cosmetics, pharmaceuti-cals and a wide variety of other household and indus-trial products. In 2009, the world consumed approximately 6.5 kilograms of palm oil per capita, annually.4 Palm oil and palm kernel oil uses, in both
food and non-food products, have been growing sig-nificantly. By 2020, global consumption of palm oil is expected to grow to almost 60 million tonnes.
World demand for palm oil is also increasing, and like-ly to further increase, as developing economies move away from manufactured trans-fats to healthier
alter-40 45
35 30 25 20 15 10 5 0
1989 1991 1993 1995 1997 1999 2001 2003 2005 2007
South East Asia (other) Africa
Indonesia
World Malaysia Other
tonnes (millions)
Fig. 2.2
World Palm Oil Production 1989-20071 FAO (2010) 2 FARPI (2010) 3 FAO (2010) 4 FARPI (2010)
High returns have encouraged investment in the
Indonesian palm oil industry, and the resulting
industry growth has contributed significantly to
rural economic development and poverty alleviation.
5 Sheil et al (2009) 6 Sheil et al (2009) 7 OECD-FAO (2009) 8 Thoenes (2006) 9 Sheil et al (2009) 10 Thoenes (2006) 11 Neste Oil (2007) 12 Darby Sime
sources as palm oil currently accounts for less than 5 percent of the world’s bio-diesel production5.
Approximately 95 percent of the world’s energy con-sumption is sourced from fossil fuels; by 2030 energy consumption is expected to increase by a further 50 percent.6Many economies are setting targets to convert
reliance on fossil fuels to greater use of renewable energy in efforts to reduce GHG emissions. One such renew-able energy source that has grown significantly over the last decade is bio-fuel. Palm oil is widely used as a feed-stock in bio-diesel production. Although dependent on government policies, the increased use of bio-fuels is expected to facilitate further demand growth for palm oil. The OECD is expecting the global usage of vegetable oils in bio-diesel production to more than double between 2006-08 and 2018.7Palm oil is the most cost
competitive vegetable oil for producing bio-diesel.8
Many economies are currently adopting policies that encourage the use of bio-fuel. If such blending mandates are enforced an extra 4 million hectares of oil palm would be needed to meet European Union require-ments alone. A further one million hectares may be needed to satisfy China’s requirements, making bio-fuel production even more attractive.9
Investment in bio-diesel processing capacity is increas-ing; the Indonesian and Malaysian governments have introduced policies to develop a bio-diesel industry and targets of allocating 6 million tonnes of palm oil to the industry each year.10An oil refiner in Finland (Neste
Oil) has built the world’s largest bio-diesel plant in Singapore11and another major producer (Sime Darby
Berhad) has an annual processing capacity of 200,000 tonnes of biodiesel in the Netherlands.12 However, in
some cases, palm oils penetration of the bio-fuel mar-ket has been distorted by government assistance meas-ures. For example, the use of palm oil has been stymied by European Union protectionist policies against the importation of palm oil for use as a biofuel. In 2008, the European Parliament issued the Renewable Energy Directive restricted the use of palm oil based bio-fuels, due to environmental and social concerns. This will have direct implications for the global demand for natives. Trans-fats are often used in the place of natural
solid fats and liquid oils in the production of commer-cial food, particularly fast food and the snack and baked-good industries. Artificial and synthetic trans-fats are created by the processed food industry from partially hydrogenating unsaturated plant fats. Recently, developed economies have recognised the health risks of trans-fats, and have begun to limiting their use. Countries such as Demark, Switzerland and some U.S counties have banned the use of trans-fats in restaurants and fast food chains. Other countries such as the United Kingdom, Canada and Brazil have imle-mented policies aimed at reducing the use of trans-fats, including the requirement for trans-fats to be listed on food labels. In substitute for trans-fats, the demand for palm oil has increased. In addition to being a source of healthy unsaturated fats, palm oil is odourless and tasteless and does not require hydro-genation to achieve a solid state. These characteristics make palm oil ideal for margarine, baked goods and packaged goods, making it a strong competitor with vegetable oils made from soybeans and rapeseed that require hydrogenation to achieve a solid state. In addi-tion, palm oil is tolerant to high heat making it useful in the fried food and fast food industries.
Palm oil’s increasing contribution to the bio-fuels indus-try is also stimulating further demand. However, this demand is relatively low as compared with other
Investment in bio-diesel processing capacity
is increasing; the Indonesian and Malaysian
governments have introduced policies to develop
a bio-diesel industry and targets of allocating
6 million tonnes of palm oil to the
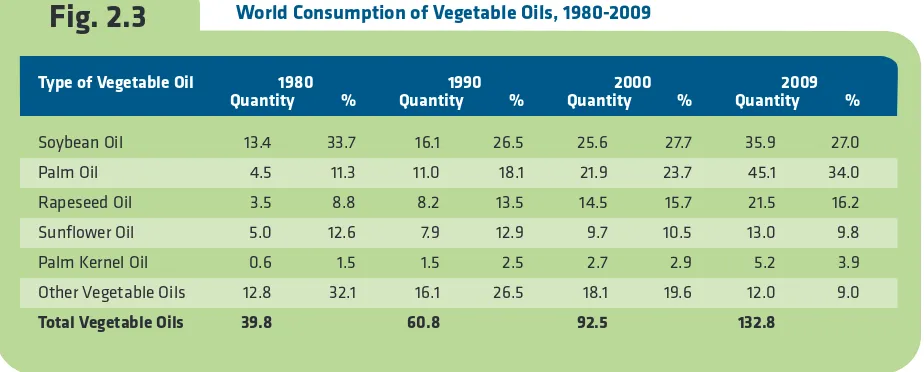
percent; the main vegetable oil on world markets was soybean, accounting for approximately a third of total consumption. The market share of soybean has since fallen, with palm oil becoming the major consumed vegetable oil. In 30 years, palm oil consumption has increased tenfold from 4.5 to 45 million tonnes (including growth of 100 percent in the last decade) and now comprises 34 percent of the world market. In 2009, despite consumption of soybean oil increasing by 22.5 million tonnes, its market share had fallen to 27 percent. Rapeseed and sunflower oil’s market shares were 16 percent and 10 percent, respectively. palm oil as the European Union is the world’s largest
consumer of bio-fuels.
Trends in the Global Consumption of Vegetable Oils
Over the past 3 decades, there has been a substantial growth in the global consumption of vegetable oil. Between 1980 and 2008 consumption increased more than threefold from 40 million tonnes to over 130 mil-lion tonnes. In addition, there has been a significant shift in the relative market share of different vegetable oils. In 1980, the market share for palm oil was 11
Fig. 2.3
World Consumption of Vegetable Oils, 1980-2009Type of Vegetable Oil 1980 1990 2000 2009
Quantity % Quantity % Quantity % Quantity %
Soybean Oil 13.4 33.7 16.1 26.5 25.6 27.7 35.9 27.0
Palm Oil 4.5 11.3 11.0 18.1 21.9 23.7 45.1 34.0
Rapeseed Oil 3.5 8.8 8.2 13.5 14.5 15.7 21.5 16.2
Sunflower Oil 5.0 12.6 7.9 12.9 9.7 10.5 13.0 9.8
Palm Kernel Oil 0.6 1.5 1.5 2.5 2.7 2.9 5.2 3.9
Other Vegetable Oils 12.8 32.1 16.1 26.5 18.1 19.6 12.0 9.0
Total Vegetable Oils 39.8 60.8 92.5 132.8
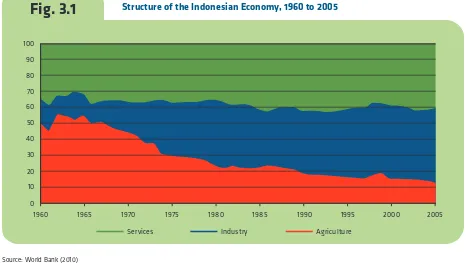
The structural composition of the Indonesian economy has changed significantly in the past four decades. As with most economies in the region, it has shifted from a primarily agrarian economy towards the industry and services sectors. Nowadays, Indonesian production is largely dominated by the industrial sector, contributing just over 48 percent to total economic activity, includ-ing the oil and gas which contribute to over 10 percent of GDP.14 The services sector and agriculture sector
contribute 38 percent and 14 percent, respectively.15
Agriculture’s Contribution to the Indonesian Economy
Indonesia’s major agricultural products include rice paddy, palm oil, chicken meat, coconuts and rubber, with major exports including Indonesia’s palm oil, rubber, palm kernel oil, cocoa and coffee. The contri-bution of agriculture to GDP has steady decreased over the past 20 years. In 2008, the agriculture sector contributed 14.4 percent of GDP (as compared with around 22.5 percent in 1988 and 18.1 percent in 1998).
III. Economic Importance of Palm Oil
to Indonesia
Indonesia’s GDP was estimated at $USD 510.77 billion in 2008, classifying it as a lower middle income coun-try. Over the past decade, GDP growth has averaged almost 5 percent (6.0 percent in 2008) and population growth has averaged 1.2 percent. GDP per capita has also grown steadily. Indonesia’s population is expected to continue to grow at an annual growth rate of 0.57 percent to over 271 million by 2030.13
Nowadays, Indonesian production is largely
dominated by the industrial sector, contributing
just over 48 percent to total economic activity,
including the oil and gas which contribute to
over 10 percent of GDP.
13 UN Data (2010)
14 Statistics Indonesia (2010)b 15 OECD (2010)
1960 1965 1970 1975 1980 1985 1990 1995 2000 2005
Services Industry Agriculture
Fig. 3.1
Structure of the Indonesian Economy, 1960 to 2005Source: World Bank (2010)
small shareholders and the remaining 10 percent by Government plantations. Private plantations repre-sent the largest producers of palm oil in Indonesia, producing over 9.4 million tonnes of palm oil valued in 2008. In the same year smallholder plantations pro-duced 6.7 million tonnes of palm oil and Government plantations produced 2.2 million tonnes of palm oil.
Palm Oil and Rural Development in Indonesia
Poverty in Indonesia is largely a rural occurrence. In 2009, of 32.5 million Indonesians living below the national poverty line, 20.6 million were located in rural
Palm Oil’s Contribution to the Indonesian Economy
Palm oil is Indonesia’s second largest agricultural product; in 2008, Indonesia produced over 18 million tonnes of palm oil. For the last decade, palm oil has been Indonesia’s most significant agricultural export. In 2008, Indonesia exported over $14.5 billion in palm oil related products.16The Indonesian palm oil
indus-try has experienced significant growth in recent years with approximately 1.3 million ha of new area dedicat-ed to palm oil plantations since 2005, reaching almost 5 million ha in 2007 (representing 10.3 percent of the 48.1 million ha of agricultural land).17This substantial
expansion is due to higher returns driven by stronger demand. The majority of Indonesia’s palm crop is located in Sumatra, with over 75 percent of total mature palm area and 80 percent of total palm oil pro-duction.18 Key Indonesian production provinces
include Riau, Sumatera Utara, Sumatera Selatan, Jambi and Sumatera Barat.
In 2008, approximately 49 percent of palm oil planta-tions were owned by private plantaplanta-tions, 41 percent by
For the last decade, palm oil has been Indonesia’s
most significant agricultural export. In 2008,
Indonesia exported over $14.5 billion in palm oil
related products.
Rice Paddy Palm Oil Chicken Meat Coconuts Natural Rubber Other
Fig. 3.2
Indonesian Commodity Share of Agricultural Production, 2009Source: FAO (2010)b
16 Indonesian Palm Oil Commission (2008), GAPKI(2009), Statistics vary amongst sources, unofficial FAO (2010) statistics estimate production in 2008 at over 16.9 million tonnes.
rural household income (wages and farming income)21. A 2004 study showed that agricultural GDP
growth in Indonesia is beneficial in reducing poverty, particularly in rural areas. Specifically, annual growth of 1 percent was found to reduce total poverty by 1.9 percentage points (urban poverty by 1.1 percentage points and rural poverty by 2.9 percentage points)22.
World growth (2009) noted that over the past decade, industry expansion—specifically palm oil—has been a significant source of poverty alleviation through farm cultivation and downstream processing.
Significant growth in the palm oil industry, has led to palm oil becoming component of economic activity in regional economies. In certain regions, palm oil is the dominant estate crop and major contributor to eco-nomic development. In the past decade, the palm oil plantation areas of Kalimantan and Suliwesi have expe-rienced strong development, averaging 13 percent and 8 percent annual growth rates, respectively.23The
planta-tion and harvesting of oil palm is labour intensive, as such, the industry contributes a significant portion of areas. The percentage of poor in rural areas of Indonesia
vastly outweighs that of their urban counterparts, with over 17.3 percent of the rural population below the pover-ty line, as compared with 10.7 percent in urban areas.19
This overall poverty rate doesn’t account for the millions who live just above the poverty line.20The International
Fund for Agricultural Development (IFAD) found that the poorest people in rural areas tend to be farm labour-ers working on other peoples land, and smallholdlabour-ers on small plots of land less than 0.5 hectares.
Over half of Indonesia’s population is located in rural areas. In 2002, agriculture represented two thirds of rural employment and contributed to almost half of
Significant growth in the palm oil industry, has
led to palm oil becoming component of economic
activity in regional economies.
19 Statistics Indonesia (2010) 20 IFAD, accessed September 2010 21 ADB (2006), pg 3
22 Sumatro and Suryahadi (2004) in ADB(2006) 23 USDA (2009)
Fig. 3.3
Key Palm Oil Areas in Malaysia and Indonesia24 Goenadi (2008), pg 3. 25 Sheil, D. et al (2009)
26 Zen et al (2006) and Sheil, D. et al (2009) 27 Hardter et al (1997), pg 99
plantations were owned by smallholders, with a fur-ther 49 percent owned by private plantations—the remaining 10 percent is owned by government. The palm oil industry makes a substantial contribution to rural incomes, particularly small land holders. In 1997, the average net income of oil palm smallholders was seven times that of farmers involved in subsistence production of food crops.27
The importance of the palm oil industry to rural devel-opment has been recognised by both the Indonesian Government and the private sector. For example, the employment in many regional areas. Goenadi (2008)
estimates that employment generated from palm oil production in Indonesia could potentially reach over 6 million lives and take them out of poverty.24Additional
benefits to palm oil workers have included secure incomes, access to healthcare and education.25Palm oil
production provides many of the rural poor with a sus-tainable income; with key palm oil developments such as Sumatera and Riau also having a significant percent-age of rural poor. Annex 1 outlines palm oil production and poverty statistics for key Indonesian provinces.
The Contribution of Palm Oil to
Local Economies and Small Land Holders
Palm oil provides employment for many small land-holders, with over 6.7 million tonnes of palm oil pro-duced by smallholders in 2008. In 2006, it was found that around 1.7 to 2 million people worked in the palm oil industry.26In 2008, the Indonesian palm oil
com-mission found that over 41 percent of total palm oil
yield
2002 2003 2004 2005 2006 2007 2008
Production (Other) Production (Smallholders)
Mature Land Area (Other) Mature Land Area (Smallholders)
Yield (Other) Yield (Smallholders)
Fig. 3.4
Production, Land Area and Yield by Plantation Type, 2002 -2008Note: Yield is calculated as total production to mature palm oil plantation area. Other is total production less smallholder production. Source: World Growth calculations from Indonesian Palm Oil Commission statistics
Goenadi (2008) estimates that employment
generated from palm oil production in Indonesia
could potentially reach over 6 million lives and
Indonesian Government has previously implemented a series of rural and socio-economic improvement pro-grams directed at small oil palm landholders. Until 2001, the use of palm oil ‘nucleus estates’ was suggested to raise the income of over 500,000 farmers. Zen et. al (2006) have also found initiatives by commercial palm oil enterprises aimed at improving the socio-economic status of many rural populations. For example, in 1996, a Sumatran company distributed three cows to the families of each of its 500 employees to graze on oil palm waste and kernel cake. By 2003, the number of cattle had doubled, area harvested per worker had increased from 10 to 15 hectares, and worker incomes had been proportionately increased. Other commercial initiatives have included community palm oil areas and nucleus estates.
Returns from Palm Oil Production
In terms of land-use, oil palm gives the highest yield per unit area as compared with any other crop-based oil seeds. The average oil yield from 1ha of oil palm is 4.09 tonnes, as compared with soybean, sunflower and rapeseed which yields 0.37, 0.5 and 0.75 tonnes, respectively.28Modern high-yielding varieties of palm,
under ideal climate conditions and good management
are able to yield 5 tonnes of palm oil per hectare, annually.29
Historically, smallholder plantations have been less productive than other palm oil plantations. In 2008, production per hectare for smallholders was estimated at 3.04 tonnes/ha as compared with 3.7 tonnes/ha for government plantations and private plantations.30
World Growth (2009) found that there is considerable potential for small holders in Indonesia to expand out-put on existing acreages through the use of fertiliser and new genetic stock.31
Goenadi (2008) suggests that, because of the growing climate in Indonesia, palm oil yields may potentially be as high as 6-7 tonnes per hectare. However, in 2008, Indonesia was averaging between 3-4 tonnes of palm oil per hectare.32Increasing the yield of palm oil
produc-tion gives Indonesia the potential to increase the pro-duction without requiring additional land conversion.
Land-use returns from oil palm are significant as com-pared with many other forms of land-use. In 2007, a report prepared for the Stern Review estimated the return from palm oil land-use as ranging from $USD960/ha to $USD3340/ha. This was in compari-son with smallholder rubber, rice fallow, cassava, and one-off timber harvesting which yielded $USD72/ha, $USD28/ha, $USD19/ha and $USD1099/ha, respec-tively. Specifically, land-use returns for palm oil were estimated as including:
• $USD960/ha for low yield independent growers;
• $USD2340/ha for high yield independent growers;
• $USD2100/ha for supported growers; and
• $USD3340/ha for large scale growers.33
In terms of land-use, oil palm gives the highest
yield per unit area as compared with any other
crop-based oil seeds.
28 Sustainable Development Project (2010) and Oil World (2010) 29 FAO (2002)
30 Indonesian Palm Oil Commission (2008) 31 World Growth (2009), pgs 13 and 14.
IV
IV. Future Prospects for Palm Oil
Future Prospects for Global Palm Oil Demand
Increased returns from a strong global demand for vegetable oils are expected to encourage investment in the palm oil industry leading to continued growth over the medium term, with global consumption expected to increase over 30 percent in the next decade.34By
2020, global consumption and production of palm oil is expected to increase to almost 60 million tonnes.
The health characteristics and cost competitiveness of palm oil, coupled with its potential contribution to renewable energy, is expected to contribute to a growth of over 30 percent in the next decade. Growth in the palm oil industry has been contributed to by the production cost advantages in oil palm cultivation. Oil palms are a highly productive tree crop in compar-ison to crop based oil seeds—oil yields are 5 to 9 times higher than the yields achieved by soybean, rapeseed and sunflower. There are cost advantages in oil palm from lower land prices and lower energy inputs.
As developed economies shift away from trans-fats towards healthier alternatives, the demand for palm oil will also likely increase relative to its competitors. In the last few years, many developed economies have moved towards reducing and banning trans-fats, as a result many food manufacturers have replaced trans-fats with palm oil. In addition to being cost competitive, palm oil is high in mono-unsaturated fats which are considered
to be advantageous for a lower risk of heart disease.35
As well as total increased total consumption, per capi-ta consumption of vegecapi-table oils has been increasing in some major developing economies due to strong income growth. Palm oil has benefited from this development due to its relatively high energy per gram of food. In 2009-10 China and India accounted for over 40 percent of the net imports in world trade. Future economic growth in these countries will increase the demand for imported vegetable oils.
Global Palm Oil Production and Opportunities
By 2020, FAPRI estimates that Indonesia will produce almost 30 million tonnes of palm oil, including exports of almost 23 million tonnes. This growth will be achieved through increased yields and further land conversion.
Malaysia appears to have limited opportunity for
In the last few years, many developed economies
have moved towards reducing and banning
trans-fats, as a result many food manufacturers
have replaced trans-fats with palm oil.
Fig. 4.1
Projections of World Palm Oil Supply and Utilization2009/2010 2019/2020
(‘000 tonnes) (‘000 tonnes) % change
Consumption 44,330 58,639 32%
Production 45,132 59,264 31%
Trade 30,760 41,649 35%
34 OECD-FAO (2009)
35 Malaysian Palm Oil Council (2008) 36 FARPI (2010)
expansion through land conversion due to land zoning restrictions. Limited land availability is expected to slow palm oil production growth, particularly in Peninsular Malaysia and Sabah.
Yield gains on existing cultivation areas are another way to expand output. But there are signs that improvements in plantation yields are slowing in Indonesia and Malaysia.37 The cost of establishing
new plantations is also increasing because of environ-mental requirements. If these trends continue and land use constraints become more restrictive there will be opportunities for other suppliers. FAPRI pre-dicts that Malaysian palm oil production will increase by 26.5 percent, to 23.4 million tonnes by 2020, slightly less than the predicted Indonesian production of 28.5 million tonnes. The favourable outlook for palm oil demand will encourage industry investment in other countries including Nigeria and Thailand who each produced over around 1.3 million tonnes, in 2008.38 Recent reports suggest Chinese companies
are negotiating for land in DR Congo and Zambia for oil palm plantations.39 There are also reports of
investors looking at plantation growth in West Africa and Malaysian companies are looking at expansion opportunities in Brazil.40
Key Challenges and Opportunities for the Indonesian Oil Palm Sector
Environmental Challenges
Increasing global palm oil production, particularly in Malaysia and Indonesia has generated gained the attention of some major NGOs, including Greenpeace, WWF and Friends of the Earth. Initially, the major opposition to palm oil was over deforestation with more recent concerns surrounding the impact of oil palm expansion on loss of biodiversity (including orang-utan habitat) and CO2 emissions. The central claim of the environmental campaign against the palm oil industry is that deforestation, especially the conver-sion of forest land to palm oil, is a major contributor to CO2 emissions. Palm cultivation on peat land and indirect land use changes are often cited as the major threat to climate change. However, there is
consider-37 Thoenes (2006)
2010 2011 2012 2013 2014 2015 2016 2017 2018 2019 2020
PRODUCTION World
CONSUMPTION TRADE
Indonesia Malaysia
Fig. 4.2
Projections of Palm Oil Supply and UtilizationMalaysia appears to have limited opportunity
for expansion due to land zoning restrictions.
Limited land availability is expected to slow palm
oil production growth, particularly in Peninsular
Malaysia and Sabah.
able uncertainty and debate about the data andmod-els used to support these claims.41The primary causes
of deforestation include urban growth, subsistence farming, housing and firewood collection.42
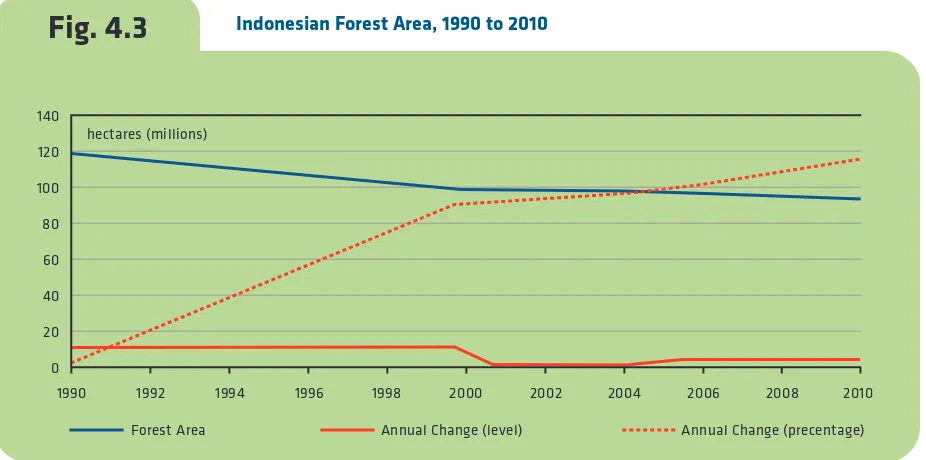
There is considerable debate as to the extent of defor-estation in Indonesia, largely due to varying interpre-tations of the term and insufficient information. In the 10 years to 2010, the FAO estimated that forest area in Indonesia has decreased 5 percent, from 99.4 million hectares to 94.4 million hectares.43This rate
of decrease has lessened from the previous decade, where forest area decreased over 1.75 percent per year from 118.5 million hectares, to 99.4 million hectares. In the past decade, although the year-on-year per-centage change in forest area has been increasing (due to a relatively smaller forest base each year) the decrease in forest area has been less in absolute terms.
Figure 4.3 depicts total forest areas and the annual rate of change in forest area in Indonesia from 1990.
Specific data on the contribution of palm oil to defor-estation is limited, and estimates vary significantly. Some statistics of the contribution of palm oil to
defor-41 World Growth (2010) states that many of these claims are made with little or no substantiation and rely almost solely on absolute statements and unfounded appeals to the emotions of consumers in developed nations. There is limited data on the relative size of Indonesian forest and oil palm area. There is no standard definition for what constitutes deforested land in Indonesia and estimates of the rates of deforestation are often based on very weak science, consequently available statistics can differ greatly. Current calculations of carbon sinks and deforestation are generally based on satellite imaging which takes into account broad-area samples only and estimates are often over stated and out-of-date. 42 FAO (2010)
43 FAO (2010)c
140 120 100 80 60 40 20 0
hectares (millions)
1990 1992 1994 1996 1998 2000 2002 2004 2006 2008 2010 Forest Area Annual Change (level) Annual Change (precentage)
Fig. 4.3
Indonesian Forest Area, 1990 to 2010estation assume that all growth in oil palm area is attributed to the conversion of forestland into palm plantations, calculating the industry’s contribution to deforestation as the change in oil palm area to the level of deforestation, over a given period. This gives a mis-leading image of palm oil’s contribution to deforesta-tion, as some expansion would be on degraded land.44
In 2008, the relative contribution of global CO2 emis-sions from deforestation and forest degradation was estimated at approximately 12 percent.45 In 2006,
Indonesia emitted 1.5 metric tonnes of CO2 per capi-ta, less than the average of both East Asia and the pacific and other lower middle income economies, and significantly less than the United Kingdom and the United States who emitted 9.3 metric tonnes and 19.3 metric tonnes, respectively.46 Despite the
cam-paign against the palm oil industry, the production of palm oil is more sustainable than any other crop based vegetable oils. Palm oil production consumes considerably less energy, uses less land and generates more oil per hectare than any other oil seeds, has a comparatively smaller carbon footprint and is an effective carbon sink.47The impact of deforestation on
biodiversity loss, particularly the loss of orang-utan
habitat is also a commonly raised concern. The pres-sure on biodiversity stems from a variety of sources including poverty, agricultural/forestry activity, insti-tutions and technology. Habitat loss is not solely due to the conversion of forest lands to oil palm planta-tions. Between 2000 and 2007, palm oil land use increased by 2.9 million hectares in comparison to other land uses which increased by 9.4 million hectares. Orang-utan habitat is also preserved through protected areas in Indonesia that have been established and are subject to a range of different laws. Over 23 percent of Indonesia is reserved for for-est conservation, including 42 percent in Aceh and 40 percent in Kalimantan.48
Land Availability Constraints
The limited availability of land for conversion to oil palm estates poses a significant challenge for the growth of the Indonesian palm oil industry as some land conversion to oil palm plantations will be required for continued industry growth. A number of NGOs have initiated a campaign against the palm oil industry and the conversion of Indonesia’s rainforests to oil palm plantations. As a consequence, the
44 Major Indonesian companies, including APP and APRIL, have made some efforts to improve the sustainability of their activities by agreeing to sustainability actions, such as commitments to protect High Value Conservation Forest, etc.
45 G.R. van der Werf (2009) 46 World Bank (2010) 47 World Growth (2009) 48 World Growth (2010)
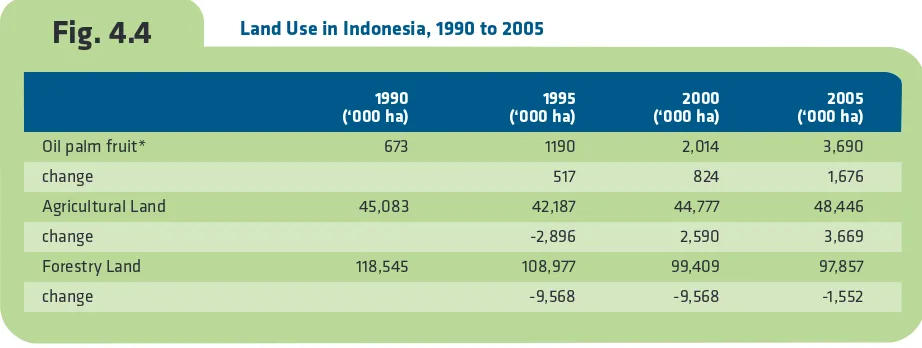
Fig. 4.4
Land Use in Indonesia, 1990 to 20051990 1995 2000 2005
(‘000 ha) (‘000 ha) (‘000 ha) (‘000 ha)
Oil palm fruit* 673 1190 2,014 3,690
change 517 824 1,676
Agricultural Land 45,083 42,187 44,777 48,446
change -2,896 2,590 3,669
Forestry Land 118,545 108,977 99,409 97,857
change -9,568 -9,568 -1,552
*Area harvested, this figure differs from Indonesian Palm Oil Commission figures who measure total area of palm oil plantations at 5.95 million ha and 7.02 million hectares in 2005 and 2008, respectively.
Indonesian Government has introduced a series of programs to tackle deforestation—the most significant is the 2 year moratorium on forest conversion49 In
May 2010, the Indonesian government signed a deal with the Norwegian Government, to impose a two-year moratorium aimed at reducing greenhouse gases; in return Norway will invest $1 billion in forest conservation projects in Indonesia. In addition, the government has also introduced a number of defor-estation programs with the financial support of sever-al developing economies. For example, the United Nations’ REDD (Reducing Emissions from Deforestation and Degradation) program contributed over $US5.6 million to Indonesia between 2009 and 2011 in an attempt to reduce deforestation.50
The successful growth of the Indonesian palm oil industry will be impacted greatly by restrictions on the conversion of land to oil palm plantations, as some level of land conversion is needed for economic devel-opment.
The Conversion of Degraded Land
In May 2010, in order to reduce deforestation, the Indonesian Government announced a policy to devel-op oil plantations on degraded land instead of further converting forest or peatland. Indonesian officials suggested that the palm oil industry could still expand through the acquisition of six million hectares of degraded land.51The current oil palm area is 7 million
hectares. However, the success of the use of degraded land depends on the extent of degradation.
There is currently no single formal definition of degrad-ed land; however, land degradation generally indicates a decline in the productive capacity of the land. Estimates of area affected by degradation vary widely. The FAO estimates that degraded land in Indonesia is largely water and wind erosion caused by deforestation and chemical deterioration. Approximately 38 percent (71 million hectares) of Indonesian land is affected by degradation (including 32 percent of land which is severely degraded and 6 percent which is very severely
degraded); of this, 30 percent is human induced degra-dation due to agricultural activities, representing 11 per-cent of total land.52
Government restrictions on the conversion of forest-lands to oil palm plantations will increase the need for Indonesia to utilise other forms of land, including degraded land. However, the success of palm oil pro-duction on degraded land depends largely on the quality of available land. Currently, there is a lack of common methodology, and accurate and timely spa-tial data, for identifying acceptable degradation areas for sustainable oil palm plantation area.53As part of
the 2010 agreement between Indonesia and Norway, the Indonesian government has agreed to establish a degraded land database, providing the necessarily information to identify areas of land acceptable for the establishment of economic activity, including oil palm plantations.54
Land Rights and Degradation
The use of degraded land for oil palm plantations is dependent on the severity of degradation and the qual-ity of land available. Land degradation occurs due to land clearance, overgrazing, poor farming practices, extensive agricultural activities, poor land manage-ment and inadequate conservation. In order to reduce the severity of land degradation, land users need incentives to manage and conserve land appropriately.
The limited availability of land for conversion to
oil palm estates poses a significant challenge for
the growth of the Indonesian palm oil industry as
some land conversion to oil palm plantations will
be required for continued industry growth.
49 Government of Indonesia and Government of Norway (2010) 50 UN-REDD (2010)
51 Reuters (2010)c
52 FAO/AGL (2010), in the 1980’s the Global Assessment of Human Induced Soil Degradation (GALSOD) estimated 16.53 percent of land area (31.4 million hectares) in Indonesia was affected by degradation.
Land-use in Indonesia is generally established under temporary rights for cultivation, clearing etc.55Since
decentralisation, rights for land cultivation and clear-ing are issued at various levels of government. The decentralisation of authority over forest resource management has resulted in confusion and a lack of accountability for land management. Djogo and Syaf (2003) suggest that decentralization of authority to manage forests, coupled with laws retaining the responsibility of conservation and rehabilitation of forests to central government has left many district government officials ambivalent toward forest reha-bilitation and conservation. There are also conflicts of authority between institutions such as the National Park Agency, the National Land Agency and the provincial and district level forest services. Conflicts between spatial planning maps developed by provin-cial and district governments, in some instances, have resulted in unauthorized land conversions endorsed by district governments without the approval of provincial or central governments.56Limited or
inse-cure land tenure is a key driver of land use changes leading to deforestation and forest degradation.57
Tenants without secured land tenure have little incen-tive to maintain and protect their land as compared with those with secure tenure. The strengthening of land tenure and use rights is needed in order to pro-vide incentive for land users to invest in land improve-ment. The incentive for land users to maintain and rehabilitate land—such that the severity of degrada-tion is reduced and land is rehabilitated—requires effective, secure and transparent land rights and accountability processes.
Closing the Productivity Gap
A significant challenge for the palm oil industry is the large productivity gap between actual and achievable yields of palm oil plantations. In Indonesia, palm oil yields averaged 3-4 tonnes/ha, however, various esti-mates of potential yields are up to 8.6 tonnes/ha.58
Almost year long sunshine, abundant rainfall, rich
54 Government of Indonesia and Government of Norway (2010) 55 Colchester et al (2006)
56 Djogo and Syaf (2003) 57 Hatcher (2009)
Fig. 4.5
National Bio-Fuel and Bio-Diesel TargetsNote: Unless specified in the table, figures refer to the percentage of bio-diesel mix e.g. 5% = 5% of bio-diesel mix. Source: Sheil et al (2009)
Target Status Policy Initiatives
Brazil 2% in 2008, 5% by 2013 Implemented Tax incentive, mandate
Canada 2% by 2010 Indicative None
China 15% bio-fuels by 2020 No concrete policy Tax support proposed
EU 5.75% by 2010, 10% by 2020 Implemented Subsidies, tax incentives
India Preparing legislation
Indonesia 2 to 5% by 2010 Proposed
Japan 5% in 2009 Preparing legislation
Korea 5% Implemented Mandate
Malaysia 5% Proposed
Philippines 1% in 2007, 2% by 2009
Thailand 10% by 2012 Implemented Tax waver, future mandate
volcanic-derived soils and familiarity with the pro-duction of palm oil give Indonesia an advantage in the production of agricultural products and palm oil.59
Goenadi (2008) suggests that these resources coupled with new palm oil breeds with superior characteristics and the current planting materials available, the genetic potential of annual production is around 6-7 tonnes of palm oil per hectare. However, in reality the average attainable yield only reaches around half of this. In 2008, the Indonesian palm oil commission measured palm oil yield as averaging between 3-4 tonnes per hectare. There needs to be substantial effort in order to reduce this gap, Goenadi suggests that such an effort would include step-by-step land preparation, routine field management and adaption of new technologies. Improvement in productivity, particularly among smallholders, provides the great-est challenge. Variations in the yields of smallholder plantations are also significant, likely due to differ-ence in farming practises and inputs than the genetic potential of plants.60 Improving the productivity of
palm oil producers improves the profitability of the sector without significant increases in land use or costs of production. An increase of 20 percent in pro-duction could produce an additional 3.7 million tonnes of palm oil in Indonesia, equivalent to current production from around 1.07 million hectares.61
Other key challenges for the productivity of the Indonesian palm oil sector, particularly in Kalimantan, include low soil fertility, a periodic dry season and potential land conflict.62
Indonesian Bio-diesel Industry
Although palm oil currently accounts for less than 5 percent of the world’s bio-diesel production, demand is likely to increase as economies adopt policies that encourage the use of bio-fuel.63 Despite a relatively
low market share, palm oil is often used as feedstock in bio-diesel production, and as feedstock represents the major cost of production, a bio-diesel industry is a viable option for Indonesia. Many economies are set-ting targets to convert reliance on fossil fuels to
58 Henson (1990) 59 Goenadi (2008), pg 2 60 Hai Teoh (2010)
61 Calculated from Indonesian Palm Oil Commission data 62 Perba et al (2006)
63 Sheil et al (2009) 64 Bio-fuel Indonesia (2010)
greater use of renewable energy, including bio-fuel, in efforts to reduce GHG emissions increasing global demand for alternative fuel options. Increased demand coupled with Indonesia’s abundance of labour and status as a global oil and petroleum producer, places Indonesia in a relatively good position for the production of bio-diesel. The Indonesian government has already made a firm commitment to the develop-ment of bio-fuel, including the developdevelop-ment an inte-grated strategy for implementation of a bio-fuel program64 For example, countries including the
European Union, China, the USA, etc, have set fuel
blending targets for bio-diesel ranging from 2 percent in the Philippines to 10 percent in the European Union, by 2020.
Although palm oil currently accounts for less than
5 percent of the world’s bio-diesel production,
demand is likely to increase as economies adopt
References
Ansari, F., Bhartata, A., Hudata, A., Kurniawan, P.M. and Rianda E., (2007) Indonesian Tropical Deforestation: APRIL and APP case studies, Erasmus Universiteit Rotterdam.
Asian Development Bank (1995), Project Completion Report, accessible at: http://www.adb.org/Documents/PCRs/INO/18110-INO-PCR.pdf, accessed in September 2010
Asian Development Bank (2006), Indonesia: Strategic Vision for Agriculture and Rural Development.
Bio-fuel Indonesia (2010), accessible at: http://www.bio-fuelindonesia.com, accessed in September 2010
Cheng Hai Teoh (2010), Key Sustainability Issues in the palm oil sector, accessible at:
http://www.ifc.org/ifcext/agriconsultation.nsf/AttachmentsByTitle/Discussion+Paper/$FILE/Discussion+Paper_ FINAL.pdf, accessed in September 2010
Darby, Sime (undated), website content, available at http://www.simedarbyplantation.com/Bio-diesel_ -_Overseas.aspx, accessed in September 2010
Djago, T. And Syaf, R. (2003), Decentralization without Accountability: Power and Authority over Local Forest Governance in Indonesia, available at: http://www.cifor.cgiar.org/acm/download/pub/djogo-EWC.pdf, accessed in September 2010
Economist (2009), The scramble for land in Africa and Asia, 21 May, available at:
http://www.economist.com/PrinterFriendly.cfm?story_id=13692889&source=login_payBarrier
European Union (2003) The Directive on the Promotion of the use of bio-fuels and other renewable fuels for transport (2003/30/EC), accessed at: http://eur-lex.europa.eu/LexUriServ/LexUriServ.do?uri=CELEX:32009L0028:EN:NOT
Food and Agricultural Policy Research Institute (2010). U.S. and World Agricultural Outlook. FARPI, Iowa. Available at: http://www.fapri.iastate.edu/outlook/2010/, accessed in September 2010
Food and Agricultural Policy Research (2010)b, Food and agricultural commodities production statistics: Indonesia and Production Indices: Indonesia accessible at: http://faostat.fao.org, accessed September 2010.
Food and Agricultural Policy Research (2010)c, Global Forest Resources Assessment 2010: Country Report Indonesia, The Forest Resources Assessment Programme.
Food and Agricultural Policy Research (2005), National Soil Degradation Maps, accessible at:
http://www.fao.org/landandwater/agll/glasod/glasodmaps.jsp?country=IDN&search=Display+map+! Accessed September 2010.
Food and Agricultural Policy Research Unit (2001), Contract Farming: Partnerships for Growth, Chapter 3: Types of Contract Farming, accessible at: http://www.fao.org/docrep/004/y0937e/y0937e05.htm, accessed in September 2010
Food and Agriculture Organisation of the United Nations (FAO), (2002), ‘Small-Scale Palm Oil Processing in africa’, Chapter 3, FAO Agricultural Services Bulletin 148, accessible at: http://www.fao.org/DOCREP/005/y4355e/y4355e03.htm, accessed in September 2010
Food and Agriculture Organisation of the United Nations (FAO), (2010), Global Forest Resources Assessment 2010, accessible at: http://www.fao.org/forestry/fra/fra2010/en/, accessed in September 2010
FAOSTAT (2010), http://faostat.fao.org/site/291/default.aspx, accessed in September 2010
FAO TradeSTAT (2010), http://faostat.fao.org/site/342/default.aspx, accessed in September 2010
FAO ProdSTAT (2010), http://faostat.fao.org/site/339/default.aspx, accessed in September 2010
Food and Agriculture Organisation of the United Nations Land and Water Development Department (FAO/AGL), (2010) TERRASTAT, accessible at: http://www.fao.org/ag/agl/agll/terrastat/wsrout.asp?wsreport=4®ion=1&search=Display+ statistics+!, accessed September 2010
GAPKI (2009), ‘Build Indonesia with Palm Oil’, in InfoSARWIT magazine.
Greig-Gran M. (2008) The Cost of Avoiding Deforestation: Update of the Report Prepared for the Stern Review of the Economics of Climate Change, International Institute for Environment and Development.
G.R. van der Werf, et al. (2009), ‘CO2 emissions from forest loss’, Nature Geoscience, pgs 737-738
Goenardi (2008), Prospective on Indonesian Palm Oil Production, Paper presented on the International Food & Agricultural Trade Policy Council’s Spring 2008 Meeting, 12 May 2008, Bogor, Indonesia
Government of Indonesia and Government of Norway (2010), Letter of Intent between the Government of the Kingdom of Norway and the Government of the Republic of Indonesia on “Cooperating on reducing greenhouse gas emissions from deforestation and forest degradation”, accessible at: http://www.redd-monitor.org/wordpress/wp-content/uploads/2010/05/ Norway-Indonesia-LoI.pdf, accessed in September 2010.
Hardter, R., Chow, W. Y., and Hock, O. S. (1997), ‘Intensive plantation cropping, a source of sustainable food and energy production in the tropical rain forest areas in Southeast Asia’, Forest Ecology and Management, Vol. 91, No. 1, pgs 93 to 102.
Hatcher, J. (2009), Securing Tenure Rights and Reducing Emissions from Deforestation and Degradation, Social Development Papers: Social dimensions of climate change, Paper No.120/December 2009
Independent Evaluation Group (2001) Nucleus Estates and Smallholders Projects in Indonesia, accessible at:
http://lnweb90.worldbank.org/oed/oeddoclib.nsf/DocUNIDViewForJavaSearch/95d104dd2107d21d852567f5005d8461?Open Document&Click= accessed September 2010.
Indonesian Palm Oil Commission (2008), Indonesian Palm Oil Statistics 2008, Indonesian Department of Agriculture, Jakarta.
International Fund for Agricultural Development (IFAD), Rural Poverty in Indonesia, accessible at: http://www.ruralpovertyportal.org/web/guest/country/home/tags/indonesia accessed in September 2010.
Malaysian Palm Oil Council (2008), Facts on Fats, Global Oils & Fats Business Magazine, Vol. 5, Issue No. 3
Neste Oil (2007), Neste Oil to build a NExBTL Renewable Diesel plant in Singapore, Press Release available at: http://www.nesteoil.com/default.asp?path=1;41;540;1259;1261;7440;9494
Sheil, D. et al (2009) The impacts and opportunities of oil palm in Southeast Asia, CIFOR, Occasional Paper No. 51
OECD-FAO (2009), Agricultural Outlook 2009, accessible at: www.agri-outlook.org
Oil world (2008), Oil World Annual 2010, Hamburg
Perba et al (2006), Yield Potential of Oil Palm in Indonesia: A Country report, presented at the International Seminar on Yield Potential in Oil Palm II, accessible at: http://isopb.org/?kit=links&menuid=6, accessed in September 2010.
Reuters (2010), Wilmar aims to grow sugar business in Indonesia, Brazil, 6 July, available at: http://www.reuters.com/article/idUSSGE6650ES20100706
Reuters (2010)b, Q+A-Indonesia issues draft rules on forest clearing, 6 July, available at:
http://af.reuters.com/article/energyOilNews/idAFJAK26185620100706?pageNumber=2&virtualBrandChannel=0
Reuters (2010)c, Indonesia says it won’t revoke existing forestry licenses, available at: http://www.alertnet.org/thenews/newsdesk/SGE65109U.htm, accessed in September 2010.
Statistics Indonesia (2010), Number and Percentage of Poor People, Poverty Line, Poverty Gap Index, Poverty Severity Index by Province,
http://dds.bps.go.id/eng/tab_sub/view.php?tabel=1&daftar=1&id_subyek=23¬ab=3, accessed in September 2010.
Statistics Indonesia (2010), Gross Regional Domestic Product at Current Market Prices by Provinces,
http://dds.bps.go.id/eng/tab_sub/view.php?tabel=1&daftar=1&id_subyek=52¬ab=1, accessed in September 2010.
Statistics Indonesia (2010)b, Gross Domestic Product at Current Market Prices by Industrial Origin, accessible at: http://dds.bps.go.id/eng/tab_sub/view.php?tabel=1&daftar=1&id_subyek=11¬ab=1
Sustainable Development Project (2010), Submission to the World Bank’s Framework for Engagement in the Palm Oil Sector, accessible at: http://sustainabledev.org/wp-content/uploads/2010/08/100823-SUBMISSION-World-Bank-and-Palm-Oil.pdf
Thoenes, P. (2006). Bio-fuels and Commodity Markets—Palm Oil Focus 1. FAO Commodities and Trade Division, Rome.
United Nations (2010), UNData a world of Information accessible at: http://data.un.org/, accessed in September 2010
United Nations collaborative program on Reducing Emissions from Deforestation and forest Degradation in developing coun-tries (UN-REDD), (2010), accessible at: http://www.un-redd.org/AboutREDD/tabid/582/Default.aspx, accessed in September 2010.
United States Department of Agriculture (2009), Indonesia: Palm oil production growth to continue, accessible at: http://www.pecad.fas.usda.gov/highlights/2009/03/Indonesia/ accessed in September 2010.
Wicke, B. et al (2008), Drivers of land use change and the role of palm oil production in Indonesia and Malaysia: Overview of past developments and future projections, Copernicus Institute, Universiteit Utrecht.
World Bank (2010), Agriculture & Rural Development Data, http://data.worldbank.org/topic/agriculture-and-rural-develop-ment, accessed in September 2010
World Bank (2010),Country Data: Indonesia, available at: http://data.worldbank.org/country/indonesia, accessed in September 2010
http://www.worldgrowth.org/assets/files/WG_Forestry_Conversion_Report.pdf
World Growth (2010), Caught Red Handed, accessible at:
http://www.worldgrowth.org/assets/files/WG_Green_Paper_Caught_Red_Handed_5_10.pdf
World Growth (2009). Palm Oil—The Sustainable Oil. Arlington, VA. Available at: http://www.worldgrowth.org/assets/files/Palm_Oil.pdf
World Resources Institute (2010), Degraded Land, Sustainable Palm Oil, and Indonesia’s Future, accessible at:
http://www.wri.org/stories/2010/07/degraded-land-sustainable-palm-oil-and-indonesias-future, accessed in September 2010.
Annex: Palm Oil Production and Poverty by Province
The following table outlines palm oil production statistics for Indonesia’s top five palm oil producing provinces (Riau, Sumatera Utara, Sumatera Selatan, Jambi and Sumatera Barat) and five poorest palm oil producing provinces (Irian Jaya Barat, Sulawesi Tenggara, Sulawesi Tengah, Lampung and Bengkulu).
Table 1
Indonesian Palm Oil Production and Poverty by Province, 2007GRDP Pop* % of Severity Small
Name (RP trillions) (millions) Poor Index Private Holder Govern. Total
Riau 210.0 4.45 12.9 0.67 2,131,450 2,054,854 335,245 4,521,549
Sumatera Utara 181.8 12.99 13.63 0.51 1,664,575 1,022,472 1,025,005 3,712,052
Sumatera Selatan 109.9 7.45 18.43 0.83 855,521 759,034 140,346 1,754,901
Jambi 32.1 3.09 7.81 0.32 434,899 709,242 133,531 1,277,672
Sumatera Barat 59.8 4.85 13.01 0.52 548,316 326,580 40,998 915,894
Irian Jaya Barat 10.4 0.76 48.84 7.29 15,915 25,366 32,087 73,368
Sulawesi Tenggara 18.0 2.23 25.84 1.52 0 0 10274 10274
Sulawesi Tengah 19.3 2.63 24.97 1.6 97,077 8,180 9,173 114,430
Lampung 49.1 7.60 23.7 1.12 149,262 162,590 36,376 348,228
Bengkulu 11.4 1.71 21.66 0.92 208,923 217,022 8,072 434,017
Indonesia 3,950 237.56 17.35 n.a. 9,263,089 6,358,388 2,174,897 17,796,374
A
NNE
X
Note: * As measured by the 2010 census
PO Box 3693 Arlington, VA 22203-3693
(866) 467-7200