JUDUL: TREATING HAZARDOUS LOCATIONS AT FEDERAL ROUTE 50
SESI PENGAJIAN: 2005/2006
Saya: FAJARUDDIN BIN MUSTAKIM________________ (HURUF BESAR)
mengaku membenarkan tesis (PSM/Sarjana/Doktor Falsafah)* ini disimpan di Perpustakaan Universiti Teknologi Malaysia dengan syarat-syarat kegunaan seperti berikut :
1. Tesis adalah hakmilik Universiti Teknologi Malaysia.
2. Perpustakaan Universiti Teknologi Malaysia dibenarkan membuat salinan untuk tujuan pengajian sahaja.
3. Perpustakaan dibenarkan membuat salinan tesis ini sebagai bahan pertukaran antara institusi pengajian tinggi.
4. ** Sila tandakan ( 9 )
SULIT (Mengandungi maklumat yang berdarjah keselamatan atau kepentingan Malysia seperti yang termaktub di dalam AKTA RAHSIA RASMI 1972)
TERHAD (Mengandungi maklumat TERHAD yang telah ditentukan oleh organisasi/badan di mana penyelidikan dijalankan)
9 TIDAK TERHAD
Disahkan oleh
__________________________________ ___________________________________ (TANDATANGAN PENULIS) (TANDATANGAN PENYELIA)
Alamat Tetap:
NO 8. JALAN HASSAN AL-ATTAS-1, DR. MOHD ROSLI HAININ
86100 JOHOR BAHRU. Nama Penyelia
Tarikh: OGOS 2005
CATATAN: * Potong yang tidak berkenaan.
** Jika tesis ini SULIT atau TERHAD, sila lampirkan surat daripada pihak berkuasa/organisasi berkenaan dengan menyatakan sekali sebab dan tempoh tesis ini perlu dikelaskan sebagai SULIT atau TERHAD.
Tesis dimaksudkan sebagai tesis bagi Ijazah Doktor Falsafah dan Sarjana secara penyelidikan, atau disertasi bagi pengajian secara kerja kursus dan penyelidikan, atau Laporan Projek Sarjana Muda (PSM).
I hereby declare that I have read this project report and in my opinion this report is sufficient in terms of scope and quality for the award of the degree of Master Science (Construction Management).
Signature : ………..
DR. MOHD ROSLI HAININ
Name of Supervisor I : ………..
Date : ………..
Signature : ………
PM. DR. ABDUL AZIZ CHIK
Name of Supervisor II : ………
I declare that this project entitled “Treating Hazardous Location at Federal Route 50” is the result of my own research except as cited in the references. The report has not been accepted for any degree and is not concurrently submitted in candidature of any other degree.
Signature : ………...
FAJARUDDIN BIN MUSTAKIM
Name : ………
FAJARUDDIN BIN MUSTAKIM
A project report submitted is partial fulfillment of the requirements for the award of the degree of Master of Science (Construction Management)
Faculty of Civil Engineering Universiti Teknologi Malaysia
ACKNOWLEDGEMENT
In the name of Allah, the Most Gracious, the Dispenser of Grace, salam to Prophet Muhammad s.a.w., his companions, his friends and people who follow his part. I wish to express my appreciations to my project supervisor, Dr. Rosli Hainin and my second supervisor Professor Madya Dr. Abdul Aziz Chik for their help and guidance given from the beginning till the end of the project.
Thanks to Tn. Hj. Ismail Yusof, Basil David Daniel, Koperal Salim, Ahmad Raqib Abd. Ghani, Kamarudin Ambak, Mohamad Rejabhad Abang and all who played part in successful completion of this work. I would like to express special gratitude to my wife, Rosmah Bt. Sarmin and my son Muhammad Fateh for their support and understanding. Thank also to my dad, mum and family for their enthusiastic support and prayer to complete this report successfully.
ABSTRACT
Total number of road accident in Malaysia exceeded 299,305 in year 2003 alone. Average person died from this road accident every single day were 16 persons. Lack of attention, reckless driving, lack of proper protection, speeding and bad personal habit are some of the problems that cause accident. Federal Route 50 from Batu Pahat – Ayer Hitam experience 3,937 road traffic accident from year 2000 to 2004, of these 1,160 were casualty accidents. These accidents killed 116 people and injuring 1,044 people. This research was undertaken to identify factors that may contribute to the cause of accidents and to propose improvement at the selected location in order to reduce the accident rate. In this study, Pintas Puding KM20 was selected as the study section based on the blackspot ranking. The road accident trends and blackspot ranking were established at Federal Route 50 (FT 50) Batu Pahat – Ayer Hitam. Statistical analysis, collision diagram, traffic studies and spot speed studies were carried out for greater understanding of the problem. Skid Resistance Test were also conducted at Section 19(KUiTTHO and Fujitsu factory), Section 20 (Pintas Puding) and Section 21 (Taman Maju and Taman Sri Raja). The result showed that only skid resistance value (SRV) obtained at KUiTTHO traffic light was less than minimum skid resistance requirement. Further more, this study manage to develop the accident prediction model for Federal Route 50 by using Multiple Linear Regression. It also revealed that increase of the accident rates can be explained by either the rise in traffic volume, speed or number or access points.
ABSTRAK
Jumlah keseluruhan kemalangan jalan di Malaysia telah mencecah kepada 299,305 dalam tahun 2003. Purata kematian bagi jalan ini untuk setiap hari adalah 16 orang. Faktor seperti kurang memberi perhatian semasa memandu, cuai semasa memandu, memandu dengan laju dan sifat buruk individu adalah sebahagian daripada punca berlakunya kemalangan. Didapati Jalan Persekutuan 50 dari Batu Pahat ke Ayer Hitam mengalami 3,937 kes kemalangan dari tahun 2000 hingga 2004. Daripada jumlah ini, 116 adalah kes menyebabkan kematian dan 1,044 orang mengalami cedera parah dan cedera ringan. Kajian ini dijalankan adalah untuk mengenalpasti faktor-faktor yang menyebabkan kemalangan dan cadangan untuk memperbaiki keadaan tempat kemalangan. Dalam kajian ini Pintas Puding KM20, telah dipilih sebagai kawasan kajian berdasarkan kedudukannya di dalam senarai hitam. Pada peringkat awal, bentuk kemalangan dikenalpasti dan menghasilkan kedudukan senarai hitam bagi setiap kilometer di FT 50 (KM 1 hingga KM 38). Analisis statistik, gambarajah kemalangan, kajian lalulintas, kajian halaju kenderaan dan ujian gelinciran dilaksanakan di dalam kajian bagi mendapatkan kefahaman yang lebih jelas. Kajian ini juga berjaya menghasilkan model jangkaan kemalangan untuk Jalan Persekutuan 50 dengan menggunakan kaedah “ Multiple Linear Regression”. Kajian ini mendapati bahawa dengan bertambahnya kadar kemalangan adalah disebabkan oleh pengaruh jumlah kenderaan, kelajuan kenderaan dan jumlah persempangan.
TABLE OF CONTENT
CHAPTER TOPIC PAGE
STATUS OF THESIS SUPERVISOR’S DECLARATION DECLARATION ON COOPERATION TITLE DEDICATION ACKNOWLEDGEMENT i ABSTRACT ii TABLE OF CONTENT iv LIST OF TABLES ix LIST OF FIGURES x
LIST OF APPENDICES xii
CHAPTER I INTRODUCTION 1
1.1 Introduction 1 1.2 Background of Federal Route 50 5 1.2.1 Project Particular 5
1.6 Methodology 10
CHAPTER II LITERATURE REVIEW 11
2.1 Introduction 12 2.2 Road Accident 14
2.3 Approaches to Improving Road Safety 15 2.3.1 Accident Prevention 15 2.3.2 Accident Reduction 15 2.3.2.1 Single Site 16 2.3.2.2 Mass Action Schemes 16 2.3.2.3 Route Action Plan 17 2.3.2.4 Area-Wide Measures 18 2.4 Road Safety in Malaysia 19
2.5 Collection and Compilation of Accident 22 Data in Malaysia
2.6 Identifying Accident Blackspot 24 2.7 Accident Analysis 25 2.8 Development Countermeasures 26 2.9 Surface Treatment and Texture 27
2.10 Relating Accident to Traffic Volume 29 2.11 Relating Accident to Vehicle Speed 29 2.12 Relating Accident of Access Points 31
3.1 Introduction 33 3.2 Accident Data 35 3.3 Analysis of Accident Data 36 3.4 Identify Blackspot Location 36 3.4.1 Ranking Accident Point Weightage 37
3.4.2 Ranking of the Top Ten 37 Accident Section
3.4.3 Kilometer Post Analysis 37 3.5 Collision Diagram 38 3.6 Flied Investigation 39 3.6.1 Drive-Over Inspection 40 3.6.2 Walk-Over Inspection 40 3.6.3 Traffic Count 41 3.6.4 Skid Resistance Test 42 3.6.4.1 Procedure for the 44
application of Pendulum Skid Tester
3.6.4.2 Skid Resistance Value 45 3.7 Data Collection for Accident Model 46 3.8 Data Analysis 46 3.9 Validation of The Model 47
CHAPTER IV RESULT AND ANALYSIS 50
4.1 Introduction 50 4.2 Road Accident Trends and 51
Day Year 2004
4.2.3 Total Number of Accidents 55 by Light Condition
4.2.4 Accidents by Month Year 2004 56 4.3 Identification of Blackspot Location 57
4.3.1 Ranking Accident Point Weightage 58 4.3.2 Ranking of the Top Ten 60
Accident Section.
4.3.3 Kilometer Post Analysis 61 4.3.4 Refining the Ranking by 63
Statistical Techniques
4.4 Accident Data at Pintas Puding KM 20 64 4.4.1 Analysis of Accident Data 65 4.4.2 Inspection at Pintas Puding Site 66
4.4.3 The Inspections Results 67 4.4.4 Number of Drivers/Riders Involved 68
in Accidents by Type of Faults
4.4.5 Types of Vehicle Involved 70 in Accident
4.4.6 Traffic Studies 72 4.4.7 Skid Resistance Test 77 4.6.7.1 Discussion Skid 79
Resistance Test
4.5 The Accident Prediction Model 80 4.6 The Contributory and Their Effects on 80 Federal Route 50
5.1 Introduction 83 5.2 Development of Accident 84
Countermeasures
5.3 Countermeasures at Pintas Puding 84 5.4 Skid Resistance 86 5.5 Accident Prediction Model 86
TABLE SUBJECT PAGE
Table 1.1 Worst Ranking by Weightage (1999-2001) 8 Table 2.1 Mass Action- Problem Factor and Possible Mass Action 17 Table 2.2 Distribution of Fatalities and Other Injuries Based 19
on Statistics for Duration 1987-2003
Table 2.3 Number of Motor Vehicle in Malaysia 20 Table 2.4 Effect of Reduced Speed and Compliance With Speed 30
Limit on Accident Rates CN Kloeden, AJ McLean, VN Moore and G Ponte
Table 2.5 Regression Coefficient β for The Different Road Classes 32 Hadi et al
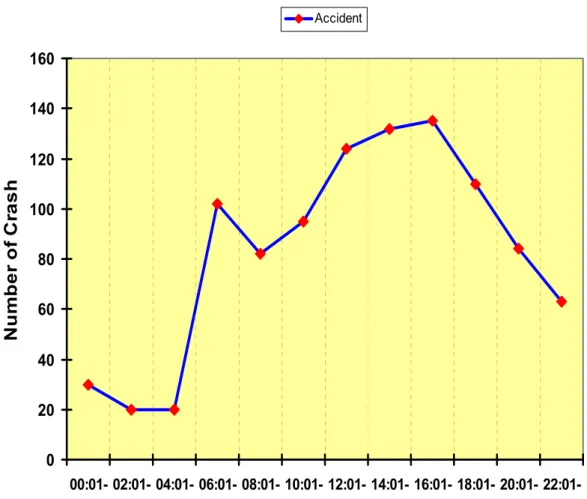
Table 4.1 Accidents by Hours of the Day 53 Table 4.2 Accident by Month Year 2004 56 Table 4.3 Ranking Accident Point Weighting Along a Route FT50 59
(KM 1-38) Over a 3 Years Period (2002-2004)
Table 4.4 Ranking of Top Ten Section Accident at FT 50 Over a 3 60 Years Period (2002-2004)
Table 4.5 Histogram of Injury Accident at 11KM Length of Federal 62 Route 50 Over 3 Years Period
Table 4.6 Number of Drivers/Riders Involved in Accidents 68 by Type of Fault
Table 4.7 Number of Vehicles Involved by Type of Accidents 70 at KM 20
Table 4.10 Afternoon Peak Hour 65 Table 4.11 Category Traffic Volume at Pintas Puding for 6 Hours 67
Survey Period
Table 4.12 Skid Resistance Value 77 Table 4.13 Suggested Minimum Values of ‘Skid Resistance’ 78 Table 4.14 Past Studies Which Support the Findings of this Study 81
LIST OF FIGURES
FIGURE SUBJECT PAGE
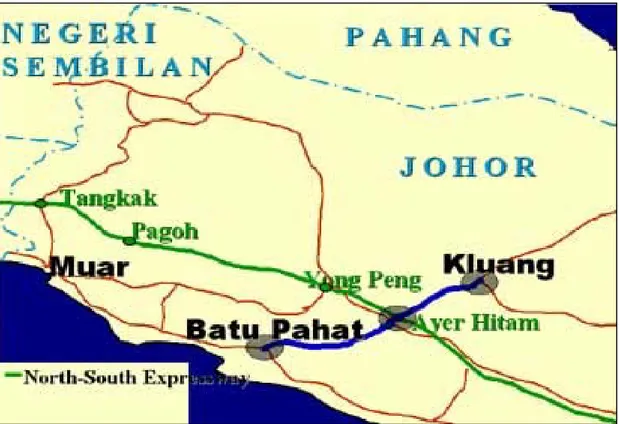
Figure 1.1 Location of Federal Route 50 6 Batu Pahat-Ayer Hitam-Kluang
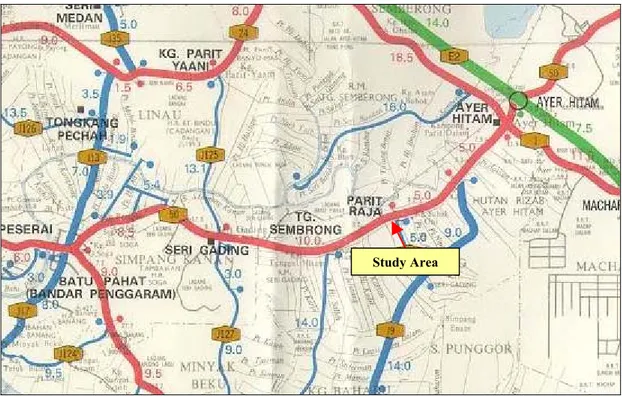
Figure 1.2 Location of Study Area 7 Figure 2.1 Accident Statistics (1993-2003) 21 Figure 2.2 Fatalities Trend in Malaysia 21 Figure 2.3 Malaysia Accident Data Collection 23 Figure 2.4 Portable Hand-held Pendulum Device to 28
Measure Skid Resistance
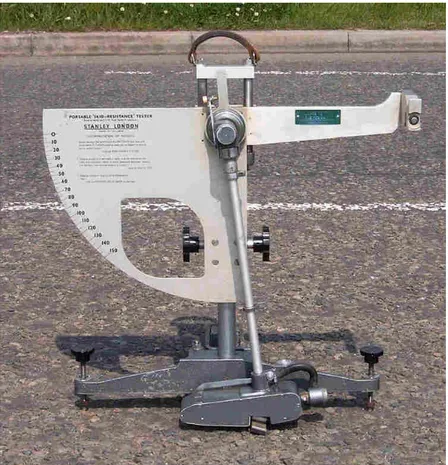
Figure 3.1 Five Main Steps in Methodology Process 34 Figure 3.2 Pendulum Skid Resistance Tester (BSI ,1990) 43 Figure 3.3 Skid Resistance/Temperature Correction Relationship 45
Figure 4.4 Accident by Month Year 2004 57 Figure 4.5 Collision Diagram at Pintas Puding 65 Figure 4.6 Batu Pahat–Ayer Hitam and Ayer Hitam 66
Batu Pahat Direction at Pintas Puding KM20.
Figure 4.7 Traffic Movement at Pintas Puding 67 Figure 4.8 Number of Drivers/Riders Involved in Accident by 73
types of Fault
Figure 4.9 Number Of Vehicles Involved by type of Accidents 74 at KM 20
Figure 4.10 Vehicle Movement from Batu Pahat–Ayer Hitam 74 Direction at Pintas Puding.
Figure 4.11 Vehicle Movement from Ayer Hitam–Batu Pahat 73 Direction at Pintas Puding.
Figure 4.12 The Temporal Fluctuations in Traffic Volumes 75 throughout a Typical Weekday
Figure 4.13 Category of Traffic Volume at Pintas Puding KM20 76 Figure 5.1 Countermeasure Diagram at Pintas Puding KM20 85
APPENDICES 91 Appendix A 91 Appendix B 99 Appendix C 118 Appendix D 125 Appendix E 137 Appendix F 148 Appendix G 179 Appendix H 180 Appendix I 181 Appendix J 182 Appendix K 183 Appendix L 184 Appendix M 186
CHAPTER 1
INTRODUCTION
1.1 INTRODUCTION
In Asia alone, 400,000 people are killed on the roads annually and more than four million injured. According to World Health Organization, every year, nearly one million people are killed, three millions are severely disabled for life and thirty millions are injured in road traffic accidents. In 1990, death on road accident remained in 9th rank and in the year 2020 road accident will be the third leading cause of death worldwide (1).
In Malaysia, Federal Traffic Police Chief Datuk Gingkoi Seman Pancras (2) said there was no guarantee that the number of road deaths could be reduced as there were 400,000 new drivers every year, leading to a 50 per cent increase in the number of vehicles on the roads. We hope to reduce the number of fatalities with the co-operation of road users. The total number of fatalities from road accident in the year 2004 dropped to 6,223 from 6,286 fatalities record in 2003 as a result of various road safety campaigns.
Growth in urbanization and in the number of vehicle in many developing countries has led to the increase in traffic accidents on road networks which were never designed for the volumes and types of traffic which they are now required to carry. In addition, unplanned urban growth has led to incompatible land uses, with high levels of pedestrians/vehicle conflicts. The drift from rural areas to urban
As a result, there has often been a severe deterioration in driving conditions and significant increase in hazards and competition between different class of road users of the road system. In addition, the inherent dangers have often been worsened by poor road maintenance, badly design intersections and inadequate provision for pedestrians. All of these have contributed to serious road safety problem now commonly found in developing countries.
Too many road projects could be the reason why road agencies responsible for the maintenance cannot keep pace with road building. The result is that roads are often badly in need of maintenance, traffic signing is often inadequate, facilities for pedestrians are poor and guidance to drivers via channelisation or other control measures is rarely available. These general deficiencies in the operational and control aspects of the road systems are worsened by the fact that drivers are rarely adequately trained and tested, traffic law enforcement is ineffective and drivers behavior in respect of compliance with the regulation is frequently very poor. The net result of these inadequacies is the very high incidence of road accident involving casualties and fatalities.
Gradual elimination of the most hazardous locations on road networks and the adoption of safety conscious approaches to the design and planning of new road networks have contributed greatly towards improving traffic safety. Even though the eventual solutions may differ, the approaches and systematic methods used in industrialized countries are readily applicable to the developing world.
In some respect developing countries are fortunate in that their road networks are usually still at an early stage of development. They also have the added advantage of being able to draw upon the experience of the developed countries which have already passed through similar stage development, albeit more slowly. Adoption of proven strategies from industrialized countries (such as ‘accident blacksport’ elimination and more safety conscious design and planning of road networks) offer unparalleled opportunities to make significant and lasting
lead to safety problems.
One thing that all industrialized countries have found to be of crucial importance in their effort to improve safety is the availability of accurate and comprehensive accident data, so that the problem can be properly defined and suitable remedial measures can be devised. Consequently, before developing countries can emulate industrialized countries, it is essential that good accident data system are established.
In order to maximize the impact which engineering can have upon safety problems, it is necessary to apply measures at various stages in the development of road networks. By incorporating good design principles from the start it is possible to avoid many problems simply by planning and designing new roads in a safety conscious manner. Even where this has not been done, it may still be possible (although more expensive) to improve existing road by subsequent introduction of safety or environment related measures, selective road closures or road humps to reduce speeds, or by prohibitions on heavy goods vehicles in residential areas.
It is possible to identify hazardous sections of the road network so that appropriate remedial measures can be undertaken to reduce the likelihood and severity of accidents at those locations. This has proven to be one of the most cost-effective ways of improving road safety in industrialized countries (3)
Accident prediction models have been developed through statistical analysis for this purpose. Accident models are typically of Poisson and generalized linear forms, but more recently, negative binomial models, a variant of the Poisson model, have been used in accident modeling.
An accident model is generally an algorithm pitting a dependent variable against several independent variables, each of which is assigned a constant. The dependent variable in an accident prediction model is the number of accidents, while
as type of terrain, road shoulder and median.
The estimation of the number of accidents is not only performed to determine the effect of design elements, but may also be used in estimating accident reductions attributed to changes in the cross section of roads, assessing the potential safety impact of alternative cross sections when upgrading roads, predicting accident costs and as a measure of safety.
out engineering feasibility study, detail engineering design and construction for the project ‘ Menaiktaraf Jalan Persekutuan Laluan 50 Dari Batu Pahat – Ayer Hitam – Kluang, Johor Darul Takzim’. The location of the project is as shown in Figure 1.1. This project is made up of one continuous stretch of road about 47 km long from km Chainage 0.00 Batu Pahat to Chainage 47 Kluang, Johor (HPU Traffic Census Station – JR 111). The road has sixteen (16) hours traffic of 27,135 veh/day with motorcycles forming about 25% of the traffic composition).
The proposed road was an upgrading of the existing road with cross of two lane two way to four lanes undivided carriageway. The project used design and built concept . The project rewarded was on the September 8, 2001, the work on project started on February 15, 2002 and was completed on August 14, 2004. The total duration to complete this project was about 30 months while the total cost involved for this project was RM 313,314,506.00.
1.2.1 Project Particular
The study covers Federal Route 50 (FT 50) Batu Pahat – Ayer Hitam as shown in Figure 1.1. The total stretch of the road is 27 km and the speed design is 100km/hour if there are no obstacles. Almost every one kilometer along the stretch, there is one access at the left and right side of the road. Land use surrounding the road is comprised of industrial area, town, cemeteries, mosques, schools, residential areas, colleges, factories, villages and palm oil farm. This road needed to reduce the speed design to avoid effect for the building and cemetery area.
Figure 1.1: Location of Federal Route 50 Batu Pahat- Ayer Hitam- Kluang
1.3 Study Area
Federal Route 50 (FT 50) is a four lanes undivided road that runs from Batu Pahat to Ayer Hitam. The road has many access almost every kilometer and carries approximately 51,613 veh/day with 4,197 veh/hr at the peak hour and the normal growth of 7.7%. The road also has a high density of driveways and property access. This study will analyse accident data and concentrates on Parit Raja area only. Three sites were identified as the worst ranking weightage (1999-2001) at FT 50 and were blacklisted as blacksport site as shown in Table 1.1. The site that had been blacklisted were KM 20 (Pintas Puding), KM 21 (Taman Maju) and KM 22 (traffic light Parit Raja).
For this study, KM 20 (Pintas Puding) was selected as the study location. Meanwhile KM 19 (KUiTTHO and Fujitsu factory), KM 20 (Pintas Puding) and KM
(Taman Maju), KM 22 (traffic light Parit Raja) and KM 23 (Taman Manis). Figure 1.2 shows the FT 50 from Batu Pahat to Ayer Hitam.
Study Area
Sources:PDRM
Rank (1999-2001) Route No. Post State District Fatal ed Injury Only weightage Location
1 F0023 23 JOHOR Muar 8 24 0 0 48.6 KM 53 JLN SEGAMAT - KM 27, MUAR F0023)
2 F0023 24 JOHOR Muar 7 23 0 0 47.5 KM 52 JLN SEGAMAT- KM 28 MUAR F0023
3 F0050 5 JOHOR Batu Pahat 7 16 0 0 45.5 KM 154 JLN MERSING - KM 5 BATU PAHAT, F0050
4 F0003 41 JOHOR Kota Tinggi 8 24 0 0 43 KM 288 JLN KUANTAN – KM 41 JOHOR BAHARU, F0003
5 F0018 8 PERAK Manjung 2 28 0 0 42 KM 75 IPOH – KM 8 LUMUT, F0018
6 F0050 22 JOHOR Batu Pahat 5 16 0 0 40.1 KM 137 JLN MERSING - KM 22 BT PAHAT, F0050
7 F0024 57 JOHOR Muar 7 14 0 0 39.9 KM 169, J.BAHARU F0024
8 F0001 156 JOHOR Segamat 3 24 0 0 39.7 KM 160 SEREMBAN - KM 156 J. BAHARU, F0001
9 F005 185 JOHOR Muar 9 13 0 0 37.7 KM 41 MELAKA - KM 192 J.BAHARU, F0005
10 F0023 28 JOHOR Muar 0 20 0 0 35.2 KM 48 JLN SEGAMAT - KM 32 MUAR, F0023
11 F0005 128 JOHOR Batu Pahat 3 16 0 0 34.7 KM 98 MELAKA - KM 135 J.BAHARU, F0005
12 F0005 55 JOHOR Pontian 2 16 0 0 34.2 KM 171 MELAKA – KM 62 J.BAHARU, F0005
13 F0001 184 JOHOR Segamat 10 14 1 0 32.25 KM 132 SEREMBAN - KM 184 J. BAHARU, F0001
14 F0005 56 JOHOR Pontian 4 18 0 0 31.8 KM 170 MELAKA – KM 61 J. BAHARU, F0005
15 F0001 137 JOHOR Segamat 8 14 0 0 31.8 KM 179 SEREMBAN - KM 137 J.BAHARU, F0001
16 F0050 20 JOHOR Batu Pahat 10 9 0 0 31.8 KM 139 JLN MERSING - KM 20 B.PAHAT, F0050
17 F0050 23 JOHOR Batu Pahat 1 17 0 0 31.5 KM 136 JLN MERSING - KM 23 BT. PAHAT, F0050
18 F0001 185 JOHOR Segamat 5 17 0 0 29.5 KM 131 SEREMBAN - KM 185 J.BAHARU, F0001
19 F0001 183 JOHOR Segamat 5 14 1 0 28.35 KM 133 SEREMBAN - KM 183 J. BAHARU, F0001
20 F0005 184 JOHOR Muar 7 17 1 0 28.3 KM 191 J.BAHARU , F0005
The primary objectives of the study are:
(i) to identify the engineering factors that may contribute to the cause of accident,
(ii) to propose improvements at the location, and
(iii) to develop accident prediction model for Federal Route 50.
1.5 Scope of Study
The scope of the project will cover stretches from KM1- KM38 Batu Pahat – Ayer Hitam by looking into accident trend. The data of accident record was collected from year 2000, 2001, 2003 and 2004 from the Batu Pahat Police Traffic. An appropriate statistical analysis is required to identify the hazardous location which cause the accident, thus propose the improvement at the selected site to reduce the accident rate. The study will concentrate on the KM 20 (Pintas Puding) and the skid resistance test will carried out at KM 19, KM 20 and KM 21. Meanwhile the study area for development of the accident prediction model will include KM 19, KM 20, KM 21, KM 22 and KM 23.
1.6 Methodology
Methodology applied for this study are as followed;
(i) A Data Collection
The statistical accident data was collected from Balai Polis Trafik Batu Pahat, JKR Daerah Batu Pahat, Road Safety Research Center (UPM), Road Transport Department of Malaysia, Polis Diraja Malaysia.
(ii) Analysis of Accident Data
Accident data is to determine the nature of the accident problem at the study area. The analysis of the accident needs to look for the accident pattern. Accident data analysis provides more detail to rank the blacksport sites such as:
a) Ranking accident point weightage at FT 50, b) Ranking of the top ten accident section, c) Kilometers post analysis, and
d) Refining the ranking by statistical techniques.
(iii) Field Investigation
Field investigation involve site, route and area inspection. These include traffic count, origin destination surveys, vehicle classification survey, spot speed studies, observation studies and skid resistance. Preceding analysis work may have enable to identify possible causal factors of the accident as well as countermeasures option.
The site route or area inspection should include both a drive over and walk over inspection. The drive over allows to correlate accident behaviour
After the process of identifying common features and contributory factors, the next process is to develop and apply countermeasures. These countermeasures have to be assessed and a number of countermeasures may appear both feasible and effective.
(v) Accident Prediction Model
The model consists of several independent or explanatory variables, encompassing elements from road geometry to traffic condition, all the variable which considerable effect are 85th percentile speed, volume study and number of access points per kilometer. The data was collected on the field work.
CHAPTER II
LITERATURE REVIEW
2.1 Introduction
Malaysia has the second lowest road accident rate in ASEAN region, second only to Singapore. In a report published by the Malaysia is Ministry of Transport, Malaysia had 4.6 deaths for very 10,000 registered vehicles in the year 2001, and increasing to 4.9 deaths/10,000 vehicles in the year 2002 (4).
In industrialized, countries the multi disciplinary nature of the problem is now being accepted and a large number of organizations are involved in the effort to improve road safety. Each organizations takes the necessary actions within its respective area of responsibility. Police seeks to influence driver behaviour through enforcement of traffic regulations, engineers create safer roads and educationalists train and inform road users about potential dangers on the road and on the ways to avoid them. Such efforts in developed countries are normally coordinated so that they can have a maximum effect.
In developing countries, by contrast, road safety responsibility is often more confused and fragmented and very little coordination occurs. Where a single agency is supposed to be responsible for improving road safety, it may have little or no contact with the various other agencies which can influence the road safety situation and little or no powers of implementation in other fields. The problem can only be
Without enforcement many traffic schemes may become unworkable or unsafe but conversely, if those same traffic schemes are neatly designed to be as self enforcing as far as possible such as raised channelising islands at juctions to force drivers along particular paths. The enforcement demands may become too high and impossible to police. Education, information and training can also play a role by teaching drivers better and safer road behaviour and informing them about the meanings of road signs and markings. If drivers unaware of the meaning of road signs and markings, they are unlikely to obey them. If there is no guidance to drivers through road markings, signs or traffic islands it may be more difficult or even dangerous for them to carry out the required manoeuvres and the police may find it more difficult to enforce them. Encouragement also one of the important elements to improve road safety by setting target, safety campaign, advertisement, support for initiatives and publicity material to promote positive attitudes.
Consequently, there should be very strong inter-relationship between enforcement, environment, education and encouragement. Although deficiencies can sometimes be compensated for by additional strengthening, the general aim is that each contributing fully to the improvement of road safety. This will require appropriate institutional arrangements to be made.
A road accident is defined as an occurrence on the public or private road due the negligence or omission by any party concerned (on aspect of road users conduct , maintenance of vehicle and road condition) or due to environmental factor (excluding natural disaster) resulting in a collision (including “out of control” cases and collision or victims in a vehicle against object inside or outside the vehicle eg. bus passenger) which involved at least a moving vehicle whereby damage or injury is caused to any person, property, vehicle, structure or animal and is recorded by the police.
A comprehensive study of road safety Treat et al (5) found that human error was the sole cause in 57% of all accidents and was a contributing factor in over 90%. In contrast, only 2.4% were due solely to vehicle and only 4.7 % were caused only by road and environmental factor.
Human factor is without doubt the most complex and difficult to isolate as it is almost all very temporary in nature. Consider sensory capabilities, knowledge, attitude, alertness, health, driving skill, age, customs, habits, weight, strength and freedom of movement. Of these, the emotional factors are the greatest variable attributes and the most difficult to identify.
The road and environmental factor include, but are not limited to lighting, view obstructions, signs, signals, road surface character, dimensions and protective devices. All factors are subject to modification by outside influence such as the road surface that become slick from rainfall. Modifying each of the listed road factors are weather, lighting, roadside devices, surface deposits, damage deterioration and age.
For vehicles, factor include equipment condition, view obstructions, distractions, instruments, signaling devices, control sensation, comfort, automatic controls and devices, weight, performance, dimensions and stability. Vehicle speed, as a factor, must exist. If neither vehicle had any speed, there could not have been collision.
In order to tackle safety problems effectively via engineering and traffic management, it is necessary to apply measures at various stages in the development of road networks. The strategical approach in improving road safety are accident prevention and accident reduction.
2.3.1 Accident Prevention
Road safety strategies and countermeasures have been used in many
developed countries at different stage of network development. Accident prevention, the focus of which is on designing safer roads and improve traffic management for all road user groups. This method of seeking to prevent road accident involves the application of safety principle in the planning, geometric design, traffic management, upgrading and maintenance of roads.
2.3.2 Accident Reduction
There are at least four basic strategies for accident reduction through the use of engineering countermeasures. Accident reduction, is aimed at identification and elimination of blackspots. The four basic strategies for accident reduction through the use of countermeasures are:
Single site/ Blacksports Mass action schemes
2.3.2.1 Single Site
The single site techniques approach to accident reduction through engineering is based on identification of sites with higher than average number of accidents. A location can be considered to be hazardous when sufficient accidents ( example 9 or more injury accident within 50m of a junction ) to identify a pattern occur , within which common factors that are likely to be susceptible to treatment, usually at relatively low cost can be recognized. These approaches provide a technique for reducing accidents at high risk sites. However, because these sites are selected where accidents have clustered in the past, there is a tendency for the observed reductions in accident numbers to overestimate the effect of measures taken.
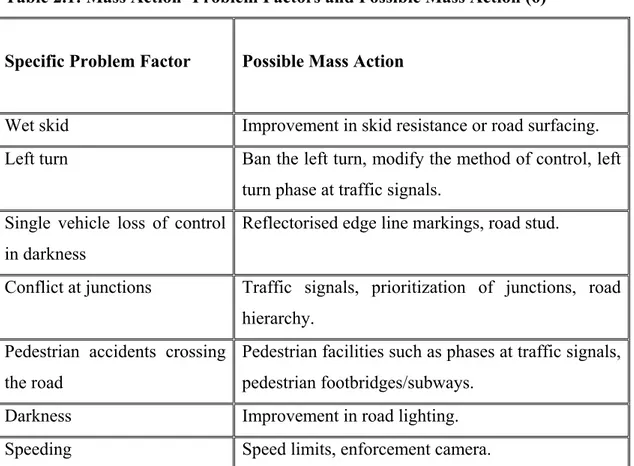
2.3.2.2 Mass Action Schemes
Mass action schemes involve the application of a remedy to locations or areas with a common accident problem. Some examples of these problems are locations or areas with the worst record of skidding on wet surfaces, head on collisions, excessive speed approaching roundabout, pedestrian accidents and motorcycle accidents. To overcome the wet skidding-related accident, the road surface texture is required at the particular area. Typical problem and remedial measures suitable for mass action techniques are listed in Table 2.1
The advantage of this technique is that it makes very efficient use of limited manpower resources to study accidents. Known effective accident reduction
Table 2.1: Mass Action- Problem Factors and Possible Mass Action (6)
Specific Problem Factor Possible Mass Action
Wet skid Improvement in skid resistance or road surfacing. Left turn Ban the left turn, modify the method of control, left
turn phase at traffic signals. Single vehicle loss of control
in darkness
Reflectorised edge line markings, road stud.
Conflict at junctions Traffic signals, prioritization of junctions, road hierarchy.
Pedestrian accidents crossing the road
Pedestrian facilities such as phases at traffic signals, pedestrian footbridges/subways.
Darkness Improvement in road lighting. Speeding Speed limits, enforcement camera.
2.3.2.3 Route Action Plans
Route action plan involves the application of remedies along a route with a high accident rate. Procedures for route action are analogous to those for single sites. The distribution of accidents on all routes of a particular type or class within a specific period of time is determined in order to identify those sections of a road
highway unit of between 0.5 to 1 km length and reaction level of accident at and above which the route sections are selected for listing can be determined from the value of one or two standard deviation above the normal. Alternatively, a statistical test for a pre-determined level of significance above the normal can be used to determine this level.
2.3.2.4 Area-Wide Measures
Area investigations are similar to route investigations but usually they cover an area with distinct characteristics. Using computer analysis, it is possible to identify a specific area having a particularly high accident density. These areas may also require action on environmental ground in addition to accident grounds and the accident situation may form the basis for discussion on the comprehensive improvement of the environment of the area or a comprehensive traffic management scheme.
Using this type of investigation, it may sometimes be possible to influence otherwise intractable traffic problems. However, it may also have the difficulties of obtaining agreement from various parties since the remedial measures recommended usually involve area-wide traffic management and have the disadvantage of taking a relatively long time to agree and implement. Area investigations are usually only appropriate for urban area problems.
Because of the difficulties of investigation, agreement and implementation of these area schemes, an area investigation may be more appropriate in providing background input as part of an area-wide traffic management study, as an aid in formulating proposals.
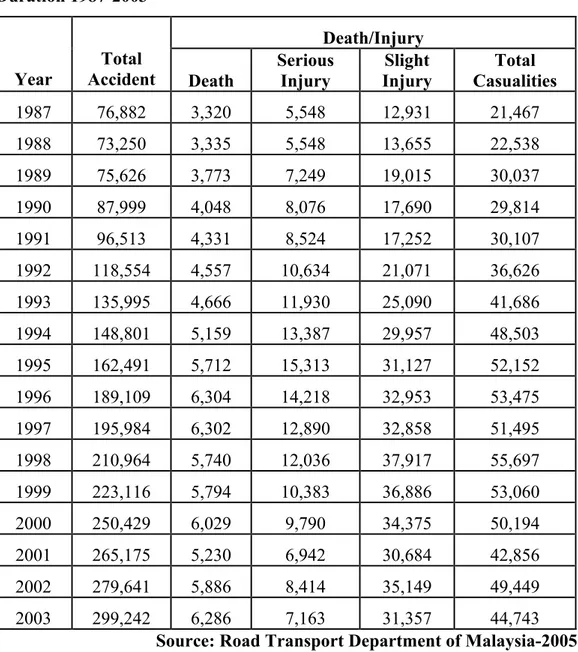
Road accident is one of the major causes of death and injuries in Malaysia. In the year 2001, the total number of road accident was 265,175, an increase of 5.89% from the previous year. In the year 2002, the total number of accidents was 279,641 an increase of 5.46% compared to 2001. In 2003, the total number of accident was 299,305, an increase of 7.01% comparing to the year of 2002. Table 2.2 and Figure 2.1 show the accident statistics in Malaysia. Table 2.3 shows the number of motor vehicle in Malaysia.
Table 2.2: Distribution of Fatalities and Other Injuries Based on Statistics for Duration 1987-2003
Death/Injury
Year Accident Total Death
Serious Injury Slight Injury Total Casualities 1987 76,882 3,320 5,548 12,931 21,467 1988 73,250 3,335 5,548 13,655 22,538 1989 75,626 3,773 7,249 19,015 30,037 1990 87,999 4,048 8,076 17,690 29,814 1991 96,513 4,331 8,524 17,252 30,107 1992 118,554 4,557 10,634 21,071 36,626 1993 135,995 4,666 11,930 25,090 41,686 1994 148,801 5,159 13,387 29,957 48,503 1995 162,491 5,712 15,313 31,127 52,152 1996 189,109 6,304 14,218 32,953 53,475 1997 195,984 6,302 12,890 32,858 51,495 1998 210,964 5,740 12,036 37,917 55,697 1999 223,116 5,794 10,383 36,886 53,060 2000 250,429 6,029 9,790 34,375 50,194 2001 265,175 5,230 6,942 30,684 42,856 2002 279,641 5,886 8,414 35,149 49,449 2003 299,242 6,286 7,163 31,357 44,743
TYPES OF VEHICLES
Private Public Service
Year Motorcycle Motorcar Bus Taxi Hire&Drive Goods Others Total
1987 1,929,978 1,356,678 19,439 24,868 3,741 233,103 106,677 3,674,484 1988 2,030,418 1,427,283 20,452 26,161 3,937 245,232 112,226 3,865,709 1989 2,182,468 1,534,166 21,984 28,120 4,232 263,597 120,629 4,155,196 1990 2,388,477 1,678,980 24,057 30,774 4,631 288,479 132,016 4,547,414 1991 2,595,749 1,824,679 26,147 33,444 5,033 313,514 143,472 4,942,038 1992 2,762,666 1,942,016 27,827 35,596 5,357 333,674 152,698 5,259,834 1993 2,970,769 2,088,300 29,924 38,278 5,762 358,808 164,199 5,656,040 1994 3,297,474 2,302,547 33,529 42,204 5,308 393,833 178,439 6,253,334 1995 3,608,475 2,553,574 36,000 46,807 8,195 440,723 203,660 6,897,434 1996 3,951,931 2,886,536 38,965 49,485 9,971 512,165 237,631 7,686,684 1997 4,328,997 3,271,304 43,444 51,293 10,826 574,622 269,983 8,550,469 1998 4,692,183 3,452,852 45,643 54,590 10,042 599,149 286,898 9,141,357 1999 5,082,473 3,787,047 47,674 55,626 10,020 642,976 304,135 9,929,951 2000 5,356,604 4,145,982 48,662 56,152 10,433 665,284 315,687 10,598,804 2001 5,609,351 4,557,992 49,771 56,579 9,986 689,668 329,198 11,302,545 2002 5,842,617 5,001,273 51,158 58,066 10,073 713,148 345,604 12,021,939
0 50000 100000 150000 200000 250000 300000 350000 1993 1994 1995 1996 1997 1998 1999 2000 2001 2002 2003 NUM BE R O F R O A D CR AS H Source: PDRM & JPJ
Figure 2.1: Accident Statistics (1993-2003)
As can be seen from Figure 2.2, is the trend of fatalitity in Malaysia since 1987. The number of fatal figures has increased from 5,230 in the year 2001, to 5,886 (2002) and to 6286 (2003). In the year 2004, the fatal trend reversed and coming down to 6,223. 0 1000 2000 3000 4000 5000 6000 7000 1987 1988 1989 1990 1991 1992 1993 1994 1995 1996 1997 1998 1999 2000 2001 2002 2003 2004 N U MB E R OF F A T A L S Source: PDRM & JPJ Figure 2.2: Fatalities Trend in Malaysia
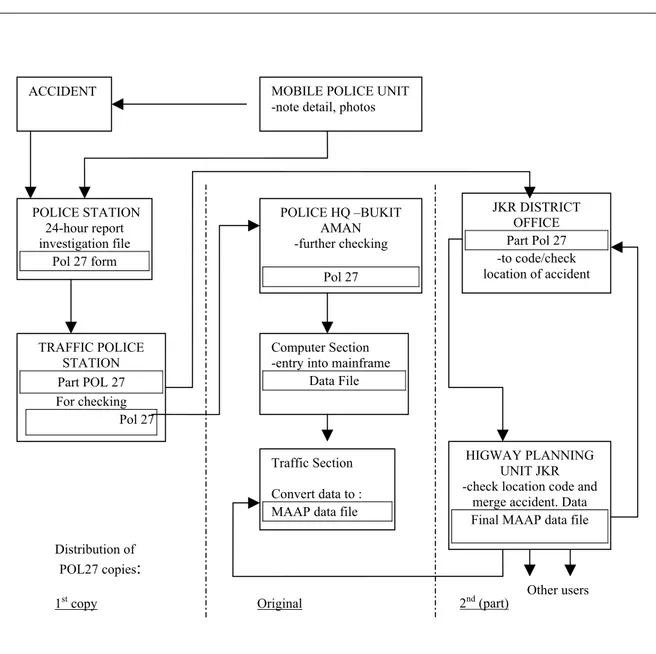
The framework for Malaysia accident data collection is summarized in Figure 2.3. The first step in the production of the national database is the compilation of all accident forms POL27 (Pin.1/91) in the respective police districts. A typical copy of the completed form as compiled by the Royal Malaysian Police is shown in Appendix A .
The details of each accident are filled up by the police, the original copy of forms (printed on a white paper) are dispatched to the State Police Contingent which are subsequently dispatched monthly to the Traffic Branch Police Headquarters, Bukit Aman. At this Branch, all forms are checked and delivered, batch by batch, to the Computer Branch, Bukit Aman. The data are than keyed-in into the data entry terminals and doubled-checked by police personnel. Any miscoding of accident data is returned to the Traffic Branch for further investigation. The forms a stocked temporarily in a special store room at Bukit Aman before dispatching them to the Road Safety Research (RSRC) Universiti Putra Malaysia. At this centre, the forms were carefully classified, catalogued and bound for easy access for safety research.
The first copy of the forms (printed in green) may also be obtained from the respective Police districts. They are stored at the Traffic Section of each district. Each district could have access to the form if the need arise, though they are not catalogued or compiled as was done at UPM. The Police district will key in the accident data, based on the POL27 into the computer and any information about the accident data can be accessed.
The second copy of the form which contains only the first and last pages of POL27 (Amendment 1/91) is taken to the Public Works Department (PWD) at the respective PWD districts. The district engineers or his assistants are required to check the location data and forward the forms to the Highway Planning Unit (HPU), Ministry of Works Malaysia. This is followed by further checking, coding and key-in
location of accident MOBILE POLICE UNIT
-note detail, photos ACCIDENT JKR DISTRICT OFFICE Part Pol 27 -to code/check HIGWAY PLANNING UNIT JKR -check location code and
merge accident. Data Final MAAP data file POLICE STATION 24-hour report investigation file Pol 27 form POLICE HQ –BUKIT AMAN -further checking Pol 27 TRAFFIC POLICE STATION Part POL 27 For checking Pol 27 Computer Section -entry into mainframe
Data File
Traffic Section Convert data to : MAAP data file Distribution of
POL27 copies:
Other users 2nd (part)
1st copy Original
2.6 Identifying Accident Blackspots
Highway engineers and traffic police generally know the tendency for road accidents to cluster together at certain locations, commonly termed as ‘accident blackspot’. Without precise location data, accident cannot be plotted. It is advised, however, to identify blackspot using accident data.
Normally the number of accidents at a particular site will vary widely from year to year, even if there are no changes in traffic or in the road layout. In statistical terms, road accidents at individual sites are rare , random, multifactor events. This means that comparison between the number of accident at particular sites must be made with respect to a fixed time period, typically one year. Furthermore, a single year data will be subjected to considerable statistical variation. Ideally, several years data are required, from which a mean, annual accident rate can be calculated. Three years is generally regarded as a practical minimum period for which a reasonably reliable annual average rate can be calculated.
Accident may occur along a section of road without any obvious single feature. Here, it is necessary to think in terms of accident per kilometer, that is, the accident density along a particular link. Given these data, it is possible to rank sites in terms of their accident history.
The severity of accidents should also be taken into account, as accident with fatal and serious injuries are more costly in both social and economic terms. It sufficient research has been carried out to identify the cost of accident of different types and different severity, then they can be weighted relative to their cost.
Where possible, the effects of traffic volume should also be considered. In simple terms, more traffic would be expected to lead to more accidents. If traffic flow data is available, it can be helpful to compare sites in terms of accident per unit traffic. Accident rate often expressed as accident per million vehicle entering an
2.7 Accident Analysis
Having identified a blackspot or problem locations along route, the next step is to establish the nature of the problems leading to the poor safety record. Accident analysis is primarily concerned with identifying common features and contributory factors, especially objective report feature such as vehicle manoeuvres, day/night or surface condition.
As with identifying blacksports, identifying contributory factors and common features is largely dependent upon the availability of adequate data. The primary source of this is the police accident report, either directly or in some summary form. In some case, this may exist on a computerized database but in many countries report are likely to be stored in paper filing system. Important information can also be gained from plans and site visits.
It is convenience to think of the analysis in two stages. First, a preliminary analysis is carried out to identify common features among accident and the predominant types of accident. This followed by a detailed analysis, where the factor contributing to the predominant types are identified, allowing remedial measures to be designed to eliminate or counteract.
The preliminary analysis should be quantitative. It would include the preparation of summary table which would disaggregate the total number of accidents by such items such as collision type, severity, vehicle type, time of day, day of week, weather conditions, and pedestrian involvement. Collision diagram, which summarises the types of manoeuvre involved, would also be prepared. From
Detailed analysis will be dependent on the amount of information available. If the original police report forms are available, these should be studied. Sketches and statements may contain vital clues. A site visit is essential at the times when accident most frequently occur. The site must be examined from the viewpoint of drivers, pedestrians and those road users most frequently involved in accidents. At a busy site, an hour, or two observation or, preferably, a more formalized traffic conflict study can often reveal much about the way in which drivers approach or pass through a site. Broken glass, skid-marks or wheel-track on the road surface can also help to identify problems especially at intersections and bends. This is detective work, collecting information from many sources and using it to build up a picture or event and the factors contributing to accidents in order to identify possible remedial measures. By concentrating on the dominant accident types the most cost-effective countermeasures are likely to be found.
2.8 Development of Countermeasures
After the process of identifying common features and contributory factors, the next step is the development and application of countermeasures, or remedial works. Often there will be a choice of countermeasure and that choice must be based on an analysis of the common features and the identification of contributory factors. Countermeasures are problem oriented and choice of measures for a particular set of contributory factors must be aimed at resolving problems.
the approaches to intersections. It can be minimized by the prevention of a good skid resistance road surface, particularly on approaches to intersections and pedestrian crossings.
The surface texture of a road is described at two level, the micro-texture refers to detailed surface characteristics of the aggregate and mortar and macro-texture is a large-scale surface profile visible to the naked eye. At a low speed or near intersections on the minor road, or on circulatory carriageways of roundabouts, a harsh micro-texture is required. At higher speeds, on slip-road exits from high speed dual carriageways, the macro-texture needed to be relatively rough.
The two criteria of most important in surface materials are their resistance to polishing and their abrasion. Skidding resistance of road surface can be measured with special equipment. This can range from a lorry devise (SCRIM) which can be operated at up to 80km/h with minimal disruption to traffic. The portable hand-held pendulum device shown in Figure 2.4 which can be used to check skidding resistance at accident blackspot.
If the resistance to polishing is inadequate, the surface will become polish smooth by the action of tyres and if they abrade (wear) badly, the aggregate will quickly be lost by the road surface. In both instances, road surface will have a reduced skidding resistance and vehicle will skid especially if there is any water or rain fall and when the vehicle is traveling fast.
Even when abrasion and resistance to polishing criteria have been considered in the design procedures, these are often not to give the importance since they deserve in maintenance activities.
carries. The conventional wisdom among the general population is that accident rates should increase with the increasing of traffic volumes, as there are more interaction between vehicle.
A number of researcher have investigated this complex interaction in the past. One of the first such studies was by Gwynn (8) who analyzed accident and traffic flow on U.S Route 22 through the city of Newark, New Jersey. Crash rates were plotted against hourly volume class, and the author found a distinct U-shape relationship, with more accidents observed at higher and lower traffic volumes. Berhanu (9) roads with higher ADT and pedestrian traffic are associated with higher accident frequencies for all highway types. Al-Masaeid, Hashem R, Suleiman, Ghassan (10) level of travel and population has a strong influence on urban accident. Reduction of the need for travel and locating major streets on the edge of an urban zone as well as limiting population density could enhance traffic safety.
2.11 Relating Accident to Vehicle Speed
Generally, speed is said to be one of the contributory factors to road accidents. Higher speeds reduce the amount of time any driver has to respond
to the unexpected and increases the force of any impact. The importance of lower speeds can be reflected in the following text published by the Association of British Drivers:
“Virtually the only factor that road accidents have in common is that all would have been avoided if those involved had known with certainty, a few seconds in advance, that an accident was about to occur.”
effect of drivers’ speed on the frequency of road accidents” published in March 2000, mentions that the faster the traffic moves on average, the more crashes there are. The report also conclude crash frequency increases approximately with the square of average traffic speed and that higher speed drivers are associated with a significantly greater crash involvement than are slower speed drivers.
TRL 421 also noted that for every 1 mph reduction in average speed, crashes are reduced by between 2-7 %. More specifically, the crash reduction figure for urban road with low average speeds is 6%, for medium speed urban road and lower rural main roads is 4%, and for higher speed urban roads and rural main roads is 3%.
In the report of CN Kloeden, AJ McLean, VM Moore and G Ponte of the NHMRC Road Accident Research Unit, University of Adelaide (12), who carried out a study on “Traveling Speed and The Risk of Crash Involvement”, the authors conclude that in a 60 kmph speed limit area, the risk of involvement in a casualty crash doubles with each 5 kmph increase in traveling speed above 60 kmph.
The authors also revealed amazing statistics on the effect of reduced traveling speed and compliance with speed limit as shown in Table 2.4.
Table 2.4: Effect of Reduced Speed and Compliance With Speed Limit on Accident Rates CN Kloeden, AJ McLean, VM Moore and G Ponte(12)
Hypothetical Outcome % Reduction in number of crashes % reduction in number persons injured 5 kmph speed reduction 41.5 34.6 10 kmph speed reduction 15.0 13.1 Total compliance with 60
reducing the accident likelihood is equivalent to reducing the speed variation of vehicle. An implication of the system is that reducing the speed variation is advantageous because it increase safety and reduces the accident likelihood.
2.12 Relating Accident to Number of Access Points
Driveways, median opening and intersections are few of access points commonly found along urban roads. Driveaways, either for commercial or private purposes, are roadside openings which lead into business centers, shopping complexes, car parks and hotels. Median openings serve to facilitate vehicles doing right-turning and U-turning. Intersections, signalized or unsignalized, may exist in the form of t-junction, crossroads and roundabouts, all of which serves the purpose of connecting to other roads of the either the same or different hierarchy.
The presence of access points, especially in large numbers, hinders traffic flow, as vehicle require adequate time and space to perform their maneuvers at these point. In addition to this, access points bring about an increase in traffic conflicts such as merging, diverging, weaving and cross conflicts, which increase the risk of accident.
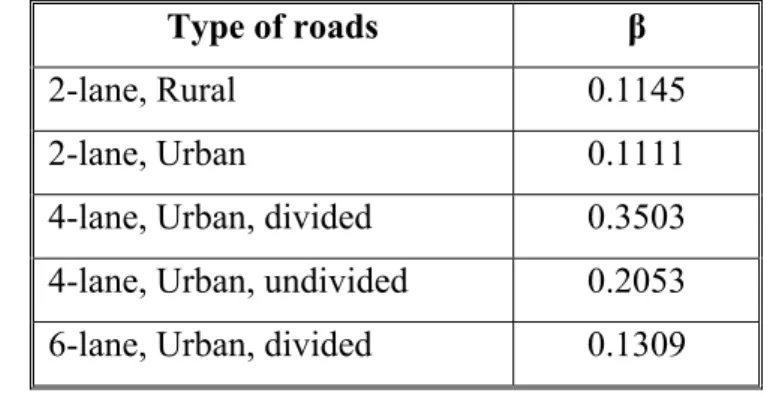
Berhanu(9) the increase of accident rates with the density of accesses to urban divided highways. Hadayeghi, Shalaby and Persaud (14) it was found the number of accident per zone in a year increase as the zonal vehicle kilometer travel (VKT), major and minor road kilometers, total employed labour force, household population and intersection density increase, and decreases higher posted speed and higher congestion in the zone Hadi et al (15) used Florida crash data to estimate negative binomial model for different classes of roads. The functions exp (β x number of intersections) was chosen to represent the influence of number of
Table 2.5: Regression Coefficient β for the Different Road Classes Hadi et al (15)
Type of roads β
2-lane, Rural 0.1145 2-lane, Urban 0.1111 4-lane, Urban, divided 0.3503 4-lane, Urban, undivided 0.2053 6-lane, Urban, divided 0.1309
This shows that the larger the number of intersections, the accident frequency is multiplied by the larger factor it carries (e.g if β 0.2053, one intersection multiplied accidents by 1.23, two intersections by 1.51, three intersections by 1.85, etc)
CHAPTER III
METHODOLOGY
3.1 Introduction
The methodology applied to achieve the objective of the study are shown in the flow chart Figure 3.1. The four main steps in the methodology are accident data collection, analysis of accident data and identification of blackspot location, field investigation, blackspot treatment and the development of an accident prediction model.
Model Model (Step-5) Accident Prediction Countermeasures (Step-4) Diagnosis (Step-3) Identification and Prirotisation (Step-2) Data (Step-1) Blackspot Treatment Collision diagram Field Investigation
- Drive over inspection - Traffic studies - Skid resistance test
Accident Data Collection
Analysis of accident data and identification of blackspot location
- Accident trend and statistics - Ranking accident point weightage - Ranking of the top ten accident section - Kilometre post analysis
- Refining the ranking by statistical technique
3.2 Accident Data
Accident data were collected from Balai Polis Trafik Batu Pahat, JKR Daerah Batu Pahat, Polis Diraja Malaysia (PDRM) Bukit Aman, Jabatan Pengangkutan Jalan (JPJ), Klinik Kesihatan Parit Raja, Kolej Universiti Tun Hussien Onn ( KUiTTHO) and Road Safety Research Center UPM Serdang. The accident database was obtained from the POL27and the crash record was collected from the year 2000 to 2004 and the accident data collection is available from Appendix D. For each accident, the following accident data field should be included as a minimum:
Date of accident Location of accident
Type of location and alignment Feature of location
Day of week Time of accident Light conditions
Road surface and weather conditions. Travel direction
Vehicle types involved Casualty Data
3.3 Analysis of Accident Data
The purpose of preliminary analysis of the traffic accident data is to
determine the broad nature of the accident problem. At this stage the general patterns and trend of accident are established. Types of accident trend and statistics for the FT 50 were:
Accident and casualty years 2000-2004 Accident by hours of the day year 2004
Total number of accident by light condition year 2004 Accident by month year 2004
Meanwhile type of accident trends and statistics at Pintas Puding (KM 20) were number of driver involved in accident by types of fault and types of
vehicle involved in accident.
3.4 Identify Blackspot Location
Identification and prioritisation of accident blackspot location were carried out by using the following methods:
(i) Ranking accident point weightage (ii) Ranking of the top ten sections accident (iii) Kilometer post analysis
An accident point system based on weightage adopted by the Highway Planning Unit (HPU), Ministry of Works, Malaysia can be used to compute the site priorities. In this system, an accident involving a fatality is given 6.0 point, while 3.0, 0.8 and 0.2 point are assigned to, hospitalized, minor and damage only accident respectively. This is illustrated in Table 4.3 (Chapter IV).
3.4.2 Ranking of the Top Ten Accident Section
The ranking of the top ten section accident based on absolute frequency is shown in Table 4.4 (Chapter IV).
3.4.3 Kilometer Post Analysis
Histogram of accident within selected stretches with high accident concentration is produced by dividing the stretch into 1KM length shown in Table 4.5 (Chapter IV). The accident severity include fatal, serious injury, slight injury and damage.
3.4.4 Refining the Ranking by Statistical Technique
Refining the ranking by statistical technique to ensure that the selected blackspot section were worthy for further investigation. The accident analysis of the statistical technique, illustrate in section 4.3.4 (Chapter IV).
3.5 Collision Diagram
A collision diagram is a sketch or plan of the site under investigation,
including as many as relevant features which are available, such as intersection priorities, traffic lanes, markers and adjacent land use etc. Aerial photos are useful if available. The diagram should always have streets labeled and an arrow indicating true north. Other relevant details such as the position of road furniture can be added to sketch during the field investigations. The collision diagram sketch at Pintas Puding KM20 shown in Figure 4.5 (Chapter IV).
The purpose of the Collision Diagram is to enable the study to identify clusters of similar accident. This can enable the development of countermeasure treatments that can be applied at specific location within the study area to address the specific problems.
Field investigations associated with project involve site, route and area
inspections by the team. However, these can also include any additional on site information that is warranted following the analysis stages. This may include traffic counts, origin-destination surveys, vehicle classification surveys, observational studies, and skid resistance.
The preceding analysis work may have enabled the team to identify possible causal factor of the accident as well as countermeasure option that may be effective in addressing the problems. At the very last, the completion of the analysis work should have identified some issues that need to be further assessed through Field Investigations. In either case, the team can more effectively carry out Field Investigation by summarizing the analysis findings in a route or area. As such the site inspection will have the following functions:
To confirm accident causal factors as suspected from the analysis.
To determine whether concept countermeasures will be effective and practical
To correlate analysis findings and additional information with the site, route or area to gain a better appreciation of the problems.
To identify any accident causal factor that were not apparent through the analysis of the data.
To develop any additional countermeasures that were not foreseeable at the data analysis stage.
To observe traffic and road user behaviour To document site finding and take photographs.
At any site, route or area inspections should include both a drive-over and walk-over inspection.
3.6.1 Drive-Over Inspection
The drive-over allow to correlate accident data to road characteristics, traffic behaviour and driver perception. It encompasses the total road environment including topography, landscape, road and traffic facilities, it provides and opportunity to relate driver expectation with the facilities provided including checking that message to drivers are clear and concise.
For practical reason a car is normally used for the drive-over inspection. However it should be recognized that vehicle characteristics are often an important factor in accident, such as the driver eye-height variations with different vehicle.
In a drive-over, the investigation should use all approaches to the site, route or area and repeat manoeuvres (within reason and in accordance with traffic rules and OSH guideline) featured in the accident data.
On a route study there is a heavy emphasis on road continuity and driver expectation. The route is treated as one continuous site. However locations with some degree of accident clustering should be examined in more detail and reported separately, with any measures recommended being consistent with the rest of the route.
3.6.2 Walk-Over Inspection
The walk-over inspection is a more detailed examination of the location and driver behaviour. Where it is practical and safe, the walk-over should be carried out during condition that were prevalent for most of the accidents to more accurately
walk-over inspection of a 5 km long route. As a minimum, a walk-over would be required on a route or area at all cluster locations as well as location where the Mass Action Treatment would be applied (even those without accident clusters).
The walk-over is the convenient time to:
Confirm accident causal factors as suspected from the analysis
Determine whether concept countermeasures will be effective and practical Correlate analysis findings and additional information with the site, route or area to gain a better appreciate of the problems.
Identify any accident causal factors that were not apparent through the analysis of the data.
Develop any additional countermeasures that were not foreseeable at the data analysis stage.
Document finding and take photograph
In case, where there was a large incidence of pedestrian accidents, the walk- over also allows to view the site, route or area as a pedestrian.
3.6.3 Traffic Count
Traffic studies at Pintas Puding were conducted manually using field sheet count form shown in Appendix B. The traffic survey took 6 hour started from 7.30a.m and completed at 7.00p.m. Four observers required and the 15 minute time interval were taken in this traffic counting. The raw count were tallied summarized into a computer upon return to office.
Count are usually samples of actual volumes, although continuous counting is sometimes performed for certain situation or circumstance. Sampling periods may range from a few minutes to a month or more. The length of the sampling periods is a function of the type of counting being taken and the use to which the volume data will be put.
Many types of counts require classifications that are obtained more easily and accurately with trained observers. Examples include vehicle occupancy, pedestrians, turning movements, and vehicle classification.
Other reason for conducting manual count are time and resources. Practical application often requires less than 10 hours of data at any given location. Thus the effort and expense to set up and remove automated equipment is not justified.
3.6.4 Skid Resistance Test
Five persons were involved in conducting the skid resistance test. The equipment required in this experiment were portable hand-held Pendulum Device, five safety vests, six traffic cones, temperature meter, a bottle of water and a flashlite. Three person were in charged in the test while the other two persons were being in charge as a flagman to control the traffic flow.
Objectives skid resistance test to measure texture depth and skid resistance of a road surface using BS Pendulum Skid Tester as in Figure 3.2, i.e. loss of adhesion between a vehicle’s tyres and the road surface, occurs in many road accident whether or not it is the actual cause of the accident. Over the years, tyre manufacturer have done a lot of research into different types of rubber and tread pattern to improve the safety of the motor vehicles. The importunes for this research came from the
1. Select the spot/ sample under study
2. Set apparatus on the road so that the slider will swing in the direction of traffic flow and level the base screws.
3. Raise the swinging arm clear of the road and clamp in the horizontal position, release the arm and check that the pointer read zero.
4. With the pendulum arm free and hanging vertically, place the spacer, attached to a chain on the base of the tester so that the slider just touches the road surface and clamp in position. Remove the spacer.
5. Check the sliding length of the rubber slider over the road surface by gently lowering the pendulum arm until the slider just touches the surface first on one side of the vertical, use the lifting handle so that the slider does not touch the road. The sliding length should be between 125 and 127 mm. If not adjust by raising or lowering the head.
6. Place the pendulum arm in the horizontal and clamp in position. 7. Wet the road surface and slider with water.
8. Bring the pointer to its stop then release the pendulum by pressing the button. Take care to catch the arm on it return swing before it hits the ground.
9. Return the arm and pointer to the release position keeping the slider off the road surface by means of the lifting handle. Repeat the test, wetting the surface between swings. Record the mean of five successive readings. Provided they do not differ by more than three units. If the range is greater than this, repeat swings until three successive readings are constant; record this value.
This is the value obtained from the actual road surface, measured using the Portable Skid Resistance Tester. The resistance to skidding of a road surface, is dependent on the Polished Stone Value (PSV) of the aggregate in the wearing course material and the large texture, (roughness), of the surface of the wearing course material. The skid resistance value (SRV) is the mean of five readings or the constant three readings as stated above. As the stiffness of the rubber slider will vary with temperature a correction has to be made if the temperature is not 20oC. Use the temperature curve Figure 3.3 for this purpose.
Figure 3.3: Skid Resistance/Temperature Correction Relationship (TRRL, 1969)
The study section used for collecting data was about 5 kilometer long, it involve KM 19, KM 20, KM 21, KM 22 and KM 23 of Federal Route 50. The independent variable collected for the accident prediction model was traffic volume, spot speed and number of major access point.
Traffic accident record for the period of the years 2002 to 2004 were obtained from the Balai Polis Trafik Batu Pahat. Accident records of the traffic police obtained included fatal, serious injury, minor injury and damage only accidents. A total number of 3937 traffic accidents were reported of which 3% were fatal and 27% were injury accidents.
By traversing the entire length of the road to observe the number of access point and obtaining the number of major access point per kilometer for every section. Traffic volume and spot speed were obtain by having 2-h time periods of field survey at each section, namely the morning (0800-1000 h), midday (1100-1300 h) and evening (1700-1900 h). Spot speed measurement were taken at every section using speed radar. The 85thpercentile speeds was determined for spot speed measurement using SPSS program.
3.8 Data Analysis
This project applies the ‘Multiple Linear Regression’ technique in order to develop a model which relates accident frequency to the road geometry and traffic conditions.