Hastia Permata Sari , 2014
THE USE OF PICTURES IN TEACHING VOCABULARY TO STUD ENTS WITH MILD INTELLECTUAL D ISABILITY
Universitas Pendidikan Indonesia | repository.upi.edu | perpustakaan.upi.edu CHAPTER III
RESEARCH METHODOLOGY
This chapter includes further elaboration of how the research carried out, which consist of five sections. It covers the research problems, then follow by research design, and It also describes the research site and participants, techniques of collecting data, and data analysis.
3.1 Purpose of The Study
The purpose of this study was to identify and describe the effectiveness of the use of pictures in increasing the rate of acquisition of vocabulary by students with mild intellectual disability. Research suggests that the more words the learners know, the more they are able to comprehend what they see, hear or read. Integrating pictures into vocabulary less purpose, one may not only offer them visual experience, but also may be a powerful tool in helping them to learn and remember new words. Based on the above the present study endeavoured to address the question:
1. Does the use of pictures increase the rate of acquisition of vocabulary by students with mild intellectual disability ?
2. What are the students’ responses towards the implementation of the use of pictures?
3.2 Research Design
the manipulation of variables in order to determine their causal significance (Cohen, Manion and Morrison,2007).
Furthermore, experimental research is defined as a research in which the researcher manipulates the independent variable and interested in showing cause and effect (Johnson and Christensen, 2008). There are many types of experimental research design. Here, the writer used a Single Subject Researh (SSR). Tawny and Gast (1984) state that SSR is an integral part of the behavior-analytic tradition. The term refers to a research strategy developed to document changes in the behavior of the individual subject.
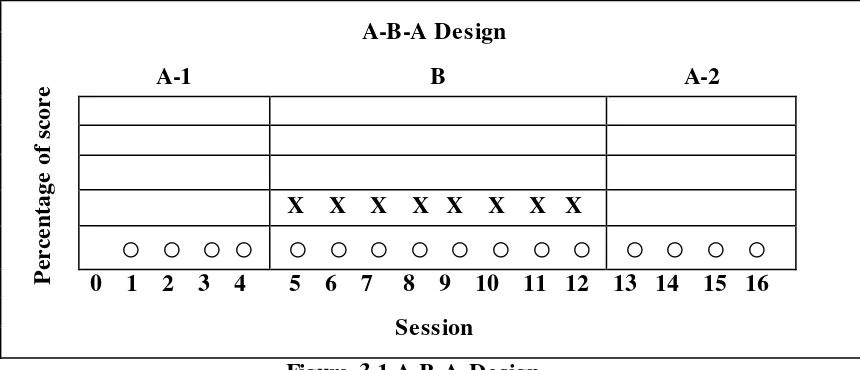
Through this research design, the researcher intended to determine the influence of the treatment (intervention) given to individuals repeatedly in a certain time. The model of research design was A-B-A, which had three phases; using two control conditions (Baseline) before and after the intervention. Controlling the intervention condition twice further enhanced confidence in a causal relationship between the intervention and behavior change. In this design there were three stages which consist of; Baseline-1 (A-1), intervention (B),
Baseline-2 (A-2), with the following pattern:
A-B-A Design
P
er
ce
n
tage
of
s
cor
e A-1 B A-2
X X X X X X X X
○
○
○
○
○
○
○
○
○
○
○
○
○
○
○
○
0 1 2 3 4 5 6 7 8 9 10 11 12 13 14 15 16Session
Figure 3.1 A-B-A Design
naturally and continuously, until it gets a stable condition which becomes the basis for the next calculating. The stable condition is characterized by the number of observation points, located between the ranges above and below the range of the percentage of 85% -90%. The research subject in this session was treated naturally and continuously, until they reached a stable condition that became the basis for calculating the next.
Baseline-2(B) is an intervention activity undertaken after finding a stable and consistent numerical value at Baseline-1 (A-1). Intervention was conducted through teaching learning sessions where the subjects are treated through the use of pictures repeatedly, in order to see the appearance of the target behavior that occurs during treatment given.
Baseline-2 (A-2) is the condition of the subject after intervention. The research subjects were treated naturally and repeatedly. It means that the subjects were not given the intervention with the use of pictures. This session was intended as a control for allowing intervention sessions to deduce the existence of a functional relationship between the independent variables and the dependent variable.
3.3 Research Site
3.4 Participants of the Research
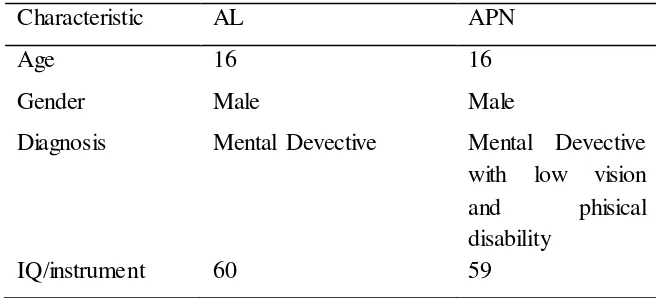
The participants of this study were two students with mild intellectual disability, AL and APN. The English teacher and the headmaster recommended the two students for participation in the study based on the characteristic of the researcher wanted, which was students with mild intellectual disability. The second grade students were chosen in this study with the assumption that they had already learned more English compared to the first grade students. In this study the third grade was not involved due to their final examination preparation. In sum, there were two second grade students and the researcher involved as the participants of the study. To preserve the confidentiality of the subjet, the name has been disguised under a pseudonym.
Table 3.1. The Student characteristics
Characteristic AL APN
Age 16 16
Gender Male Male
Diagnosis Mental Devective Mental Devective with low vision and phisical disability
IQ/instrument 60 59
Furthermore, agreements with the two students who were willing to participate in this experiment were verbally obtained. Verbal permission was also asked of the students who participated before they were asked about the targeted words. (see Figure 2.1)
3.5 The Research Variables
According to Hatch and Farhady (1982:15), the independent variable is the major variable that a researcher hopes to investigate, and the dependent variable is the variable that the researcher observes and measures to determine the effect or the independent variable. Also, in the this research, the independent variable was known as the treatment variable. Thus, the independent variable of this research was the effectiveness of the use of picture in improving students' vocabularies.
The dependent variable is the variable that the independent variable is presumed to affect (Fraenkel and Wallen, 2007:43), and the dependent variable in this study was the students' vocabularies as it was the variable which was observed and was measured to determine the effect of the independent variable.
3.6 The Research Preparation
In preparing this research, the writer observed the spot of the research, gaining entry or establishing rapport (Alwasilah, 2011). After that, the preparation was focused on the teaching material and instruments. Besides, the writer needed to arrange the time allocation of the research.
First, the term material or often lesson is defined as a unified set of activities that cover a period of classroom time (Brown, 2001:149). Since this research engaged with the second grade students of SMPLB Sungailiat, the classroom time was thirty five minutes. Moreover, for the material, the writer was adapted to target vocabulary that gained.
Second, to accomplish every event of this research needed to be planned in a well-organized time schedule. In this case, this research was held for about one month and ten days from 31st October to 11th December 2014. Related to the final examination on odd semester 2013, so the schedule was changed. The writer revised the time. And the research was done after the students followed the examination.
Table 3.2 Time Schedule of the Research
No. Day Date Time Activitie s De scription
No. Day Date Time Activitie s De scription
3.7 Techniques of Collecting Data
To meet the purpose of the research, this study employed two techniques of collecting data namely tests and observations. Each of the techniques will be described below and the division of gathering the instruments is shown in Table 3.2.
3.7.1 Classroom Observation
The first instrument was classroom observation, where seventeen classroom observations were conducted before and during the research. To gain first-hand experience of the activity, the observation was done to get direct and actual information about students’ activity in learning vocabulary. As Silverman (2001) said, the observation is aimed to get to know firsthand information about social processes in a naturally occurring context. As a participant observer in this study, the researcher acted as an observer and presented at the scene of action, interacted and participated in the activity.
Moreover, when the observations were taking place, the whole activities of the instructional practices were recorded using a video-tape recorder, as Richard (1990) emphasizes that the use of audio or video recording of lessons also provides a more reliable record of what actually happened in the classroom.
During the observations, while “the memory of the observation was still fresh”
(van Lier, 1988:241) the researcher wrote observation notes immediately after each session. The notes were made to record the information about when and how the classes began, and also the time of activities took place. This aimed to help
“increase the researcher’s sensitivity to her own classroom behavior and its effects
3.7.2 Tests
The test was used in this study was to identify students’ vocabulary achievement. The data of this study is students’ scores. They were assessed and
scored on selected indicators in a theoretical framework.
3.7.2.1 Try out of test
A good test must be valid, and practicable (Heaton, 1995). Besides, Arikunto (2006:168) states that a good instrument must be achieved at least two important requirements, which are valid and reliable. For that reason, in this research, the writer tries out the instrument to another class in the same grade from another school (SMPLB Pangkalpinang) the try out test was examined to find out the instruments was appropriate or not before Baseline-1, intervention, and Baseline -2 was administered. Moreover, the writer first consulted the instrument to be supervised by expert judgements before the instrument was tested to the students. This try out test was conducted in one meeting of 35 minutes instruction, and this test involved four students who have the same characteristics. In this research, the students were asked to answer the test given. After twice tests obtained, the original scores were analyzed using Pearson Product Moment.
3.7.2.2 The Reliability Test
3.7.2.3 The Validity Test
A good test should have, at least, three characteristics; namely validity, reliability and practicality (see Harries,1979; Heaton,1988; Sudjana,2006). Validity test aimed to find the correspondence between the objective measurement gauges, or search for correspondence between measurements with what is to be measured, so that the learning result of the test can be said to be valid when the tests actually measure the learning outcome. Instruments which were used were validated by the expert or teachers who are competent in the field. The experts were asked their opinions about the instrument that had been developed. The experts made a decision: whether the instrument could be used without any improvement, need improvement or possibly overhauled. Data obtained through expert judgment were calculated using the formula:
∑
∑
Note :
∑ = amount of match
∑ = amount expert-judgement P = percentage
Thus, the data instrument used was expected to be able to measure the
ability of students with mild intellectual disability’s vocabulary.
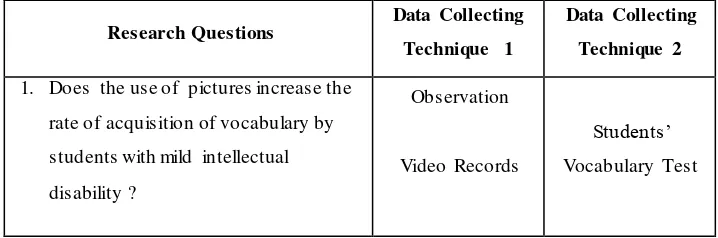
Table 3.3 Data Collecting Techniques Collected Based on Research Questions
Research Questions
Data Collecting
Technique 1
Data Collecting
Technique 2
1. Does the use of pictures increase the
rate of acquisition of vocabulary by
students with mild intellectual
disability ?
Observation
Video Records
2. What are the students’ responses
towards the implementation of the use
of pictures?
Observation
Video Records
3.8 Data Analysis
Data analysis in this study was conducted over the course of the study. Ongoing data analysis and interpretation were done on the data from document analysis including observations and test. Each steps of analysis of the two sources of data was given in the following section.
3.8.1 Classroom Observation
Data from the observations were analyzed descriptively. This is to follow Cresswell (1994) who says that data that emerge should be reported in words
(primarily the participants’ word). The data analysis process was commenced by making a verbatim transcription of classroom interactions. Then, the transcription was read repeatedly. During the reading process, the researcher employed coding activity by matching the data with the research questions. This coding process was aimed at fracturing the data and rearranging them into categories that facilitate the comparison of data within and between these categories (Maxwell 1996:78)
3.8.2 Tests
After conducting the research, the writer obtained the score test related to the teaching vocabulary to Students with intellectual disability. The data were analyzed using descriptive statistics to obtain a clear picture of the results of interventions to increase the understanding of the English language vocabulary for students with mild intellectual disability after a given intervention within a specific period by using pictures and were presented in graphical form.
is any functional relation between independent and dependent variable, the next step was by giving test again to withdraw the intervention and return to Baseline
conditions A-2, without giving any intervention. The score test in the A-1, B, and A-2 are raw score, and not analysed yet.
The data obtained are the mean score of student with the intellectual disability vocabulary test. The data analysis used in this study is analysis of changes within condition which is concerned primarily with the stability of the data and analysis of changes between condition which is a stable data path should be present in the condition immediately preceding the condition being analyzed.
The criterion/ component used to analyse the number of data points plotted within a condition are condition length, trend direction of slope, level stability, level change within a condition, data path within the trend, change one variable at a time, percentage overlap.
The use of this analysis was expected to see a clear picture of the implementation of the experiment before subjects received treatment at Baseline
conditions and after obtaining intervention efforts over time.
3.9 Concluding Remark