L
Journal of Experimental Marine Biology and Ecology 245 (2000) 215–224
www.elsevier.nl / locate / jembe
Precision of different methods used for estimating the
abundance of the nitrogen-fixing marine cyanobacterium,
Trichodesmium Ehrenberg
* Jeng Chang
Institute of Marine Biology, National Taiwan Ocean University, Keelung 202-24, Taiwan Received 25 July 1999; received in revised form 3 September 1999; accepted 25 October 1999
Abstract
Variances involved in estimating the abundance of the nitrogen-fixing marine cyanobacterium,
Trichodesmium Ehrenberg, were evaluated by repeated sampling using bottle casts and plankton
net tows at two stations in the southern East China Sea. The variance among individual samples and the variance arising from subsampling processes were separated by the method of analysis of variance, and the coefficient of variation (C.V.) of an abundance estimate based on a single subsample was calculated. For bottle-collected samples, the major source of variation came from taking subsamples from a water bottle. The C.V. of a single subsample estimate ranged from 57% to 184%. For net-collected samples, variance in abundance estimation was mainly caused by distinctive net tows, and when distributing materials in the receiving bucket into smaller containers. The C.V.s of single subsample estimates were 34% and 40%, respectively.
Tri-chodesmium abundance estimated with bottle- and net-collected samples were further compared
using data obtained from 17 stations in the East China Sea. Although a general distribution pattern was supported by both methods, the correlation coefficient between them was 0.461, not significantly different from 0. 2000 Elsevier Science B.V. All rights reserved.
Keywords: Abundance estimation; Nitrogen fixation; Plankton nets; Sampling design; Subsampling; Tri-chodesmium; Water bottles
1. Introduction
Trichodesmium Ehrenberg comprises a group of filamentous cyanobacteria distributed
*Tel.: 1886-2-2462-2192 ext. 5308; fax:1886-2-2463-3152. E-mail address: [email protected] (J. Chang)
mainly in tropical and subtropical oceans (for a review, see Capone et al., 1997). Each filament, or trichome, is composed of about 100 cells, and trichomes often aggregate together to form spherical or fusiform colonies (Nagasawa and Marumo, 1967).
Trichodesmium is the major organism that fixes dinitrogen in oceanic environments
(Capone et al., 1997). Recent evidence indicates that the fixed nitrogen as a source of nutrient input supports a significant portion of global new production (Karl et al., 1997). An accurate assessment of spatial and temporal distribution of Trichodesmium is important to calculate regional and global nitrogen fixation rates.
To date, although a remote sensing algorithm is under development (Subramaniam and Carpenter, 1994), the great majority of information about Trichodesmium dis-tribution comes from microscopic examination of water samples. Water samples with a volume from 500 ml to 8 l are routinely used for such purposes, and a process of sedimentation or filtration is required to concentrate trichomes before the actual counting (Marumo and Asaoka, 1974a; Carpenter and Romans, 1991). A drawback of this approach is that large, but sparse, colonies are easily missed due to small sample volumes (Capone et al., 1997). In addition, unless the intracellular gas vesicles are destroyed by acid treatment, the positively buoyant Trichodesmium trichomes may float to the surface during the sedimentation procedure (Capone et al., 1997).
Another consideration of bottle-collected samples is that a sample with very limited volume may not be representative enough to reflect Trichodesmium abundance at a sampling station. The highly heterogeneous distribution of Trichodesmium is clearly seen during a bloom event (Karl et al., 1992), and similar distributions are very likely to occur during nonbloom conditions. To overcome this difficulty, sampling with a plankton net is another commonly used method for the estimation of Trichodesmium abundance (e.g., Marumo and Asaoka, 1974b). The general recommendation is to use a mesh size of less than 100mm and to tow the net at a low speed (Capone et al., 1997). However, single trichomes may escape through gauze apertures, and the use of a flowmeter to measure the volume filtered can be inaccurate (Tangen, 1978).
Regardless of the tools used to collect water samples, some subsampling procedures are often involved so that only trichomes in an aliquot of the original sample are enumerated. For example, out of materials collected in the receiving bucket (the cod-end jar) of a plankton net, only a small portion is preserved and counted. Similarly, in a counting chamber containing concentrated water samples, only trichomes in limited fields are enumerated. These subsampling processes inevitably introduce variations and affect the precision of the final counts (Venrick, 1978).
2. Materials and methods
During a cruise on board R / V Ocean Researcher II to the East China Sea on 31 August 1994, water samples containing Trichodesmium trichomes were collected by both Go-Flo bottles and a plankton net from a station at 25813.39N, 122851.49E. The size of the Go-Flo bottles was 2.5 l (General Oceanics, Miami, FL, USA), and a total of five samples were taken from a depth of 20 m. From each Go-Flo bottle, two subsamples, with a volume of 1 l each, were retrieved sequentially and fixed with acidic Lugol’s solution (Throndsen, 1978). Trichomes in the subsamples were concentrated by settling (Sukhanova, 1978). First the 1-l bottle was allowed to settle on a bench for at least 2 days. The supernatant sea water was then carefully removed using an aspirator until about 50 ml of sample remained. The concentrated sample was transferred to a conical centrifugation tube and went through a second round of settling. Finally, the subsample volume was reduced to 1 ml, and trichomes were counted in a Sedgwick–Rafter counting cell at 1003. The entire counting cell was scanned and total number of trichomes was recorded.
Net-collected samples were obtained using a plankton net with 20-mm mesh size and a mouth diameter of 0.5 m. The length of the net was 2.5 m. A flowmeter (Model 2030R, General Oceanics) was attached to the center of the mouth ring as a means to estimate the volume of water filtered. The net was towed at 20-m depth with a speed of 1 knot for 10 min, and three net tows were conducted at each station. The materials in a receiving bucket were subsampled into three scintillation vials (volume517 ml each) and preserved with Lugol’s solution. For counting the trichomes, two aliquots of 1 ml in volume were retrieved from a scintillation vial after thorough mixing. Each aliquot was placed in a Sedgwick–Rafter cell, and the entire counting cell was examined. The number of trichomes observed in each counting cell was converted to natural abundance in the water column, and the abundance data was used for further analysis.
Identical sampling procedures were repeated on 2 July 1995 at a nearby station (25825.79N, 122817.89N). During this cruise, in addition to the five Go-Flo samples for settling, another five Go-Flo samples were obtained, and each of the two subsamples from a Go-Flo bottle was immediately filtered through a 2-mm pore size Nuclepore filter on board (Capone et al., 1997). The Nuclepore filter was then mounted on a microscope slide with a small amount of immersion oil, and was stored at 2158C. Trichomes on the Nuclepore filter were examined with an Nikon epi-fluorescence microscope using 450 to 490 nm as the excitation wavelengths for phycoerythrin (Brock, 1978; Carpenter et al., 1990). The entire filter membrane was scanned to obtain total number of trichomes in a 1-l subsample.
The statistical method of analysis of variance (ANOVA) was employed to estimate the variances from different sources (Venrick, 1978). For bottle-collected samples, two sources of variation were identified in the final estimate of trichome concentration (Table
2
1). One came from taking two subsamples in a Go-Flo bottle (s2), which was estimated by the mean square among subsamples (MS ). Since a significant portion of the Go-Flo2
2
sample was used as a subsample, MS actually estimated the product of2 s2 and FPC2, the finite population correction. The equation for FPC2 is (Venrick, 1978):
V2v
]]
FPC25 (1)
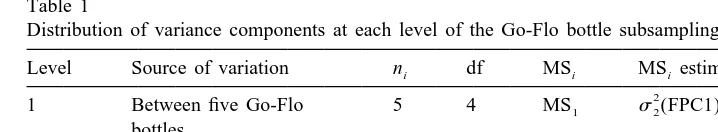
Table 1
a
Distribution of variance components at each level of the Go-Flo bottle subsampling procedure
Level Source of variation ni df MSi MS estimatesi
2 2
n : Number of samples taken from a population at level (ii 21), df: degrees of freedom, MS : mean squarei
2
of level i,si: variance of level i.
wherevis the volume of a subsample (1 l), and V is the volume of a Go-Flo bottle (2.5
2
l). The other source of variation came from different Go-Flo bottles (s1) which represented the natural variation of trichome distribution at the sampling site. However,
2 2
the mean square among Go-Flo bottles (MS ) estimates a combination of1 s1 and s2
2
where n is the number of subsamples taken from a Go-Flo bottle. Again, FPC1 was2
used to adjust the effect of large subsample volume, and the equation is (Venrick, 1978):
V2n v
2
]]]
FPC15 (3)
V
The mean squares at each level was obtained by constructing a standard ANOVA table (Sokal and Rohlf, 1981).
The variance components at each level were used to calculate the coefficient of variation (C.V.) of an abundance estimate (x) based on a single 1-l subsample from a single Go-Flo bottle (Woelkerling et al., 1976):
]]]2 2
The procedure to separate the variance components in net-collected samples was very similar to that for bottle-collected samples, and detailed descriptions can be found in Venrick (1978). With this sampling design, three sources of variation came from the
2
variation between counting cells within scintillation vials (s2), variation among
2
scintillation vials within receiving buckets (s1), and natural variation reflected by
2
individual tows (s0), respectively. No finite population correction was needed because all subsamples occupied a very small fraction of the upper-level samples.
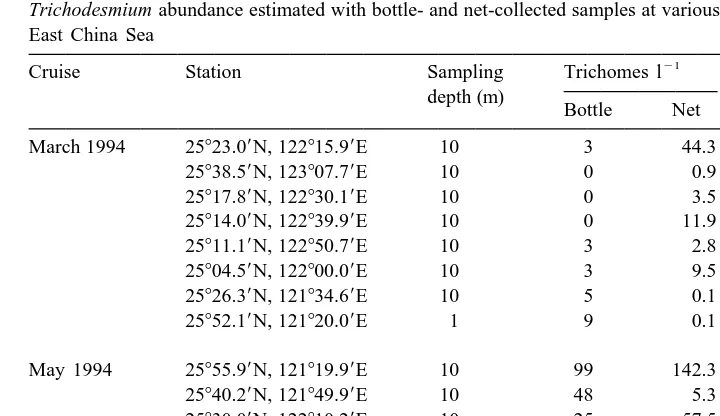
Table 2
Trichodesmium abundance estimated with bottle- and net-collected samples at various locations in the southern East China Sea
21
Cruise Station Sampling Trichomes l Volume filtered
depth (m) by net (l)
Most of Trichodesmium existed as individual trichomes in the samples. Even in net-collected samples, colonial forms were rarely seen. The observed colonies were usually small and contained 10 to 50 trichomes. Judging by the low abundance of colonial forms, variation caused by colony-formation was ignored in data analysis.
In samples collected by Go-Flo bottles in July 1995 and concentrated by settling,
21
trichome concentrations ranged from 27 to 109 trichomes l with a mean of 58.6
21
trichomes l (Table 3). The variance due to natural distribution in the vicinity of the
2 22
Go-Flo bottles was estimated to be 136.8 trichomes l , and the variance due to
2 22
subsampling from a Go-Flo bottle was 1177.3 trichomes l (Table 4). If trichome
Table 3
21 a
Trichodesmium abundance (trichomes l ) in individual subsamples
Date Subsample Go-Flo number Mean
(filtration) 2 41 49 22 54 87 60.2
August 1994 1 24 11 16 20 5
(settling) 2 4 0 0 4 59 14.4
a
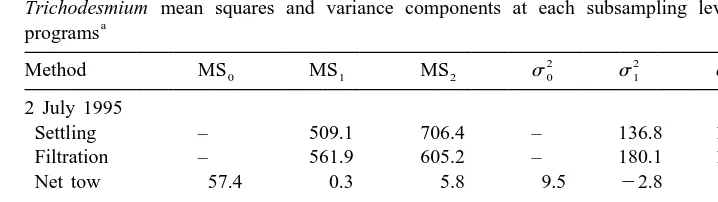
Table 4
Trichodesmium mean squares and variance components at each subsampling level in various sampling a
programs
2 2 2
Method MS0 MS1 MS2 s0 s1 s2 C.V. (%)
2 July 1995
Settling – 509.1 706.4 – 136.8 1177.3 62
Filtration – 561.9 605.2 – 180.1 1008.7 57
Net tow 57.4 0.3 5.8 9.5 22.8 5.8 40
31 August 1994
Settling – 217.9 394.9 – 43.1 658.2 184
Net tow 156.0 50.8 5.1 17.5 22.9 5.1 34
a
The calculated C.V. for a single-subsample estimate is also listed. Settling and filtration are two methods used to concentrate trichomes in bottle-collected samples.
concentration at this station has to be estimated with a single subsample from a single Go-Flo bottle, as commonly practiced in oceanographic investigations, the calculated C.V. was 62%.
The subsamples initially retrieved from a Go-Flo bottle always had lower trichome concentrations (Table 3). A paired t-test indicated that the initially retrieved subsamples contained significantly fewer trichomes at the P,0.05 level. Additional evidence came from samples collected in August 1994. Vastly different trichome concentrations were found between the two subsamples from the same Go-Flo bottle (Table 3). During this cruise, the sequence of subsamples was not recorded. Most likely, the subsamples with fewer trichomes were initially retrieved. The extremely uneven distribution greatly
2
increaseds2, and if a single subsample was used to estimate Trichodesmium abundance, the C.V. would be 184% (Table 4).
To evaluate if trichomes failed to sink when the subsamples were settled, filtration was used as an alternative method to concentrate Trichodesmium. The mean trichome
21
concentration found on the Nuclepore filters, 60.2 trichomes l , was very close to the mean from the settling method (Table 3). The magnitude of variance at each level was also similar, and a C.V. of 57% was calculated for a single subsample estimate (Table 4). For net-collected samples, the variance caused by taking a 1-ml subsample from a scintillation vial was small (Tables 4 and 5). Much of the total variance was contributed
2
by distinctive net tows (s0) and by distributing the water sample in a receiving bottle
2
into scintillation vials (s1). If Trichodesmium abundance was estimated from a 1-ml subsample obtained from a single net tow, the C.V. ranged from 34% to 40%. C.V.s of net-collected samples did not vary much between the two cruises, and had lower values than did any of the bottle-collected samples (Table 4).
Trichodesmium abundance estimated with bottle-collected samples often failed to
match that estimated with net-collected samples. For example, during the July 1995
21
cruise, the bottle cast method estimated a concentration of 58.6 trichomes l , but the
21
approximate-Table 5
21 a
Trichodesmium abundance (trichomes l ) in individual subsamples
Vial number Net tow number Mean
¯ (x )
1 2 3
2 July 1995
1 8.6 7.8 3.9
15.4 9.0 6.8
2 9.0 10.3 5.6
14.7 8.9 5.9
3 10.1 9.5 6.6
13.3 8.1 5.2 8.8
31 August 1994
1 24.7 25.3 19.1
27.4 21.2 16.2
2 11.0 24.9 17.3
11.2 26.4 16.0
3 11.5 26.1 20.6
12.4 29.7 14.2 19.7
a
Original water samples were collected with a plankton net.
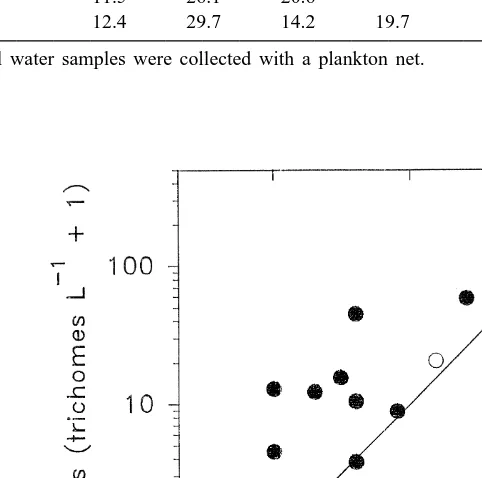
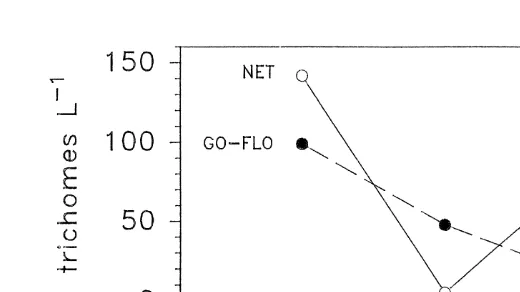
Fig. 2. Trichodesmium. Abundance at 10-m depth estimated with bottle-collected (d) and net-collected
samples (s) along a transect starting at 25855.99N, 121819.99E and ending at 25819.89N, 122830.29E.
ly the same distribution pattern for Trichodesmium with high concentrations at the western end, decreasing toward the east (Fig. 2).
4. Discussion
Subsampling from a Go-Flo bottle contributes 90% and 94% of the total variance observed, which indicates a heterogeneous distribution of Trichodesmium trichomes in a sampling bottle (Tables 3 and 4). Equipped with gas vesicles, the floating velocity of
21
Trichodesmium is in the range between 0.1 and 3 mm s (Walsby, 1992), and a simple
calculation indicates that trichomes on the bottom of a Go-Flo bottle may rise to the top in 4 to 113 min. Therefore, an uneven distribution of trichomes may form during the 10 to 30 min required to retrieve a rosette sampler. To avoid this problem, the content of the entire Go-Flo bottle should be used as a single sample. If subsampling is absolutely necessary, a thorough mixing is needed before an unbiased subsample can be obtained. The subsequent concentration by either settling or filtration has no effect on the final estimate (Table 3).
Using a plankton net to collect Trichodesmium has several advantages. According to the sampling design of this study, the detection limit of a plankton net is around 0.1
21 21
trichomes l , which is much lower than the 1 trichome l limit for Go-Flo bottles.
Trichodesmium abundance estimated from net-collected samples is also more
reproduc-ible (Table 4), probably a result of averaging out naturally occurring horizontal variation by filtering thousands of liters of sea water (Table 2).
samples at selective locations is also helpful to judge if colonies missed by a single bottle cast are a major cause for underestimating Trichodesmium abundance.
The correlation analysis indicates that Trichodesmium abundance estimated with bottle- and net-collected samples are not directly comparable (Fig. 1). The large discrepancies observed may come from the fact that the two methods operate on very different spatial scales. A Go-Flo sample represents trichome abundance in the vicinity of a rosette sampler, while a net tow represents the mean abundance across several hundred meters. Although both methods describe a similar distribution pattern in the sea (Fig. 2), caution must be used when a conclusion is drawn based on a mixture of data from different sampling methods, especially when only a small number of data points are considered.
Acknowledgements
I thank H.-T. Yang and J. Lee for their assistance in sampling and enumerating trichomes. This work was supported by the R.O.C. National Science Council grants NSC83-0209-M-019-007K and NSC87-2611-M-019-013-K2. [SS]
References
Brock, T.D., 1978. Use of fluorescence microscopy for quantifying phytoplankton, especially filamentous blue–green algae. Limnol. Oceanogr. 23, 158–160.
Capone, D.G., Zehr, J.P., Paerl, H.W., Bergman, B., Carpenter, E.J., 1997. Trichodesmium, a globally significant marine cyanobacterium. Science 276, 1221–1229.
Carpenter, E.J., Romans, K., 1991. Major role of the cyanobacterium Trichodesmium in nutrient cycling in the North Atlantic Ocean. Science 254, 1356–1358.
Carpenter, E.J., Chang, J., Cottrell, M., Schubauer, J., Paerl, H.W., Bebout, B.M., Capone, D.G., 1990. Re-evaluation of nitrogenase oxygen-protective mechanisms in the planktonic marine cyanobacterium Trichodesmium. Mar. Ecol. Prog. Ser. 65, 151–158.
Karl, D., Letelier, R., Hebel, D.V., Bird, D.F., Winn, C.D., 1992. Trichodesmium bloom and new nitrogen in the North Pacific Gyre. In: Carpenter, E.J., Capone, D.G., Rueter, J.G. (Eds.), Marine Pelagic Cyanobacteria: Trichodesmium and Other Diazotrophs, Kluwer, Dordrecht, pp. 219–237.
Karl, D., Letelier, R., Tupas, L., Dore, J., Christian, J., Hebel, D., 1997. The role of nitrogen fixation in biogeochemical cycling in the subtropical North Pacific Ocean. Nature 388, 533–538.
Marumo, R., Asaoka, O., 1974a. Trichodesmium in the East China Sea. J. Oceanogr. Soc. Japan 30, 298–303. Marumo, R., Asaoka, O., 1974b. Distribution of pelagic blue–green algae in the North Pacific Ocean. J.
Oceanogr. Soc. Japan 30, 77–85.
Nagasawa, S., Marumo, R., 1967. Taxonomy and distribution of Trichodesmium (Cyanophyceae) in the Kuroshio water. Inf. Bull. Planktol. Japan (Commemoration Number), 139–144.
Sokal, R.R., Rohlf, F.J., 1981. Biometry, 2nd Edition, Freeman, San Francisco, CA.
Subramaniam, A., Carpenter, E.J., 1994. An empirically derived protocol for the detection of blooms of the marine cyanobacterium Trichodesmium using CZCS imagery. Int. J. Remote Sensing 15, 1559–1569. Sukhanova, I.N., 1978. Settling without the inverted microscope. In: Sournia, A. (Ed.), Phytoplankton Manual,
United Nations Educational, Scientific and Cultural Organization, Paris, p. 97.
Throndsen, J., 1978. Preservation and storage. In: Sournia, A. (Ed.), Phytoplankton Manual, United Nations Educational, Scientific and Cultural Organization, Paris, pp. 69–74.
Venrick, E.L., 1978. The implications of subsampling. In: Sournia, A. (Ed.), Phytoplankton Manual, United Nations Educational, Scientific and Cultural Organization, Paris, pp. 75–87.
Walsby, A.E., 1992. The gas vesicles and buoyancy of Trichodesmium. In: Carpenter, E.J., Capone, D.G., Rueter, J.G. (Eds.), Marine Pelagic Cyanobacteria: Trichodesmium and Other Diazotrophs, Kluwer, Dordrecht, pp. 141–161.