Economics of Education Review 14 (1999) 65–77
Graduate training and the early career productivity of Ph.D.
economists
Thomas C. Buchmueller
a,*, Jeff Dominitz
b, W. Lee Hansen
caGraduate School of Management, University of California, Irvine, CA 92697-3125, USA
bDivision of the Humanities and Social Sciences, California Institute of Technology, Pasadena, CA 91125, USA cDepartment of Economics, University of Wisconsin-Madison, Madison, WI 53706-1393, USA
Received 10 September 1996; accepted 30 October 1997
Abstract
This paper estimates the relationships among the attributes of graduate economics programs and the occupational choices and publishing proficiency of recent Ph.D.s. The estimates indicate that research experience in graduate school (e.g. working as a research assistant, submitting and publishing articles) is positively associated with subsequent pub-lishing proficiency. Other variables included in the analysis include graduate school ranking, graduate school faculty size and its publishing proficiency, and individual demographic characteristics and academic experiences. 1998 Elsevier Science Ltd. All rights reserved.
Keywords:A23; J44; I21
1. Introduction
In 1988, the American Economic Association formed the Commission on Graduate Education in Economics (COGEE) to “take stock of what is being done” in gradu-ate education (Krueger et al., 1991). To aid in this effort, COGEE developed a series of surveys of various seg-ments of the population of practicing and aspiring econ-omists — faculty members, recent Ph.D.s, current gradu-ate and undergradugradu-ate students, and of the organizations employing them — academic economics departments and non-academic employers. With the aid of survey results and a series of special studies, COGEE issued reports of its findings and recommendations (Hansen, 1990, 1991; Krueger et al., 1991). These reports indicate that, although the formal training of graduate students seems quite similar across the range of Ph.D. programs, there appear to be substantial differences among students in the extent to which they believe their formal training
* Corresponding author.
0272-7757/98/$ - see front matter1998 Elsevier Science Ltd. All rights reserved. PII: S 0 2 7 2 - 7 7 5 7 ( 9 8 ) 0 0 0 1 9 - 3
develops research skills, when and how they first become involved in research activities, and how quickly they complete their dissertations.
We continue this effort to assess the state of graduate education in economics. Prior work has focused on sub-jectiveassessments contained in survey responses, infor-mal comparisons of standards and practices across gradu-ate programs, and comparisons of trends in enrollment and earnings across disciplines. We attempt to obtain an objectiveassessment of the educational process by esti-mating the relationship between graduate training and the publishing proficiency of recent Ph.D. recipients. COGEE surveys of two cohorts of Ph.D. recipients and publication records constructed from the Journal of Economic Literaturesupply the bulk of the data.
pos-itions and, conditional on job placement, with a higher rate of publication.
2. Background and previous literature
2.1. Educational production functions
The concept of an educational production function provides a useful framework for studying the effective-ness of graduate education. Educational production func-tions relate educational outputs to the inputs in the edu-cational process. Inputs include the raw materials (incoming graduate students), labor (faculty members and support staff) and capital (classroom, computing, and library resources). The goal of this analysis is to learn how the productivity of Ph.D. economists varies with attributes of the graduate training process.
To succeed, we must be able to measure not only the inputs to the production process, but also the outputs. Although some educators deny the legitimacy of any quantitative measure of educational outputs,1the
unde-niable emphasis of economics graduate programs on training students to publish articles eases the task some-what. Hogan (1981), in perhaps the only prior attempt to estimate the relationship between economic education inputs and outputs, justifies his publications-based output measure by the use of “publishing performance” in pro-motion, tenure, and salary decisions in the academic sec-tor. We also employ publications of graduates as a meas-ure of program effectiveness.2
Suppose we accept published research as the appropri-ate yardstick for assessing graduappropri-ate training effective-ness. What are the limits of such an analysis? The pri-mary problem we see is the strong relationship between publications and the job one holds. An economist’s pub-lication record will be greatly affected by the resources and incentives for publishing provided by the job. For example, an economist employed at a leading research university will be offered greater supporting resources (e.g. research assistance, computing services, and a lighter teaching load) and will obtain greater rewards (e.g. salary and tenure) for publishing in economic jour-nals than will an economist of equal productive capacity who happens to be employed at a Wall Street investment firm or a small liberal arts college. Thus, a structural
1See Hanushek (1986) for a discussion of this issue. 2Obviously, increasing the publishing capacity of students is not the only desirable trait of graduate training. Only the harsh-est critics of graduate education would deny that programs attempt to impart teaching skills. Unfortunately, we cannot measure this output with the available data. Nor can the earn-ings of graduates be utilized as a measure of program effective-ness for the simple reason that earnings data for the COGEE survey sample are not available.
analysis of the effect of graduate training on individual productivity requires information on both job character-istics and the selection process into these jobs.
2.2. Previous empirical findings
While many social scientists have studied the determi-nants of scientific productivity in a variety of disciplines, relatively little research has been done to link graduate program attributes to subsequent productivity. We dis-cuss several aspects of this literature, concentrating on research that estimates the direct and indirect effects of graduate training on subsequent research productivity. What we label the direct effect of graduate training on publishing proficiency is the accumulation of human capital associated with the increased capacity of the stud-ent to publish. The indirect effect is the increased utiliz-ation of this human capital via placement in a job that supports and rewards publishing.
Hogan (1981) examines the relationships between inputs in graduate education — the quality and number of faculty members and students — and the output-graduates’ average rate of publication in four top eco-nomics journals. He finds a positive and statistically sig-nificant effect of faculty publishing performance on stu-dents’ subsequent publication rates and argues that this result provides “indirect evidence of jointness in the pro-duction of graduate training and research output.” That is, by sharing the research experience with students, fac-ulty members produce published articles and simul-taneously impart research skills to students.
the student collaborated with this individual, and a meas-ure of the “selectivity” of the school from which the baccalaureate was obtained. Each graduate education variable has the expected relationship with the quality of the first post-Ph.D. job as well as with subsequent research productivity. Although prior-to-Ph.D. research output shows a strong, positive effect on subsequent out-put, it is only weakly related to job placement. Long’s results are essentially corroborated by Long and McGinnis (1981).
3. Empirical specification
The preceding discussion suggests the following model of the determination of publishing proficiency:
PUBS5ƒ(TRAINING, JOB, X, u) (1)
where an economist’s post-Ph.D. publication record (PUBS) depends on his graduate training (TRAINING), the type of job he holds immediately after completing that training (JOB), his observed personal characteristics (X) and unobserved factors (u). Our data on publications, training, employment, and personal characteristics are discussed in Section 4.
One problem in estimating this model is that the indi-vidual’s first job is endogenous. That is, new Ph.D. econ-omists differ in their research interests and publishing potential. Future productivity is obviously uncertain at the time they enter the job market, but prospective employers have more information on which to base a prediction than do we as analysts. Thus, we would expect that individuals with higher than average publishing potential will sort into jobs that reward publishing (e.g. research-oriented academic positions). Failing to account for this endogeneity means that our estimates of the relationship between job placement and early publi-cations will overstate the true structural impact of the former on the latter.
With data on factors that influence job placement but not directly influence subsequent research output, we could estimate a linear version of Eq. (1) by instrumental variables. Unfortunately, however, we lack such ident-ifying variables.3 As an alternative to structural
esti-3In earlier versions of this study we attempted to use the year an individual went on the job market to identify the model. The assumption was that year dummies would pick up the effect of demand shifts which influenced the number and type of jobs available, but were uncorrelated with any individuals’ charac-teristics. The problem is that our sample is defined by the year an individual received his or her Ph.D., so the year an individual went on the job market is correlated with the length of time in graduate school and the distance from completing the disser-tation. A GMM orthogonality test (Newey, 1985) rejected the validity of the year dummies as instruments.
mation, we take the following approach. First, we esti-mate best linear predictors of publications given individual and graduate program characteristics, but not employment characteristics. These results may be inter-preted as reduced form parameter estimates from a sys-tem of structural equations determining both job place-ment and publishing proficiency. As such, these estimates capture the covariation of publications and pre-dictor variables associated with both the direct and the indirect effects of these variables on realized publi-cations output.
We also estimate best linear predictors in which a measure of job placement is included among the predic-tor variables. For reasons discussed below, we divide jobs held by Ph.D. economists into two categories: fac-ulty jobs at research universities (Academic/Ph.D. sector) and all other jobs. The estimated relationship between job type and publications combines the struc-tural impact of an individual’s employment setting on publications and the effect of unobserved heterogeneity among factors influencing selection into employment sector. Finally, to explore this relationship further and to examine how early research experience influences job placement, we estimate a probit model in which the dependent variable equals one for individuals whose first jobs are in the Academic/Ph.D. sector and equals zero for individuals who sort into other types of positions.
An additional consideration in the estimation of Eq. (1) is that the empirical distribution of publications is discrete, with large probability mass at zero. One poss-ible econometric specification to accommodate count data is the compound Poisson/negative binomial model (Cameron and Trivedi, 1986; Goodwin and Sauer, 1995). Other authors have estimated a Tobit model of publi-cations (Levin and Stephan, 1991).
relation-ships among graduate training, job placement, and publi-cation productivity.
4. Data
4.1. The COGEE survey
Our principal source of data is the COGEE survey of Ph.D. economists receiving their degrees in 1977–78 and 1982–83. The COGEE sample is not a random sample of all Ph.D.s within the two cohorts. Rather, it follows a stratified sampling procedure based on separating graduate programs into “quality tiers” according to department rankings presented in Jones et al. (1982). The first tier consists of the top six programs. Tiers 2 and 3 consist of programs ranked 7 to 15 and 16 to 30, respect-ively. Tier 4 is defined as programs ranked from 31 to 50, and Tier 5 includes the remaining 44 Ph.D. programs listed in Joneset al.
With the exception of one that refused to participate, all programs in Tiers 1 and 2 are in the sample frame, as are seven of the 15 Tier 3 programs, and 14 of the 61 programs in Tiers 4 and 5. Each graduate program in the COGEE sample frame supplied names and addresses of graduates receiving their Ph.D.s in 1977–78 and 1982–83. Using these address lists, surveys were sent to all graduates residing in the United States. The response rate was roughly 60 percent.
We have reason to believe that the sample resulting from this process differs from the population in several ways. First, and most obviously, our sample is weighted more heavily toward graduates of top programs.4Even
within tiers, there are two other likely sources of bias. First, Ph.D.s not residing in the U.S. were not sampled. Second, Ph.D.s who are most involved in the profession may have been more likely to respond to the survey. Thus, our sample should have a higher publication rate than the population of all Ph.D.s. A comparison of publi-cations by our sample and by the population of Ph.D.s in these cohorts, presented in Section 5, confirms this belief. This bias is likely to vary across sub-groups. In particular, the bias will be larger for groups with rela-tively low participation in the profession — e.g. individ-uals in non-academic jobs — than for groups with rela-tively high participation — e.g. those in academic jobs.
4Tier 1 graduates represent 34% of our COGEE sample, but only 20% of the population. The corresponding percentages for Tier 2 are 42% and 21%. Relative to the population, Tiers 3, 4 and 5 are under-represented in our sample. The COGEE results (reported in Hansen, 1990, 1991; and Krueger et al., 1991) were weighted to account for the sampling scheme.
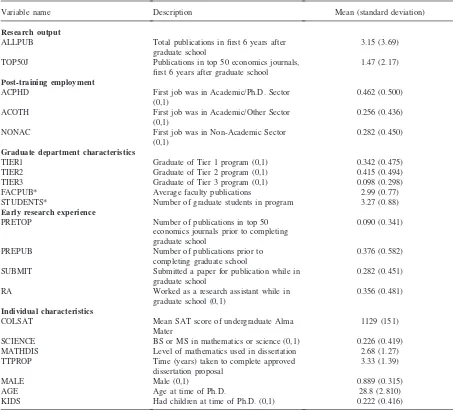
Table 1 presents definitions and summary statistics for the variables used in our analysis. The variables can be divided into five categories: research publications, post-training employment setting, graduate department characteristics, early research experience, and individ-ual characteristics.
4.2. Description of variables
4.2.1. Research publications
Names of the Ph.D. economists in our sample were matched with bibliographic entries from the JEL’s on-line Economic Literature Index (ELI) (Ekwurzel and Saf-fran, 1985). We use two different measures of research output. The first measure counts all publications, be they journal articles, conference reports, or chapters in books; the second counts only articles in journals ranking among the top 50 (Leibowitz and Palmer, 1984).5
Neither measure differentiates among publications with multiple authors.6
Our regression analysis of the COGEE sample data focuses on articles published within the first six years after leaving graduate school. Implicit in this taxonomy is our assumption that “the clock starts” when an econ-omist begins his first job rather than when he receives the Ph.D. Six years is chosen as the interval length to correspond with the typical tenure schedule.7
In addition, the names of all 1977–78 and 1982–83 Ph.D. recipients published in the JEL were also matched with the ELI data. Since we lack survey data on the full population we cannot use these data to investigate the impact of graduate training on research publications. However, the population publications data help to pro-vide a more complete picture of economists’ early pub-lishing activity and allow us to better understand how our sample differs from the population.
5Leibowitz and Palmer present several different rankings. The one we use ranks journals on the basis of “impact-adjusted” citations (number of citations weighted by the quality of the citing journal) for articles published between 1975–1979.
6The second measure makes some distinction based on the perceived quality or selectivity of the publication outlet, but substantial heterogeneity remains. An alternative approach is to use the Leibowitz and Palmer rating scale to construct a “qual-ity-adjusted” output measure, as did Sauer (1988). Preliminary analyses using such a measure yielded results which were quali-tatively similar to those reported below. Given this similarity, we prefer total publications because the interpretation is more straightforward.
Table 1
COGEE data: variable definitions and summary statistics
Variable name Description Mean (standard deviation)
Research output
ALLPUB Total publications in first 6 years after 3.15 (3.69)
graduate school
TOP50J Publications in top 50 economics journals, 1.47 (2.17)
first 6 years after graduate school Post-training employment
ACPHD First job was in Academic/Ph.D. Sector 0.462 (0.500)
(0,1)
ACOTH First job was in Academic/Other Sector 0.256 (0.436)
(0,1)
NONAC First job was in Non-Academic Sector 0.282 (0.450)
(0,1) Graduate department characteristics
TIER1 Graduate of Tier 1 program (0,1) 0.342 (0.475)
TIER2 Graduate of Tier 2 program (0,1) 0.415 (0.494)
TIER3 Graduate of Tier 3 program (0,1) 0.098 (0.298)
FACPUB* Average faculty publications 2.99 (0.77)
STUDENTS* Number of graduate students in program 3.27 (0.88)
Early research experience
PRETOP Number of publications in top 50 0.090 (0.341)
economics journals prior to completing graduate school
PREPUB Number of publications prior to 0.376 (0.582)
completing graduate school
SUBMIT Submitted a paper for publication while in 0.282 (0.451)
graduate school
RA Worked as a research assistant while in 0.356 (0.481)
graduate school (0,1) Individual characteristics
COLSAT Mean SAT score of undergraduate Alma 1129 (151)
Mater
SCIENCE BS or MS in mathematics or science (0,1) 0.226 (0.419)
MATHDIS Level of mathematics used in dissertation 2.68 (1.27)
TTPROP Time (years) taken to complete approved 3.33 (1.39)
dissertation proposal
MALE Male (0,1) 0.889 (0.315)
AGE Age at time of Ph.D. 28.8 (2.810)
KIDS Had children at time of Ph.D. (0,1) 0.222 (0.416)
Notes: Number of observations5238. *Source:Jones et al. (1982).
4.2.2. Post-training employment characteristics The employment settings in which economists work can be characterized in several ways. The first and most obvious cut is to distinguish academic from non-aca-demic jobs. We further divide the acanon-aca-demic sector into two categories: jobs at universities granting Ph.D.s in economics are defined to be in the “Academic/Ph.D.” sector, while those in other universities and in exclus-ively undergraduate institutions are defined as being in the “Academic/Other” sector. While some heterogeneity remains in each group, we do not attempt a finer categor-ization because of our small sample size and limited data on job characteristics.
4.2.3. Graduate department characteristics
We measure departmental reputation using the quality tiers described above. The average number of publi-cations by the department’s faculty is used as an additional measure of program quality. A third graduate program characteristic is the size of the program, meas-ured by the number of students.8
4.2.4. Early research experience
If considerable practice in conducting research facili-tates future research performance, then students who gain early research experience should be more likely to produce acceptable dissertations within reasonable time limits and to become more successful researchers after receiving their Ph.D.s. The COGEE survey data provide several indicators of such experience. One important source of early research experience is work as a research assistant. As apprenticeships of sorts, these opportunities may give students an improved understanding of the research process and, in some cases, will directly lead to collaborative work.
We also expect individuals who submitted papers for publication prior to completing their Ph.D.s would be more productive after doing so. The variable SUBMIT equals 1 if the individual submitted a paper for publi-cation while in graduate school. The JEL/ELI data allow us to construct two additional measures of pre-Ph.D. research experience. The variable PREPUB represents the number of publications prior to leaving graduate school. PRETOP is the number of publications in top 50 economics journals during that same time period.9
4.2.5. Individual characteristics
To estimate the effect of early research experience on post-Ph.D. publications, it seems desirable to condition on individual aptitude. If research assistantships are given to the best students in a department, then without adequate controls for ability, we would overstate the true impact of the experience gained in such positions. Simi-larly, we expect that individuals who submit papers for publications while in graduate school will have a greater than average interest in and aptitude for research.
The COGEE survey provides information on where each respondent received his or her baccalaureate degree. We construct a variable equaling the average SAT score from the individual’s undergraduate Alma Mater.10
Two additional variables are included to assess the plausibility of the common perception that mathematical ability is highly correlated with success in economics graduate programs and in the profession more generally.
9Note that a positive value for either of these publication measures does not imply that SUBMIT equals 1, because these articles may have been written prior to entering graduate school. Similarly, SUBMIT5 1 does not imply a positive value for either PREPUB or PRETOP, because not all articles submitted as a graduate student will be published prior to leaving graduate school, if at all.
10The survey asked respondents to report their graduate rec-ord examination scores, but a high rate of non-response for this question keeps us from using this information. The source of the SAT data is Barron’s Guide to Colleges (1990). For non-U.S. B.A.s we impute this variable using the average for the individual’s graduate program.
SCIENCE is a dichotomous variable equal to one for all persons with a B.S. or M.S. in mathematics, science, or engineering, and equal to 0 otherwise. The variable MATHDIS is a self-report (using a five point scale) of the level of mathematics used in the dissertation (Hansen, 1991, pp. 1073–1075).
A time line reported by COGEE survey respondents allows us to observe the time it took each individual to progress through the graduate program. The variable TTPROP measures the length of time from entering the program until the completion of an approved dissertation proposal. We choose this measure over time-to-degree because the latter is not independent of an individual’s experience on the job market or his first job. We expect individuals who take longer to get to the dissertation stage will tend to be less productive after receiving their degrees.
Some demographic variables are also included in the analysis — age at time of degree, the presence of depen-dent children at time of degree, and gender.11 We also
have data on dissertation field as categorized according to the JEL classification scheme.
5. Descriptive analysis
5.1. Publication patterns over time: the COGEE sample and the population
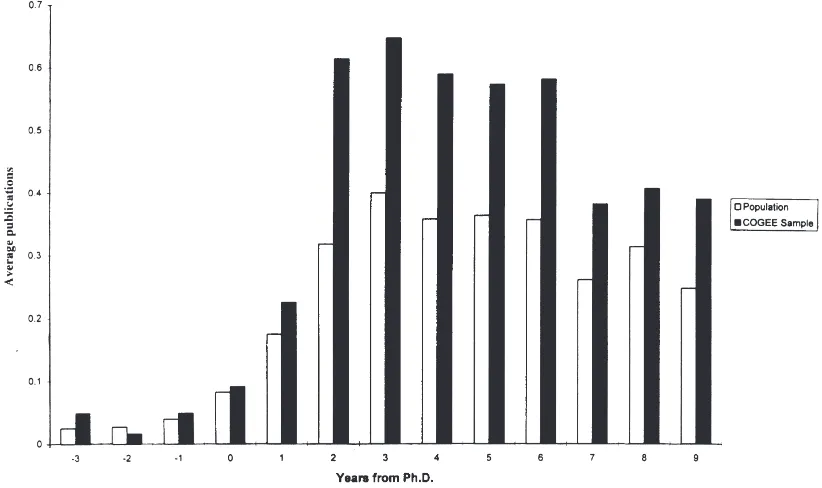
We begin our empirical analysis with a description of the publishing patterns over time for the entire 1977–78 cohort of Ph.D. economists and for the members of the COGEE sample from that cohort. While only the COGEE data contain the respondent attribute infor-mation used in the multivariate analysis discussed in Section 6, it is nonetheless of interest to document the pattern of early career publications for the entire popu-lation. If nothing else, Fig. 1 provides an indication of how our sample compares to the population in terms of total publications.
We focus on the 1977–78 cohort because doing so allows us to consider a longer time series. At the time publications data were collected for the COGEE project, 9 years of post-Ph.D. data were available for the 1977– 78 cohort, compared with 4 years for the 1982–83
Fig. 1. Average number of publications per year — all publications — for the 1977–78 population and COGEE sample. h 5 Population;j5COGEE sample.
cohort. Our subsequent analysis of the COGEE sample distinguishes between publications prior to and after the year in which the individual takes the first job, rather than receives the Ph.D. It is not possible, however, to observe the year in which each member of the population of 1977–78 Ph.D.s takes his or her first job. Thus, Fig. 1 uses the year of the Ph.D. as the benchmark.
Publications prior to the year of Ph.D. are quite rare.12
For the population, total publications increase steadily for the first three years after receipt of the Ph.D., drop slightly and remain fairly constant in years 4, 5, and 6, and then decline. In all post-Ph.D. years, members of the COGEE sample publish more than the average cohort member, though the temporal patterns of publications are quite similar.
5.2. Publications across graduate program tiers and employment sectors
The relationship among graduate training, initial job placement, and subsequent publications is complex. Before investigating the marginal effects of factors such as early research experience and personal characteristics,
12Because some subsequent publications were undoubtedly accepted and near publication when degrees were received, this measure understates pre-Ph.D. research output.
it is useful to establish and analyze two stylized facts. The first is that graduates of highly ranked programs publish more than graduates of other programs. The second is that post-Ph.D. publications are related to an economist’s occupational setting, with economists at research universities publishing more than those in other academic and non-academic positions.
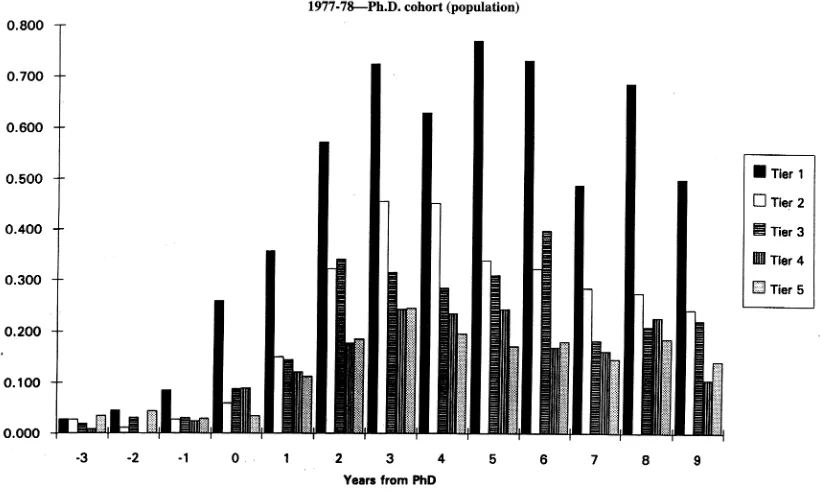
Since we can identify the Ph.D. granting department of each member of the population, we can use the entire population to investigate the first stylized fact. Fig. 2 describes the publications records of the entire 1977–78 cohort by graduate program tier. With some exceptions, the pattern across tiers is as expected. In each year, Tier 1 graduates have more publications than do graduates in any other tier. In most years after receiving the Ph.D., Tier 2 graduates publish more than Tier 3 graduates, though over the entire time period the differences between these two tiers are small. Not surprisingly, graduates of programs in Tiers 4 and 5 have the lowest publication rates, though the relationship between the two varies from year to year.
Fig. 2. Average number of publications by graduate program tier — all publication — for 1977–78 Ph.D. cohort (population).
Table 2
Publications and first job placement by graduate department tier: COGEE sample
Tier 1 Tier 2 Tier 3 Tiers 4,5
Publications
Percentage publishing 1 70.0% 80.4% 78.3% 67.6%
or more articles
Total publications 3.7 (4.7) 3.2 (3.1) 3.3 (3.3) 1.8 (2.2)
Percentage publishing 1 50.0% 56.7% 65.2% 50.0%
or more in top 50 journals
Total top 50 publications 1.9 (2.9) 1.4 (1.7) 1.4 (1.7) 0.6 (1.1)
Job placement (percentage distribution)
Academic/Ph.D. 57.5% 45.4% 56.5% 14.7%
Academic/other 16.3 24.7 30.4 47.1
Non-academic 26.3 29.9 13.0 38.2
N 80 97 23 34
Note: Standard deviations in parentheses.
Ph.D.). An additional minor difference is that Tiers 4 and 5 are combined because of small cell sizes.
The average number of publications is highest for recipients of Tier 1 Ph.D.s, despite the fact that Tier 1 does not have the highest percentage of graduates pub-lishing at least 1 article. Graduates of Tier 2 and 3 pro-grams have similar publication records; for some meas-ures the Tier 2 mean is higher, for others the Tier 3 mean
is higher. Tiers 4 and 5 are lower than the others on all four publication measures reported in Table 2.
Table 3
COGEE sample publications by employment sector
Academic/Ph.D. Academic/other Non-Academic
Percentage publishing 1 or 84.3% 70.0% 63.6%
more articles
Total publications 4.3 (4.3) 2.1 (2.6) 2.3 (3.0)
Percentage publishing 1 or 67.6% 45.0% 34.8%
more in top 50 journals
Total top 50 publications 2.3 (2.7) 0.8 (1.2) 0.8 (1.4)
N 108 60 66
Note: Standard deviations in parentheses.
roughly 57 percent of their graduates in the Academic/Ph.D. sector, whereas Tier 2 programs place 45 percent. Tiers 4 and 5 have the lowest placement rate in the Academic/Ph.D. sector (15 percent) and the high-est placement rate in the Non-Academic sector (38 percent).
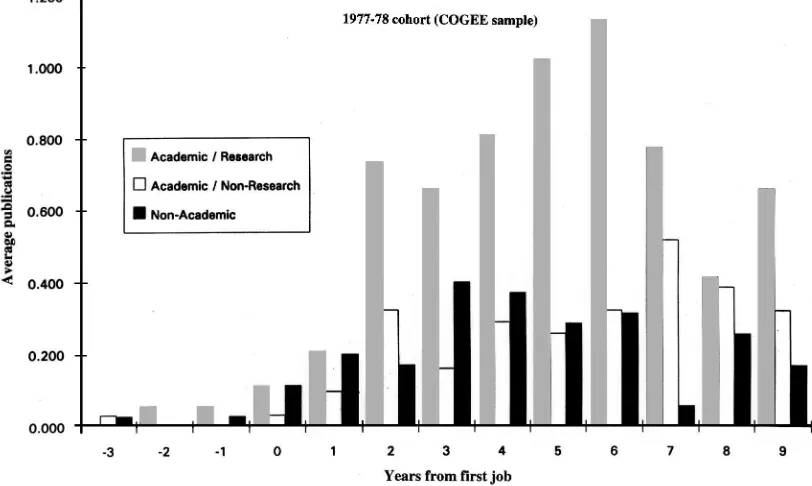
The connections between publications and employ-ment are described in Table 3 and in Fig. 3. Ph.D. econ-omists in the Academic/Ph.D. sector publish more than their counterparts in the other two sectors. For all four measures reported in Table 3, differences between the Academic/Ph.D. sector and the other two sectors com-bined are statistically significant at theP50.01 level.
The small differences in publication rates between the Non-Academic and Academic/Other sectors are not stat-istically significant at conventional levels. Similarly, Fig.
Fig. 3. Average publications by employment sector — all publications — for 1977–78 cohort (COGEE sample).
3 shows that economists in the Academic/Ph.D. sector publish successively more each year through year six, whereas the patterns for the other two sectors are more erratic. Given these patterns and our small sample size, we define just two sectors of employment — the Academic/Ph.D. sector and the other two sectors com-bined — in the remainder of our analysis.
6. Regression results
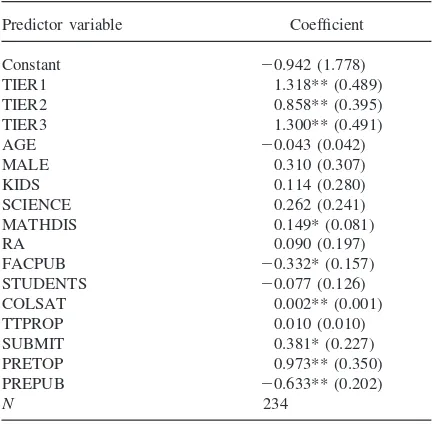
6.1. Employment sector probit results
gradu-ate program reputation and job placement evident in Table 3 resurfaces in the probit results reported in Table 4. Students in Tiers 4 and 5 are significantly less likely than students in higher-ranked programs to obtain jobs in the Academic/Ph.D. sector. Differences among Tiers 1, 2, and 3 are not statistically significant. One puzzling finding is that the average number of faculty publications has a negative estimated effect on placement in the Academic/Ph.D. sector.
The coefficients on the ability proxies may represent an effect ofobservedquality in the presence of queuing for jobs in this sector. Having gone to a college with a high average SAT score significantly increases the prob-ability of sorting into the Academic/Ph.D. sector. Because of measurement error (this variable is imputed for non-U.S. B.A.s) this coefficient is likely biased toward zero. The finding of a positive and significant (at theP50.10 level) coefficient on MATHDIS is
compat-ible with both the conventional wisdom that graduate departments have a preference for hiring more math-ematically-oriented job candidates and the dissatisfaction expressed by small college departments and non-aca-demic employers about the highly mathematical orien-tation of recent Ph.D.s (Hansen, 1991, p. 1085). The coefficient on SCIENCE is also positive, but not signifi-cant.
The coefficients on the indicators of early research experience reveal an interesting pattern. Submitting a paper for publication while a graduate student
Table 4
Employment sector probit results
Predictor variable Coefficient
Constant 20.942 (1.778)
TIER1 1.318** (0.489)
TIER2 0.858** (0.395)
TIER3 1.300** (0.491)
AGE 20.043 (0.042)
MALE 0.310 (0.307)
KIDS 0.114 (0.280)
SCIENCE 0.262 (0.241)
MATHDIS 0.149* (0.081)
RA 0.090 (0.197)
FACPUB 20.332* (0.157)
STUDENTS 20.077 (0.126)
COLSAT 0.002** (0.001)
TTPROP 0.010 (0.010)
SUBMIT 0.381* (0.227)
PRETOP 0.973** (0.350)
PREPUB 20.633** (0.202)
N 234
Notes: Dependent variable (ACPHD) 5 1 if first job is in Academic/Ph.D. sector. Standard errors in parentheses. Model also includes eight dummy variables for field of dissertation. ** significant atP50.05 level; *significant atP50.10 level.
(SUBMIT) is positively related to selection into the Academic/Ph.D. sector. The effect of prior publications in a top 50 journal — measured by the sum of the coef-ficients on PRETOP and PREPUB — is also positive, though not statistically significant. The negative coef-ficient on PREPUB implies that individuals with prior publications in lesser ranked journals are more likely to take jobs in the Non-Academic or Academic/Other sec-tors, all else equal. The explanation for this latter result may have to do with the nature of their research. To the extent that these articles address a non-academic audi-ence, the authors may prefer to continue to do such research in a non-academic setting. Conditional on other attributes, we find no significant effect of gender on employment sector selection. McMillen and Singell (1994) report a similar finding.
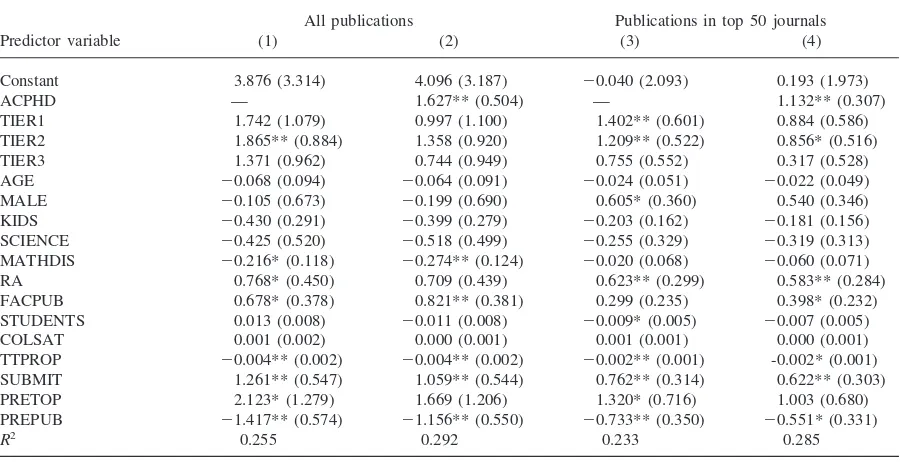
6.2. Publications regressions
The results from several publications regressions are reported in Table 5. Separate equations are estimated for all publications (columns 1 and 2) and those in top 50 journals (columns 3 and 4). The specifications in col-umns 1 and 3 do not use employment sector as a predic-tor variable; the other two columns include an indicapredic-tor variable for individuals whose first job was in the Academic/Ph.D. sector.
Consider first the estimates for the models without the job placement variable. Conditional on other factors, graduates of programs in Tiers 1 and 2 (i.e. top 10 programs) are predicted to have 1.4 to 1.9 more publi-cations (and 0.8 to 1.4 more top 50 publipubli-cations) than their counterparts from Tiers 4 and 5. Our finding that graduates of programs with highly productive faculties (as indicated by both tier and faculty publications) are more productive themselves replicates that of Hogan (1981).
Research exposure gained as a research assistant (RA) is positively associated with post-Ph.D. publications. Ceteris paribus, former RAs are predicted to have 0.77 more articles (0.63 in top journals) than individuals who were not RAs. Submitting a paper for publication while still in graduate school is also positively related to publi-cations after leaving graduate school.
The coefficients on the two measures of prior publi-cations have the same pattern as in the job placement equation: the coefficient on PRETOP is positive and slightly larger in magnitude than that on PREPUB, which is negative. Their sum is not statistically different from zero using a two-tailed test. This pattern implies that individuals with prior publications in other than the top 50 journals have lower than average publication rates after leaving graduate school. Again, this result may reflect the choice of a career where one’s research is directed primarily to a non-academic audience.
Table 5
Publication regression results
All publications Publications in top 50 journals
Predictor variable (1) (2) (3) (4)
Constant 3.876 (3.314) 4.096 (3.187) 20.040 (2.093) 0.193 (1.973)
ACPHD — 1.627** (0.504) — 1.132** (0.307)
TIER1 1.742 (1.079) 0.997 (1.100) 1.402** (0.601) 0.884 (0.586)
TIER2 1.865** (0.884) 1.358 (0.920) 1.209** (0.522) 0.856* (0.516)
TIER3 1.371 (0.962) 0.744 (0.949) 0.755 (0.552) 0.317 (0.528)
AGE 20.068 (0.094) 20.064 (0.091) 20.024 (0.051) 20.022 (0.049)
MALE 20.105 (0.673) 20.199 (0.690) 0.605* (0.360) 0.540 (0.346)
KIDS 20.430 (0.291) 20.399 (0.279) 20.203 (0.162) 20.181 (0.156)
SCIENCE 20.425 (0.520) 20.518 (0.499) 20.255 (0.329) 20.319 (0.313)
MATHDIS 20.216* (0.118) 20.274** (0.124) 20.020 (0.068) 20.060 (0.071)
RA 0.768* (0.450) 0.709 (0.439) 0.623** (0.299) 0.583** (0.284)
FACPUB 0.678* (0.378) 0.821** (0.381) 0.299 (0.235) 0.398* (0.232)
STUDENTS 0.013 (0.008) 20.011 (0.008) 20.009* (0.005) 20.007 (0.005)
COLSAT 0.001 (0.002) 0.000 (0.001) 0.001 (0.001) 0.000 (0.001)
TTPROP 20.004** (0.002) 20.004** (0.002) 20.002** (0.001) -0.002* (0.001)
SUBMIT 1.261** (0.547) 1.059** (0.544) 0.762** (0.314) 0.622** (0.303)
PRETOP 2.123* (1.279) 1.669 (1.206) 1.320* (0.716) 1.003 (0.680)
PREPUB 21.417** (0.574) 21.156** (0.550) 20.733** (0.350) 20.551* (0.331)
R2 0.255 0.292 0.233 0.285
Notes: Sample size5234. General-heteroscedasticity-corrected standard errors in parentheses. Each model also includes eight indi-cator variables for dissertation field. **Significant atP50.05 level; *significant atP50.10 level.
requirements, as measured by the time from entry to approved proposal, tend to be less productive after com-pleting graduate school. The coefficient on TTPROP implies that an additional year spent completing a pro-posal corresponds to 0.4 fewer articles. This result is interesting in light of the concern expressed by the COGEE panel about observed increases in the average time-to-degree among economics Ph.D.s (Krueger et al., 1991). Since we consider TTPROP as a proxy for indi-vidual aptitude, we do not attach causal significance to this result. That is, it does not imply that graduate depart-ments can make their graduates more productive by rush-ing their students through the program. However, this result does have important implications for both graduate faculty and employers, as it suggests that the speed at which students progress through a program is one predic-tor of their future publications success.
When we add the initial job placement variable (columns 2 and 4), we find that economists employed at research universities are predicted to have 1.6 more publications (1.1 more in top journals) than are other economists. As noted, this result may reflect sector-spe-cific differences in research resources, constraints, and incentives, as well as the sorting of individuals with strong publishing prospects into the Academic/Ph.D. sec-tor.13Conditional on job placement and other variables,
13To the extent that there is a quality–quantity tradeoff in the production of articles and the returns to article quality are
the estimated coefficients on TIER1 and TIER2 are now smaller and no longer significantly different from zero.
7. Implications and conclusions
The literature on the determinants of individual research productivity has stressed the importance of dis-tinguishing between the direct effect of any independent variable and the indirect effect working through job placement. Our results confirm the importance of taking indirect effects into account. Specifically, we find that Ph.D. economists employed in what we define as the Academic/Ph.D. sector (i.e. those teaching in research universities) have substantially higher rates of early career publications than do their counterparts in other employment settings. This difference presumably reflects disparities across the sectors in productivity-enhancing resources, time constraints, and incentives, as well as unobserved (to us) characteristics that are correlated with job placement. It is also important to reiterate that our data are limited to journal publications and book chap-ters, so we do not count research output taking the form of reports and monographs published by government
agencies, think tanks, and private research/consulting firms.
According to the AEA’s Committee on Graduate Edu-cation in Economics, a major problem with economics graduate programs is that most Ph.D. students receive very little early research experience or exposure (Hansen, 1991, pp. 1078–9). Our main interest in under-taking this analysis was to investigate whether and how early research experience as a graduate student contrib-utes to publishing proficiency after leaving the graduate program. While several studies examine the determinants of research output in economics and other fields, they lack sufficient information on research experience gained as a graduate student to answer this question.
Our results indicate that research experience obtained as a graduate student is a positive predictor of subsequent research productivity. Publications and submissions prior to leaving graduate school increase the probability of being employed at a research university where pro-ductivity is higher. Conditional on employment sector, such experiences as having been a research assistant, having submitted a paper for publication, and/or having graduated from a program with a highly productive fac-ulty increase predicted research output.
To the extent the relationships we estimate represent true causal effects, our results indicate that economics graduate programs would serve students well by provid-ing more financial assistance in the form of research assistantships and generally encouraging early research exposure. One caveat, however, is that a substantial por-tion of Ph.D. students and recent Ph.D.s did not rate their experience as research assistants highly in terms of pre-paring them for dissertation research (Hansen, 1991, p. 1078). It could be that being a research assistant helped students learn how to do research, even if it did not help them do their dissertation research. Or, it could be that some RA positions are better than others. More study is needed on what types of research positions are best for imparting research skills.
Readers should be cautioned not to accept our esti-mated coefficients as structural parameters. While our measures of individual ability and aptitude are better than those used in other studies, they are nonetheless limited. If more able students are tapped to be research assistants and/or are more likely submit papers for publi-cation while still in school, our measures of early research experience may be picking up the effects of unobserved ability. Likewise, individuals who have less interest in research may choose teaching assistantships over research assistantships and subsequently may choose post-Ph.D. jobs that require less research. How-ever, even if our key regressors are picking up only the effect of individual heterogeneity, our results remain rel-evant to employers of Ph.D. economists who wish to assess the publications potential of job applicants.
Acknowledgements
This research was undertaken under the auspices of the American Economic Association’s Commission on Graduate Education in Economics. Support from the National Science Foundation, the Mellon Foundation, and the Sloan Foundation is gratefully acknowledged.
References
Barron’s Guide to Colleges (1990) Barron’s Educational Series, College Division, Woodbury, NY.
Blank, R.M., 1991. The effect of double-blind versus single-blind reviewing — experimental evidence from the Amer-ican Economic Review. AmerAmer-ican Economic Review 81 (5), 1041–1067.
Broder, I.E., 1993. Professional achievements and gender dif-ferences among academic economists. Economic Inquiry 31 (1), 116–127.
Cameron, A.C., Trivedi, P.K., 1986. Econometric models based on count data: comparisons and applications of some esti-mators and tests. Journal of Applied Econometrics 1 (1), 29–53.
Cartter A. (1966)An Assessment of Quality in Graduate Edu-cation. American Council on Education, Washington, DC. Ekwurzel, D., Saffran, B., 1985. Online information retrieval
for economists — The Economics Literature Index. Journal of Economic Literature 23 (4), 1728–1763.
Ferber, M., Teiman, M., 1980. Are women economists at a dis-advantage in publishing journal articles? Eastern Economics Journal 63 (August–October), 89–93.
Fish, M., Gibbons, J.D., 1989. A comparison of the publications of female and male economists. Journal of Economic Edu-cation 1, 93–105.
Goodwin, T.H., Sauer, R.D., 1995. Life cycle productivity in academic research: evidence from cumulative publication histories of academic economists. Southern Economic Jour-nal 61 (3), 728–743.
Hansen, W.L., Weisbrod, B.A., Strauss, R.P., 1978. Modeling the earnings and research productivity of academic econom-ists. Journal of Political Economy 86 (4), 729–741. Hansen, W.L., 1990. Educating and training new economics
Ph.D.s: how good a job are we doing? American Economic Review 80 (2), 437–444.
Hansen, W.L., 1991. The education and training of economics doctorates: major findings of the commission on graduate education in economics. Journal of Economic Literature 29 (3), 1054–1094.
Hanushek, E.A., 1986. The economics of schooling: production and efficiency in public schools. Journal of Economic Literature 24 (3), 1141–1177.
Hogan, T.D., 1981. Faculty research activity and the quality of graduate training. Journal of Human Resources 16 (3), 400–415.
Jones, L. V., Lindzay, G. and Coggeshall, P. E. eds, (1982)An assessment of research — doctoral programs in the United States: social sciences. National Academy Press, Wash-ington, DC.
education in economics. Journal of Economic Literature 29 (3), 1035–1053.
Leibowitz, S.J., Palmer, V.P., 1984. Assessing the relative impacts of economics journals. Journal of Economic Litera-ture 22, 77–88.
Levin, S.G., Stephan, P.E., 1991. Research productivity over the life cycle: evidence for academic scientists. American Economic Review 81 (1), 114–132.
Long, J.S., 1978. Productivity and academic position in the scientific career. American Sociological Review 43, 889– 908.
Long, J.S., McGinnis, R., 1981. Organizational context and scientific productivity. American Sociological Review 46, 422–442.
McDowell, J.M., Smith, J.K., 1992. The effect of gender-sorting on the propensity to coauthor: implications for academic promotion. Economic Inquiry 30 (1), 68–82.
McMillen, D.P., Singell, L.D., 1994. Gender differences in first jobs for economists. Southern Economic Journal 60 (3), 701–714.
Newey, W.K., 1985. Generalized method of moments specifi-cation testing. Journal of Econometrics 29 (3), 229–256. Sauer, R., 1988. Estimates of the returns to quality and