GEOMETRIC POINT QUALITY ASSESSMENT FOR THE AUTOMATED,
MARKERLESS AND ROBUST REGISTRATION OF UNORDERED TLS POINT CLOUDS
M. Weinmann, B. Jutzi
Institute of Photogrammetry and Remote Sensing, Karlsruhe Institute of Technology (KIT) Englerstr. 7, 76131 Karlsruhe, Germany -{martin.weinmann, boris.jutzi}@kit.edu
Commission III, WG III/2
KEY WORDS:Laser scanning, TLS, point cloud, imagery, filtering, feature extraction, matching, registration
ABSTRACT:
The faithful 3D reconstruction of urban environments is an important prerequisite for tasks such as city modeling, scene interpretation or urban accessibility analysis. Typically, a dense and accurate 3D reconstruction is acquired with terrestrial laser scanning (TLS) systems by capturing several scans from different locations, and the respective point clouds have to be aligned correctly in a common coordinate frame. In this paper, we present an accurate and robust method for a keypoint-based registration of unordered point clouds via projective scan matching. Thereby, we involve a consistency check which removes unreliable feature correspondences and thus increases the ratio of inlier correspondences which, in turn, leads to a faster convergence of the RANSAC algorithm towards a suitable solution. This consistency check is fully generic and it not only favors geometrically smooth object surfaces, but also those object surfaces with a reasonable incidence angle. We demonstrate the performance of the proposed methodology on a standard TLS benchmark dataset and show that a highly accurate and robust registration may be achieved in a fully automatic manner without using artificial markers.
1 INTRODUCTION
The faithful 3D reconstruction of urban environments represents a topic of great interest in photogrammetry, remote sensing and computer vision, as it provides an important prerequisite for ap-plications such as city modeling, scene interpretation or urban ac-cessibility analysis. While a variety of devices allows for acquir-ing an appropriate representation of object surfaces in the form of 3D point cloud data, terrestrial laser scanning (TLS) systems provide dense and accurate point cloud data for the local environ-ment and they may also reliably measure distances of several tens of meters. However, a TLS system is a line-of-sight instrument and hence occlusions resulting from objects in the scene may be expected as well as a significant variation in point density be-tween close and distant object surfaces. Consequently, multiple point clouds have to be acquired from different locations in order to obtain complete objects and full scene coverage. As the spa-tial 3D coordinates of each of these point clouds are only deter-mined w.r.t. the local coordinate frame of the sensor, all captured point cloud data have to be transferred into a common coordi-nate frame. This process is commonly referred to as point cloud registration, point set registration or 3D scan matching.
In this paper, we focus on keypoint-based point cloud registra-tion which has proven to be among the most efficient strategies for aligning pairs of overlapping scans. Generally, such keypoint-based point cloud registration approaches rely on (i) forward-projected 2D keypoints detected in either intensity or range im-ages, or (ii) 3D keypoints extracted from either the original point cloud data or a voxel-based subsampling in order to obtain an approximately homogeneous point density. For reasons of ef-ficiency and robustness, we exploit forward-projected 2D key-points and thereby take into account that not all of the detected correspondences between different scans are guaranteed to con-tain reliable 3D information. We explicitly address the latter is-sue by presenting a new measure for point quality assessment. This measure is fully generic and it not only favors geometrically smooth object surfaces, but also those object surfaces with a rea-sonable incidence angle which, in turn, efficiently handles unre-liable range measurements arising from large incidence angles.
In summary, we (i) present a new measure for assessing the qual-ity of scanned 3D points in a fully generic manner, (ii) explain the pros and cons of this measure in comparison to other alterna-tives, (iii) define a consistency check based on the new measure for filtering unreliable feature correspondences and (iv) demon-strate the significance of the consistency check for an efficient and robust registration of TLS point clouds.
After reflecting related work on point quality assessment, feature extraction and point cloud registration in Section 2, we explain our methodology in Section 3. Subsequently, in Section 4, we provide a theoretical consideration of the new measure for point quality assessment and briefly discuss the consequences for reli-able range measurements in this context. This is followed by a presentation of experimental results in Section 5 and a discussion of these results in Section 6. Finally, in Section 7, we provide concluding remarks and suggestions for future work.
2 RELATED WORK
In the following, we reflect the related work and thereby focus on how to quantify the quality of each range measurement (Section 2.1), how to extract suitable features (Section 2.2) and how to efficiently register TLS point clouds (Section 2.3).
2.1 Point Quality Assessment
For this reason, we purely focus on filtering raw point cloud data by exploiting the captured information. On the one hand, a sim-ple approach for filtering may be based on the measured intensity information (Barnea and Filin, 2007), since very low intensity values are likely to correspond to unreliable range measurements. On the other hand, it seems advisable to filter points at depth dis-continuities as these exhibit the largest distance error. A respec-tive filtering may for instance be achieved by involving the scan line approximation technique (Fuchs and May, 2008), by apply-ing the Laplacian operator on the range image (Barnea and Filin, 2008) or by considering the standard deviation of range values within a local patch of the range image (Weinmann and Jutzi, 2011). Accounting for both intensity and range information, the combination of removing points with low values in the intensity image as well as points at edges in the range image has been proposed in order to obtain an adequate 3D representation of a scene (Swadzba et al., 2007). Furthermore, it seems to be advis-able to take into account that the scanning geometry w.r.t. the incidence angle (i.e.the angle between incoming laser beam and surface normal) may have a significant influence on the accuracy of a range measurement which becomes visible by an increase in measurement noise with increasing incidence angles (Soudaris-sanane et al., 2011). Accordingly, it seems to be desirable to have a common and generic measure which considers reliability in terms of both object edges and incidence angle.
2.2 Feature Extraction
Nowadays, the most accurate alignment of TLS data is still ob-tained via manipulating the observed scene by placing artificial markers which represent clearly demarcated corresponding points in different scans. Thus, such markers may easily be extracted either manually or automatically (Akca, 2003; Franaszek et al., 2009). Even though a good quality of the registration process is ensured, this procedure may however be rather time-consuming – particularly for a large number of scans – and it hence often tends to be intractable. Consequently, a fully automated registration of scans without using artificial markers is desirable.
Generally, an automated procedure for point cloud registration may be based on the full point clouds and applying standard tech-niques such as the Iterative Closest Point (ICP) algorithm (Besl and McKay, 1992) or Least Squares 3D Surface Matching (Gruen and Akca, 2005) which exploit the spatial 3D information in or-der to minimize either the difference between point clouds or the distance between matched surfaces. Since these standard tech-niques typically result in a higher computational burden, it seems advisable to extract relevant information in the form of specific features from the point clouds in order to alleviate point cloud registration. Such relevant information may for instance be de-rived from the distribution of the points within each point cloud by using the normal distributions transform (NDT) either on 2D scan slices (Brenner et al., 2008) or in 3D (Magnusson et al., 2007). Furthermore, the detection of corresponding features may be based on specific 3D structures in the scene which can be characterized by geometric primitives such as planar structures (Brenner et al., 2008; Pathak et al., 2010; Theiler et al., 2012) and/or even more complex primitives such as spheres, cylinders and tori (Rabbani et al., 2007). Additionally, lines resulting from the intersection of neighboring planar structures or the boundary of a planar structure could be involved for the registration process (Stamos and Leordeanu, 2003). However, all these feature types representing specific geometric primitives encounter significant challenges in case of scene symmetry and they are not suited in scenes without regular surfaces.
Facing general scenes where we may not assume the presence of specific 3D shape primitives, the least assumptions are possible
when focusing on point-like features. Such features may for in-stance be based on geometric curvature or normal vectors of the local surface (Bae and Lichti, 2008), or on the application of in-terest point detectors in 3D space,e.g.via a 3D Harris corner de-tector or a 3D Difference-of-Gaussians (DoG) dede-tector (Theiler et al., 2013; Theiler et al., 2014). However, in order to increase computational efficiency and furthermore account for the fact that – due to the use of a line-of-sight instrument with a specific an-gular resolution – a significant variation of the point density may be expected, most of the proposed 3D interest point detectors are based on a voxelization of the scene and thus strongly depend on the selected voxel size.
Taking into account that the range information is acquired for points on a regular scan grid, we may easily derive an image rep-resentation in the form of range images and then extract interest points from these range images,e.g.by applying a min-max algo-rithm (Barnea and Filin, 2008), the Harris corner detector (Steder et al., 2009), the Laplacian-of-Gaussian (LoG) detector (Steder et al., 2010) or the Normal Aligned Radial Feature (NARF) de-tector (Steder et al., 2011). While the design of an interest point detector may principally also account for finding keypoints on geometrically smooth 3D surfaces, such approaches generally re-quire characteristic 3D structures in the scene which may not al-ways be that well-distributed in larger distances to the sensor.
Since modern scanning devices also allow to acquire intensity information on the discrete scan grid and thus intensity images which typically provide complementary information with a higher level of distinctiveness than range images (Seo et al., 2005), some approaches for point cloud registration involve features in the form of keypoints extracted from intensity images derived from reflectance data (Boehm and Becker, 2007; Wang and Brenner, 2008; Kang et al., 2009; Alba et al., 2011; Weinmann et al., 2011) or co-registered camera images (Al-Manasir and Fraser, 2006; Barnea and Filin, 2007; Wendt, 2007). The respective forward-projection of such 2D keypoints w.r.t. the corresponding range information allows to derive sparse point clouds of (almost) iden-tical 3D points and thus significantly alleviates point cloud regis-tration while improving computational efficiency.
2.3 Point Cloud Registration
Nowadays, most of the approaches for aligning pairs of over-lapping scans exploit a keypoint-based point cloud registration which has proven to be among the most efficient strategies. While it has recently been proposed to exploit the spatial arrangement of 3D keypoints for a geometrical constraint matching (Theiler et al., 2013; Theiler et al., 2014), still most investigations in-volve forward-projected 2D keypoints detected in image repre-sentations of the captured intensity or range information. This may be motivated by the fact that feature correspondences may easily and efficiently be derived by comparing keypoint descrip-tors. The forward-projection of corresponding 2D keypoints to 3D space, in turn, results in sparse point clouds which may for instance be aligned by estimating a standard rigid transforma-tion (Arun et al., 1987; Horn et al., 1988; Eggert et al., 1997). Since some feature correspondences might represent outliers, a robust estimation by involving the RANSAC algorithm (Fischler and Bolles, 1981) is typically exploited (Seo et al., 2005; Boehm and Becker, 2007; Barnea and Filin, 2007).
and thus for the registration of TLS scans, a more efficient ap-proach has recently been proposed with keypoint-based projec-tive scan matching (Weinmann et al., 2011; Weinmann and Jutzi, 2011), where forward-projected 2D keypoints are back-projected onto the image plane of a virtual camera in order to derive 3D/2D correspondences which, in turn, serve as input for a registration scheme involving the Efficient-Perspective-n-Point (EPnP) algo-rithm (Moreno-Noguer et al., 2007) and the RANSAC algoalgo-rithm (Fischler and Bolles, 1981), and this scheme delivers highly ac-curate registration results for coarse registration. Such a strategy not only involves 3D cues based on the point clouds, but also 2D cues based on imagery and hence the results for coarse and fine registration may partially be in the same range.
Finally, it may be desirable to derive a measure describing the similarity of different scans which may efficiently be exploited in order to automatically organize a given set of unorganized scans for a successive pairwise registration. This is particularly impor-tant for approaches relying on the use of range and intensity im-ages, since a higher overlap of considered scans results in a higher similarity and thus more feature correspondences which, in turn, increases the robustness of respective registration approaches. In this regard, it has been proposed to derive a topological graph, where the nodes represent the single scans and the edges describe their similarity,e.g.based on the number of matched lines deter-mined from the range information (Stamos and Leordeanu, 2003) or the number of point correspondences between respective inten-sity images (Weinmann and Jutzi, 2011). The smaller the weight of an edge, the smaller the overlap between the scans correspond-ing to the nodes connected by this edge. Thus, an appropriate scan order for a reliable successive pairwise registration may be derived via a minimum spanning tree (Huber and Hebert, 2003).
3 METHODOLOGY
Our proposed methodology for a pairwise registration of TLS scans consists of three components which are represented by point quality assessment (Section 3.1), feature extraction (Section 3.2) and point cloud registration (Section 3.3).
3.1 Point Quality Assessment
Generally, a filtering of raw point cloud data in terms of removing 3D points corresponding to unreliable range measurements may be based on intensity information (Barnea and Filin, 2007), since low intensity values typically indicate unreliable range measure-ments. However, such considerations do not account for edge effects where noisy range measurements are likely to occur al-though the respective intensity values might be reasonable. Hence, we focus on two strategies which are based on the geometric mea-sures of (i) range reliability and (ii) planarity for quantifying the quality of a range measurement.
3.1.1 Range Reliability: The first measure of range reliabil-ity (Weinmann and Jutzi, 2011) is motivated by the fact that a laser beam has certain physical dimensions. Thus, the projection of a laser beam on the target area results in a laser footprint,i.e.a spot with finite dimension, that may vary depending on the slope of the local surface and material characteristics (Vosselman and Maas, 2010). Consequently, if a measured 3D point corresponds to a footprint on a geometrically smooth surface, the captured range information is rather reliable when assuming Lambertian surfaces and reasonable incidence angles. However, at edges of objects, a footprint may cover surfaces at different distances to the sensor, and thus the captured range information is rather unre-liable. Even more critical are range measurements corresponding to the sky, since these mainly arise from atmospheric effects.
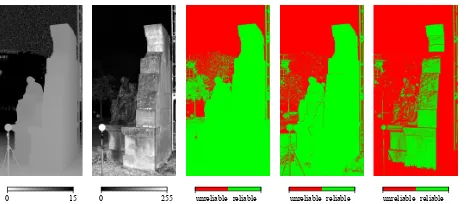
In order to remove unreliable range measurements – which typ-ically appear as noisy behavior in a point cloud – it has been proposed to quantify range reliability by considering a local im-age patch for each point on the regular 2D grid and assigning the standard deviationσr,3×3of all range values within a(3×3) im-age neighborhood to the respective center point. Derivingσr,3×3 for all pixels of the 2D representation yields a confidence map, and a simple thresholding is sufficient to distinguish reliable mea-surements from unreliable ones. More specifically, low values σr,3×3 indicate a 3D point on a smooth surface and are there-fore assumed to be reliable, whereas high valuesσr,3×3indicate noisy and unreliable range measurements. For the separation be-tween reliable and unreliable range measurements, a predefined thresholdtσ = 0.03. . .0.10m has been proposed (Weinmann and Jutzi, 2011). An example demonstrating the effect of such a point cloud filtering is given in Figure 1 for a part of a terrestrial laser scan which corresponds to2304×1135scanned 3D points and has been acquired with a Leica HDS6000 on the KIT campus in Karlsruhe, Germany. The suitability of such an approach has been demonstrated for data captured with a laser scanner (Wein-mann and Jutzi, 2011) and for data captured with a range camera (Weinmann et al., 2013), but the manual selection of a threshold based on prior knowledge on the scene represents a limitation.
3.1.2 Planarity: The second measure – which we propose in this paper – is motivated by the fact that reliable range informa-tion typically corresponds to almost planar structures in the scene. Consequently, we aim to quantify planarity for each pixel of the 2D representation by considering local image patches. In anal-ogy to the measure of range reliability, we consider(3×3)image neighborhoods as local image patches in order to assign a mea-sure of planarity to the respective center point. From the spatial XY Z-coordinates of all 3D points corresponding to the pixels in the(3×3)image neighborhood, we derive the 3D covariance matrix known as 3D structure tensorS∈R3×3
whose eigenval-uesλ1, λ2, λ3∈Rwithλ1 ≥λ2≥λ3≥0are further exploited in order to define the dimensionality features of linearityLλ, pla-narityPλand scatteringSλ(West et al., 2004):
Lλ=
λ1−λ2
λ1 Pλ=
λ2−λ3
λ1 Sλ=
λ3
λ1 (1)
These dimensionality features are normalized byλ1, so that they sum up to1and the largest value among the dimensionality fea-tures indicates the characteristic behavior assigned to the respec-tive pixel. Accordingly, a pixel represents a planar 3D structure and thus rather reliable range information if the constraint
Pλ,3×3:=Pλ≥max{Lλ, Sλ} (2)
is satisfied. Note that – in contrast to the measure of range reli-ability – this definition for relireli-ability is fully generic without in-volving any manually specified thresholds and thus prior knowl-edge on the scene. Some results when applying the proposed measure for point cloud filtering are illustrated in Figure 2.
0 15 0 255 0.01 40.00 log(0.01) log(40.00) unreliable reliable
Figure 1. Range image, intensity image, visualization of range reliability, logarithmic representation of range reliability and the binary confidence map derived by thresholding based on a man-ually selected threshold oftσ= 0.03m (from left to right).
measures retain adequate representations of local object surfaces. Whereas the strategy based on the measure of range reliability provides almost planar object surfaces for significantly varying incidence angles, the strategy based on the measure of planarity only provides almost perpendicular object surfaces with almost planar behavior and thus favors lower incidence angles which tend to yield more accurate range measurements (Figure 3).
3.2 Feature Extraction
Once we are able to quantify the quality of a range measure-ment, the next step consists of deriving correspondences between the respective scans. For this purpose, we consider the derived 2D image representations. As intensity images typically provide a higher level of distinctiveness than range images (Seo et al., 2005) and thus also contain information about the local environ-ment which is not represented in range images, it is advisable to involve these intensity images for finding corresponding informa-tion between different scans. Among a variety of visual features (Weinmann, 2013), local features seem to be favorable as they may be localized accurately with efficient feature detectors and as they remain stable for reasonable changes in viewpoint (Tuyte-laars and Mikolajczyk, 2008). Characterizing such a local feature by deriving a feature descriptor from the local image neighbor-hood even allows an individual identification of local features across different images. Thus, using local features has become very popular for a wide range of applications.
As one of the most powerful approaches for extracting local fea-tures, we apply the Scale Invariant Feature Transform (SIFT) (Lowe, 2004) on the intensity images. This yields distinctive key-points at 2D image locationsx ∈ R2
as well as the respective local descriptors which are invariant to image scaling and image rotation, and robust w.r.t. image noise, changes in illumination and reasonable changes in viewpoint. In order to reject ambigu-ous matches, the descriptors extracted for keypoints in different imagesIi andIjare not simply compared via their Euclidean distance, but via the ratio of the Euclidean distances of a descrip-tor belonging to a keypoint inIito the nearest neighbor and the second nearest neighbor inIj. A low value of this ratio indicates a high similarity to only one of the derived descriptors belong-ing toIj, whereas a high value indicates that the nearest and second nearest neighbor are quite similar. Consequently, the ra-tio describes the distinctiveness of the matched features, and it is selected to be below a certain thresholdtSIFT which is typically
chosen within the interval[0.6,0.8]for obtaining reliable feature correspondencesxi↔xjbetween imagesIiandIj.
3.3 Point Cloud Registration
Generally, the forward-projection of the extracted 2D keypoints w.r.t. the corresponding range information yields sparse point
0 1 0 1 0 1 1D 2D 3D unreliable reliable
Figure 2. Visualization for linearityLλ, planarityPλ, scattering
Sλ, the classification of each pixel according to its local behavior (linear: red; planar: green; scattered: blue) and the derived binary confidence map (from left to right).
0 15 0 255 unreliable reliable unreliable reliable unreliable reliable
Figure 3. Range image, intensity image and the derived binary confidence maps based on intensity, range reliability and pla-narity (from left to right).
clouds, where typically a high percentage of the detected fea-ture correspondences indicates physically (almost) identical 3D points. As SIFT features are localized with subpixel accuracy, the respective spatial information has to be interpolated from the information available for the regular and discrete 2D grid, e.g. by applying a bilinear interpolation. Instead of involving only 3D cues as for instance done when estimating a standard rigid transformation, we involve both 3D and 2D cues for keypoint-based point cloud registration in analogy to recent investigations on projective scan matching (Weinmann et al., 2011; Weinmann and Jutzi, 2011) as such a strategy provides both computational efficiency and robustness to outlier correspondences.
Without loss of generality, we may assume that – when consid-ering a scan pairPi ={Si,Sj}– the position and orientation of scan Si is known w.r.t. the world coordinate frame. Con-sequently, for scanSi, the respective forward-projection of 2D keypointsxi ∈ R2 results in 3D coordinatesXi ∈ R3 which are also known w.r.t. the world coordinate frame, whereas the forward-projection of 2D keypointsxj ∈R2results in 3D coor-dinatesXj∈R3which are only known w.r.t. the local coordinate frame of the sensor for scanSj. The basic idea of projective scan matching consists of introducing 2D cues by back-projecting the 3D pointsXjonto a virtual image plane for which the projection model of a pinhole camera is exploited (Weinmann et al., 2011):
x∗
j=K [R|t] Xj (3)
In this equation, the calibration matrix of the virtual camera is de-noted withKand arbitrary parameters may be selected for spec-ifying focal lengths and principal point (Weinmann et al., 2011; Weinmann and Jutzi, 2011). Furthermore, the rotation matrixR
and the translation vector tdescribe the relative orientation of the virtual camera w.r.t. the local coordinate frame of the laser scanner, and they are specified in a way that the virtual camera looks into the horizontal direction and that the position of the vir-tual camera coincides with the location of the laser scanner,i.e.
t=0. The pointsx∗
j ∈R
2
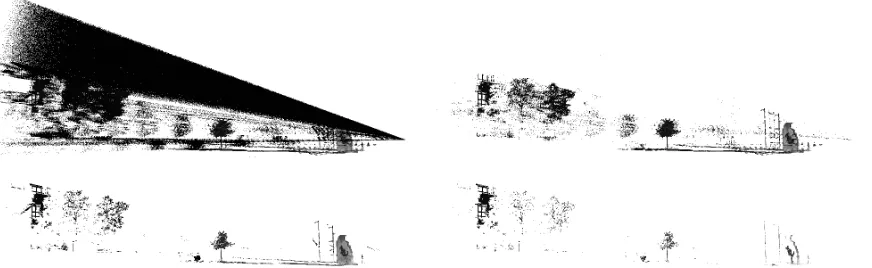
corre-Figure 4. Raw point cloud data (top left), point cloud data filtered via intensity information (top right), point cloud data filtered via the measure of range reliability (bottom left) and point cloud data filtered via the measure of planarity (bottom right).
spondencesXi,k↔x
∗
j,kand thus to relate the task of point cloud registration to the task of solving the well-known Perspective-n -Point (PnP) problem, where the aim is to estimate the exterior orientation or pose of a camera from a set ofncorrespondences between 3D pointsXi,kof a scene and their 2D projectionsx
∗
j,k in the image plane of a camera (Fischler and Bolles, 1981).
A robust approach for solving the PnP problem has been pro-posed with the Efficient Perspective-n-Point (EPnP) algorithm (Moreno-Noguer et al., 2007) which represents a non-iterative method and provides an accurate solution to the PnP problem with only linear complexity. Compared to other approaches for solving the PnP problem, this algorithm is not only fast and accu-rate, but also designed to work with a large number of correspon-dences and it does not require an initial estimate. The EPnP al-gorithm is based on the idea of expressing thenknown 3D scene pointsXi as a weighted sum of four virtual and non-coplanar control pointsCj∈R3for general configurations. Denoting the involved weights asαijand introducing a superscriptcwhich in-dicates coordinates in the camera coordinate frame, each 3D/2D correspondence provides a relation of the form
wi
xi
1
=K Xci =K
4
X
j=1
αijCcj (4)
whereKdescribes the calibration matrix, in our case the one of the virtual camera. Considering the respective three equations, the scalar projective parameterswican be determined according to the third equation and substituted into the other two equations. Concatenating the two modified equations fori= 1, . . . , nyields a linear equation systemM y=0, whereycontains the 3D co-ordinates of the four control pointsCj. For more details on the efficient solution of this equation system, we refer to the original paper (Moreno-Noguer et al., 2007). Once both world and cam-era coordinates of the 3D points are known, the transformation parameters aligning both coordinate frames can be retrieved via standard methods involving a closed-form solution in the least-squares sense (Horn et al., 1988; Arun et al., 1987).
For a robust estimation in case of existing outlier correspondences, the RANSAC algorithm (Fischler and Bolles, 1981) represents the method of choice as it eliminates the influence of outlier cor-respondences which are not in accordance with the largest con-sensus set supporting the given transformation model. Follow-ing the original implementation (Moreno-Noguer et al., 2007), the RANSAC-based EPnP scheme relies on selecting small, but not minimal subsets of seven correspondences for estimating the model parameters and checking the whole set of correspondences for consistent samples. In comparison to minimal subsets, this further reduces the sensitivity to noise. In order to avoid test-ing all possible subsets, which would be very time-consumtest-ing,
we exploit an efficient variant, where the number of iterations – which equals the number of randomly chosen subsets – is se-lected high enough, so that a subset including only inlier corre-spondences is selected with a certain probabilityp(Fischler and Bolles, 1981; Hartley and Zisserman, 2008).
Finally, we conduct a geometric outlier removal based on 3D dis-tances and an ICP-based fine registration (Weinmann et al., 2011; Wang and Brenner, 2008).
4 PLANARITY VS. RANGE RELIABILITY
In this section, we carry out theoretical considerations for the pro-posed measure of planarity and thereby point out consequences concerning what we may expect when applying this measure on range images. This is of utmost importance since we may thus easily explain the significant differences between the binary con-fidence maps depicted in Figure 1 and Figure 2.
In order to verify the suitability of the proposed measure of pla-narity, we consider fundamentals of projective geometry as for instance described in (Hartley and Zisserman, 2008). Generally, the 3D coordinates of a point X ∈ R3 on a ray in 3D space satisfy the constraintX = A+bv, whereA ∈ R3 denotes a known point on the ray,b ∈ Rrepresents a scalar factor and
v ∈ R3indicates the direction of the ray. Without loss of gen-erality, we may transfer this equation to camera coordinates as indicated by a superscriptc,i.e.Xc=Ac+bvc. Since – when assuming the model of a pinhole camera – the considered rays intersect each other at the projective center0c, we may use the pointAc = 0c = [0,0,0]T
as known point on all rays. Fur-thermore, we may exploit the definition of the camera coordinate frame (whereXcpoints to the right,Ycto the bottom andZcin depth). Looking along theZc
-axis and assuming an angular reso-lutionαof the camera, the directionsvcof the8neighboring rays which are exploited to obtain a local(3×3)image neighborhood can easily be derived by intersection with the(Zc = 1)-plane. Thus, we evaluate the geometric behavior of range measurements in a field-of-view given by(2α×2α).
For our example, we assume that the9defined rays characterizing a local(3×3)image neighborhood intersect a planeπwhich is parameterized in the camera coordinate frame by a pointXc
πand
a normal vectornc
π. Thereby, we define the pointX
c
πas the point
which results from the intersection ofπ with theZc-axis, and we further assume that the distance betweenXcπand0
c is given byd,i.e. Xc
π = [0,0, d]
T
. Initially, we consider the case of a normal vectorncπwhich coincides with theZ
c
-axis, and thus the planeπis parallel to theXcYc-plane. Subsequently, we rotate the planeπby an angleβaround the axis defined by the point
Xc
π= [0,0, d]
T
0 10 20 30 40 50 60 70 80 90
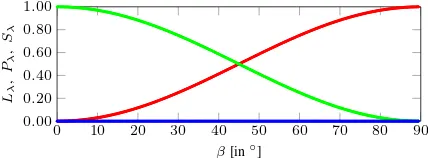
Figure 5. Behavior of the dimensionality features of linearityLλ (red), planarityPλ(green) and scatteringSλ(blue) for increasing incidence anglesβ. Note that the synthetic data is not corrupted with noise.
From the9points of intersection, we exploit the 3D coordinates in order to derive the 3D structure tensorSand its eigenvaluesλ1, λ2andλ3as well as the dimensionality features of linearityLλ, planarityPλand scatteringSλ(cf.Section 3.1.2). For an exam-ple which is close to the scenario when using a 3D range camera, we select the angular resolution toα = 0.2◦
and the distance between projective center andXc
πto d = 5m. The respective
values of the dimensionality features for anglesβ∈[0◦
,90◦
]are depicted in Figure 5, and they reveal that the locally planar 3D structure provides a planar behavior in the interval[0◦
,45◦
]and a linear behavior beyond this interval. As a consequence, range measurements are assumed to be reliable if the local(3×3) im-age neighborhood represents a locally planar 3D structure with an incidence angle in[0◦
,45◦
]. Note that, due to the narrow field-of-view of(2α×2α)for a local(3×3)image patch, noisy range measurementse.g.corresponding to the sky will not be indicated by a scattered behavior, but by a linear behavior since only a sig-nificant variation in ray direction will be present.
For a comparison to the measureσr,3×3of range reliability (cf. Section 3.1.1), we provide the respective behavior ofσr,3×3for the same example in Figure 6. The considered range values are represented by the distance between the projection center0cand those points resulting from the intersection of the defined rays with the planeπ, andσr,3×3is derived as the respective standard deviation of these range values. Applying the proposed threshold oftσ = 0.03m, range measurements are assumed to be reliable for incidence angles of less than about63.3◦
. A threshold of tσ = 0.10m even results in reliable range measurements up to incidence angles of about81.4◦
. Consequently, the binary con-fidence map shown in Figure 1 indicates more planar surfaces which are assumed to provide reliable range measurements than the binary confidence map depicted in Figure 2, where only pla-nar surfaces with incidence angles up to about45◦
are assumed to provide reliable range measurements.
5 EXPERIMENTAL RESULTS
For demonstrating the performance of our methodology, we in-volve a standard TLS benchmark dataset (Section 5.1) and de-scribe the conducted experiments as well as the respective results (Section 5.2).
5.1 Dataset
In order to allow a comparison of other approaches to our re-sults, we demonstrate the performance of our methodology on the Holzmarkt dataset which represents a publicly available TLS benchmark dataset1. This dataset has been acquired in an urban
environment with a Riegl LMS-Z360i laser scanner, and it con-sists of12upright and8tilted scans with given reference val-ues for the relative orientation. For our experiments, we use the
1The Holzmarkt dataset is available at
http://www.ikg.uni-hannover.de/index.php?id=413&L=de (accessed: 30 March 2015)
0 10 20 30 40 50 60 70 80 90
Figure 6. Behavior of the measureσr,3×3of range reliability for increasing incidence anglesβ. The applied threshold of0.03m is indicated with a red line. Note that the synthetic data is not corrupted with noise.
upright scans, where each scan covers360◦
in the horizontal di-rection and90◦
in the vertical direction with a single shot mea-surement accuracy of12mm and an angular resolution of0.12◦
up to a range of approximately200m (Wang and Brenner, 2008). Thus, each scan is represented by 2.25million 3D points at a regular scan grid of3000×750points. Since both range and in-tensity information are available for each point on the scan grid, 2D representations in the form of panoramic range and intensity images may easily be derived.
5.2 Experiments
First, we sort the scans w.r.t. their similarity in order to provide the basis for a successive pairwise registration. For this purpose, we exploit a minimum spanning tree based on the number of feature correspondences between the different intensity images (Weinmann and Jutzi, 2011). As a result, we obtain ordered scans Si. The whole procedure takes approximately607.04s for the given set of12scans on a standard desktop computer (Intel Core2 Quad Q9550,2.83GHz,8GB RAM, Matlab implementation).
Subsequently, we successively conduct pairwise registration via the RANSAC-based EPnP scheme and thereby involve the differ-ent methods for point quality assessmdiffer-ent for removing unreliable feature correspondences (tI = 10,tσ = 0.1m,tSIFT = 0.66).
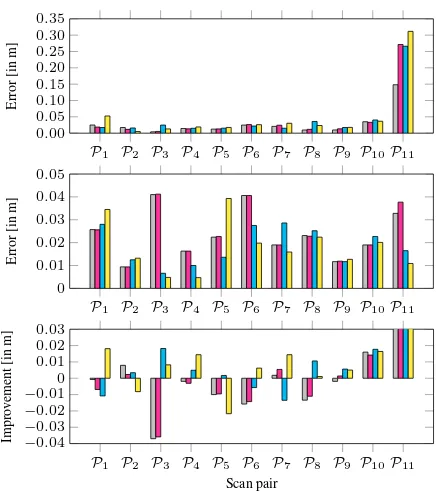
Since the random sampling may lead to slightly different esti-mates, we average all position and angle estimates over20runs. For the different scan pairsPi={Si,Si+1}withi= 1, . . . ,11, the remaining errors after coarse and fine registration are shown in Figure 7 as well as the achieved improvement. These results re-veal that already the step of coarse registration provides accurate position estimates, where the position error indicating the abso-lute deviation of the estimated scan position from the reference data is less than5cm for almost all cases. After fine registra-tion, the remaining position error is in the range between0.47cm and4.10cm. The respective angle errors are in the interval be-tween0.0001◦
and 0.2845◦
after coarse registration, and they are reduced to the interval between0.0002◦
and 0.0919◦
after fine registration.
In order to obtain an impression on the computational effort for pairwise registration, the mean processing times required for the different subtasks are listed in Table 1. Since those processing times for coarse registration vary significantly when involving different methods for point quality assessment, a respective vi-sualization is provided in Figure 8. Based on these numbers, in total, a processing time of191.35s may be expected in the worst case for a pairwise registration of the considered scans.
6 DISCUSSION
P1 P2 P3 P4 P5 P6 P7 P8 P9 P10P11
Figure 7. Mean position error after coarse registration (top), af-ter fine registration (cenaf-ter) and the respective improvement (bot-tom) for the scan pairsPi ={Si,Si+1}when applying no re-liability check (gray) and when applying rere-liability checks w.r.t. intensity (magenta), range reliability (cyan) or planarity (yellow).
Task Number of executions Processing time [in s] Point quality assessment 2
-Intensity <0.01
-Range Reliability 1.32
-Planarity 78.39
Feature extraction 2 8.77
Forward projection 2 0.17
Feature matching 1 0.21
Coarse registration 1 0.10. . .16.37
Outlier removal 1 <0.04
Fine registration 1 <0.07
Table 1. Required processing times for different subtasks of a pairwise registration.
the fact that the distance between the respective scans is about
4. . .6m for scan pairsP1, . . . ,P10, whereas it is almost12m for scan pairP11. Due to the significantly larger distance, the similarity between the respective intensity images becomes less and, consequently, the number of feature correspondences decays quickly compared to the other scan pairs. After fine registration, however, the remaining error for scan pairP11is reduced to the same range as for the other scan pairs, and this behavior also holds for the respective angle errors.
Concerning the involved methods for point quality assessment, the new measure of planarity does not always lead to an im-provement after fine registration (Figure 7, center). However, this may be due to the fact the accuracy after fine registration is quite close to the expected measurement accuracy of the scan-ning device (12mm). In this regard, it may be taken into ac-count that the RANSAC-based EPnP scheme involves both 3D and 2D cues, and thus already ensures a relatively reliable coarse registration compared to approaches only focusing on spatial 3D geometry, where the new measure may show a more significant improvement of the registration results. The main effect of the new method for point quality assessment thus consists of a sig-nificant speed-up in coarse registration (Figure 8), while causing additional costs in point quality assessment compared to the other methods (Table 1). The speed-up in coarse registration, in turn, is important since a fast solution corresponds to a reliable
esti-P1 P2 P3 P4 P5 P6 P7 P8 P9 P10P11
Figure 8. Mean processing times required for the coarse regis-tration of scan pairsPi={Si,Si+1}when applying no reliabil-ity check (gray) and reliabilreliabil-ity checks w.r.t. intensreliabil-ity (magenta), range reliability (cyan) or planarity (yellow).
mate of the relative orientation between two scans. More specif-ically, a filtering of feature correspondences based on the pro-posed measure of planarity represents a consistency check that – like specific modifications of RANSAC (Sattler et al., 2009) – results in a reduced set of feature correspondences, where the in-lier ratio is significantly increased which, in turn, leads to a faster convergence of the RANSAC algorithm towards a suitable solu-tion. Thereby, the generic consideration of incidence angles up to about45◦
(Section 4) imposes more restrictions than other recent investigations addressing an optimized selection of scan positions (Soudarissanane and Lindenbergh, 2011), where incidence angles up to70◦
are assumed to result in reliable range measurements.
7 CONCLUSIONS
In this paper, we have presented an accurate and robust method for a keypoint-based registration of unordered point clouds via projective scan matching. Thereby, robustness is preserved by involving a fully generic consistency check which removes unre-liable feature correspondences based on a common measure tak-ing into account the geometric smoothness of object surfaces and the respective incidence angle. As a consequence, the ratio of in-lier correspondences is increased which, in turn, leads to a faster convergence of the RANSAC algorithm towards a suitable solu-tion. The results clearly reveal that a highly accurate and robust registration may be achieved in a fully automatic manner with-out using artificial markers. For future work, it would be desir-able to compare different approaches for point cloud registration on a benchmark dataset and to point out pros and cons of these approaches in order to allow end-users to select an appropriate method according to their requirements. Furthermore, it might be advisable to introduce a weighting of feature correspondences which may principally be based on different constraints (Wein-mann et al., 2013; Khoshelham et al., 2013).
REFERENCES
Akca, D., 2003. Full automatic registration of laser scanner point clouds.
Optical 3-D Measurement Techniques VI, Vol. I, pp. 330–337.
Al-Manasir, K. and Fraser, C. S., 2006. Registration of terrestrial laser
scanner data using imagery. The Photogrammetric Record 21(115),
pp. 255–268.
Alba, M., Barazzetti, L., Scaioni, M. and Remondino, F., 2011. Auto-matic registration of multiple laser scans using panoramic RGB and
inten-sity images.The International Archives of the Photogrammetry, Remote
Sensing and Spatial Information Sciences, Vol. XXXIII-5/W12, pp. 49– 54.
Arun, K. S., Huang, T. S. and Blostein, S. D., 1987. Least-squares
fit-ting of two 3-D point sets. IEEE Transactions on Pattern Analysis and
Machine Intelligence9(5), pp. 698–700.
Bae, K.-H. and Lichti, D. D., 2008. A method for automated
registra-tion of unorganised point clouds.ISPRS Journal of Photogrammetry and
Remote Sensing63(1), pp. 36–54.
Barber, D., Mills, J. and Smith-Voysey, S., 2008. Geometric validation
of a ground-based mobile laser scanning system.ISPRS Journal of
Barnea, S. and Filin, S., 2007. Registration of terrestrial laser scans via
image based features.The International Archives of the Photogrammetry,
Remote Sensing and Spatial Information Sciences, Vol. XXXVI-3/W52, pp. 32–37.
Barnea, S. and Filin, S., 2008. Keypoint based autonomous registration
of terrestrial laser point-clouds. ISPRS Journal of Photogrammetry and
Remote Sensing63(1), pp. 19–35.
Besl, P. J. and McKay, N. D., 1992. A method for registration of 3-D
shapes.IEEE Transactions on Pattern Analysis and Machine Intelligence
14(2), pp. 239–256.
Boehler, W., Bordas Vicent, M. and Marbs, A., 2003. Investigating laser
scanner accuracy. The International Archives of the Photogrammetry,
Remote Sensing and Spatial Information Sciences, Vol. XXXIV-5/C15, pp. 1–6.
Boehm, J. and Becker, S., 2007. Automatic marker-free registration of
terrestrial laser scans using reflectance features. Optical 3-D
Measure-ment TechniquesVIII, pp. 338–344.
Bostr¨om, G., Gonc¸alves, J. G. M. and Sequeira, V., 2008. Controlled 3D
data fusion using error-bounds. ISPRS Journal of Photogrammetry and
Remote Sensing63(1), pp. 55–67.
Brenner, C., Dold, C. and Ripperda, N., 2008. Coarse orientation of
ter-restrial laser scans in urban environments.ISPRS Journal of
Photogram-metry and Remote Sensing63(1), pp. 4–18.
Eggert, D. W., Lorusso, A. and Fisher, R. B., 1997. Estimating 3-D rigid
body transformations: a comparison of four major algorithms. Machine
Vision and Applications9(5-6), pp. 272–290.
Fischler, M. A. and Bolles, R. C., 1981. Random sample consensus: a paradigm for model fitting with applications to image analysis and
auto-mated cartography.Communications of the ACM24(6), pp. 381–395.
Franaszek, M., Cheok, G. S. and Witzgall, C., 2009. Fast automatic reg-istration of range images from 3D imaging systems using sphere targets.
Automation in Construction18(3), pp. 265–274.
Fuchs, S. and May, S., 2008. Calibration and registration for precise
sur-face reconstruction with Time-of-Flight cameras. International Journal
of Intelligent Systems Technologies and Applications5(3/4), pp. 274–284.
Gruen, A. and Akca, D., 2005. Least squares 3D surface and curve
matching.ISPRS Journal of Photogrammetry and Remote Sensing59(3),
pp. 151–174.
Hartley, R. I. and Zisserman, A., 2008. Multiple view geometry in
com-puter vision. University Press, Cambridge, UK.
Hebert, M. and Krotkov, E., 1992. 3-D measurements from imaging laser
radars: how good are they? International Journal of Image and Vision
Computing10(3), pp. 170–178.
Horn, B. K. P., Hilden, H. M. and Negahdaripour, S., 1988. Closed-form
solution of absolute orientation using orthonormal matrices. Journal of
the Optical Society of America A5(7), pp. 1127–1135.
Huber, D. F. and Hebert, M., 2003. Fully automatic registration of
multi-ple 3D data sets.Image and Vision Computing21(7), pp. 637–650.
Kang, Z., Li, J., Zhang, L., Zhao, Q. and Zlatanova, S., 2009. Automatic registration of terrestrial laser scanning point clouds using panoramic
re-flectance images.Sensors9(4), pp. 2621–2646.
Khoshelham, K., Dos Santos, D. R. and Vosselman, G., 2013. Generation and weighting of 3D point correspondences for improved registration of
RGB-D data.ISPRS Annals of the Photogrammetry, Remote Sensing and
Spatial Information Sciences, Vol. II-5/W2, pp. 127–132.
Lichti, D. D. and Licht, M. G., 2006. Experiences with terrestrial laser
scanner modelling and accuracy assessment. The International Archives
of the Photogrammetry, Remote Sensing and Spatial Information Sci-ences, Vol. XXXVI-5, pp. 155–160.
Lichti, D. D., Gordon, S. J. and Tipdecho, T., 2005. Error models and propagation in directly georeferenced terrestrial laser scanner networks.
Journal of Surveying Engineering131(4), pp. 135–142.
Lowe, D. G., 2004. Distinctive image features from scale-invariant
key-points.International Journal of Computer Vision60(2), pp. 91–110.
Magnusson, M., Lilienthal, A. and Duckett, T., 2007. Scan registration for
autonomous mining vehicles using 3D-NDT. Journal of Field Robotics
24(10), pp. 803–827.
Moreno-Noguer, F., Lepetit, V. and Fua, P., 2007. Accurate non-iterative
O(n) solution to the PnP problem.Proceedings of the IEEE International
Conference on Computer Vision, pp. 1–8.
Pathak, K., Birk, A., Vaˇskeviˇcius, N. and Poppinga, J., 2010. Fast reg-istration based on noisy planes with unknown correspondences for 3-D
mapping.IEEE Transactions on Robotics26(3), pp. 424–441.
Pulli, K., Piiroinen, S., Duchamp, T. and Stuetzle, W., 2005. Projective
surface matching of colored 3D scans. Proceedings of the International
Conference on 3-D Digital Imaging and Modeling, pp. 531–538.
Rabbani, T., Dijkman, S., van den Heuvel, F. and Vosselman, G., 2007. An integrated approach for modelling and global registration of point
clouds. ISPRS Journal of Photogrammetry and Remote Sensing61(6),
pp. 355–370.
Sattler, T., Leibe, B. and Kobbelt, L., 2009. SCRAMSAC: Improving
RANSAC’s efficiency with a spatial consistency filter. Proceedings of
the IEEE International Conference on Computer Vision, pp. 2090–2097. Seo, J. K., Sharp, G. C. and Lee, S. W., 2005. Range data
registra-tion using photometric features. Proceedings of the IEEE Computer
So-ciety Conference on Computer Vision and Pattern Recognition, Vol. 2, pp. 1140–1145.
Soudarissanane, S. and Lindenbergh, R., 2011. Optimizing terrestrial
laser scanning measurement set-up. The International Archives of the
Photogrammetry, Remote Sensing and Spatial Information Sciences, Vol. XXXVIII-5/W12, pp. 127–132.
Soudarissanane, S., Lindenbergh, R., Menenti, M. and Teunissen, P., 2011. Scanning geometry: influencing factor on the quality of terrestrial
laser scanning points. ISPRS Journal of Photogrammetry and Remote
Sensing66(4), pp. 389–399.
Stamos, I. and Leordeanu, M., 2003. Automated feature-based range
registration of urban scenes of large scale.Proceedings of the IEEE
Com-puter Society Conference on ComCom-puter Vision and Pattern Recognition, Vol. 2, pp. 555–561.
Steder, B., Grisetti, G. and Burgard, W., 2010. Robust place
recogni-tion for 3D range data based on point features.Proceedings of the IEEE
International Conference on Robotics and Automation, pp. 1400–1405. Steder, B., Grisetti, G., Van Loock, M. and Burgard, W., 2009. Robust
on-line model-based object detection from range images.Proceedings of the
IEEE/RSJ International Conference on Intelligent Robots and Systems, pp. 4739–4744.
Steder, B., Rusu, R. B., Konolige, K. and Burgard, W., 2011. Point fea-ture extraction on 3D range scans taking into account object boundaries.
Proceedings of the IEEE International Conference on Robotics and Au-tomation, pp. 2601–2608.
Swadzba, A., Liu, B., Penne, J., Jesorsky, O. and Kompe, R., 2007. A comprehensive system for 3D modeling from range images acquired from
a 3D ToF sensor. Proceedings of the International Conference on
Com-puter Vision Systems, pp. 1–10.
Theiler, P. W., Wegner, J. D. and Schindler, K., 2012. Automatic registra-tion of terrestrial laser scanner point clouds using natural planar surfaces.
ISPRS Annals of the Photogrammetry, Remote Sensing and Spatial Infor-mation Sciences, Vol. I-3, pp. 173–178.
Theiler, P. W., Wegner, J. D. and Schindler, K., 2013. Markerless point
cloud registration with keypoint-based 4-points congruent sets. ISPRS
Annals of the Photogrammetry, Remote Sensing and Spatial Information Sciences, Vol. II-5/W2, pp. 283–288.
Theiler, P. W., Wegner, J. D. and Schindler, K., 2014. Keypoint-based 4-points congruent sets – Automated marker-less registration of laser scans.
ISPRS Journal of Photogrammetry and Remote Sensing96, pp. 149–163. Tuytelaars, T. and Mikolajczyk, K., 2008. Local invariant feature
detec-tors: a survey.Foundations and Trends in Computer Graphics and Vision
3(3), pp. 177–280.
Vosselman, G. and Maas, H.-G., 2010. Airborne and terrestrial laser
scanning. Whittles Publishing, Dunbeath, UK.
Wang, Z. and Brenner, C., 2008. Point based registration of
terres-trial laser data using intensity and geometry features. The International
Archives of the Photogrammetry, Remote Sensing and Spatial Informa-tion Sciences, Vol. XXXVII-B5, pp. 583–589.
Weinmann, M., 2013. Visual features – From early concepts to modern computer vision. In: Farinella, G. M., Battiato, S. and Cipolla, R. (Eds.),
Advanced Topics in Computer Vision. Advances in Computer Vision and Pattern Recognition, Springer, London, UK, pp. 1–34.
Weinmann, M. and Jutzi, B., 2011. Fully automatic image-based
reg-istration of unorganized TLS data. The International Archives of the
Photogrammetry, Remote Sensing and Spatial Information Sciences, Vol. XXXVIII-5/W12, pp. 55–60.
Weinmann, M., Dittrich, A., Hinz, S. and Jutzi, B., 2013. Automatic
feature-based point cloud registration for a moving sensor platform.The
International Archives of the Photogrammetry, Remote Sensing and Spa-tial Information Sciences, Vol. XL-1/W1, pp. 373–378.
Weinmann, M., Weinmann, M., Hinz, S. and Jutzi, B., 2011. Fast and
automatic image-based registration of TLS data. ISPRS Journal of
Pho-togrammetry and Remote Sensing66(6), pp. S62–S70.
Wendt, A., 2007. A concept for feature based data registration by simul-taneous consideration of laser scanner data and photogrammetric images.
ISPRS Journal of Photogrammetry and Remote Sensing62(2), pp. 122– 134.
West, K. F., Webb, B. N., Lersch, J. R., Pothier, S., Triscari, J. M. and Iverson, A. E., 2004. Context-driven automated target detection in 3-D