Effects of different ozone exposure regimes on photosynthesis,
assimilates and thousand grain weight in spring wheat
U. Meyer
a, B. Köllner
b, J. Willenbrink
a,∗, G.H.M. Krause
b aBotanisches Institut der Universität zu Köln, Gyrhofstr., D-50931 Köln, Germany bLandesumweltamt Nordrhein-Westfalen (LUA NRW), Wallneyerstr., D-45133 Essen, GermanyReceived 7 August 1998; received in revised form 24 June 1999; accepted 9 August 1999
Abstract
The aim of the study was to compare two ozone exposure patterns with different peak concentrations under equal dose conditions. Spring wheat (Triticum aestivumcv. ‘Nandu’) was ‘pre-cultivated’ under glasshouse conditions and exposed to two different ozone exposure scenarios (A: 1700–0900 h: 20 ppb, 0900–1700 h: 65 ppb; B: 1600–1200 h: 20 ppb, 1200–1600 h: 110 ppb) in large fumigation chambers for two weeks during anthesis. Control plants received charcoal filtered ambient air (<5 ppb ozone 24 h/day) (CF). Chlorophyll content as well as chlorophyll fluorescence (Fv : Fm ratio) and carbohydrate composition (hexoses, sucrose, starch) were monitored in flag leaves and in the case of carbohydrate content also in the penultimate internode during and after ozone exposure. Thousand grain weight (TGW) was determined for estimating yield effects. Photosynthesis decreased markedly in both treatments expressed as Fv : Fm ratio. In treatment B chlorophyll content (a+b) of leaves was reduced by 40% after 7 and 14 days of exposure (p≤0.001). Carbohydrate content decreased significantly as compared with CF-plants to 20% (p≤0.001) in the case of sucrose and starch. Effects were especially pronounced in treatment B (110 ppb for 4 h) and could be observed even seven days after exposure under CF conditions. After 14 days of exposure during anthesis, plants were incapable of recovery as shown by a significant reduction in thousand grain weight of ozone treated plants compared with CF-plants (treatment B: 22% atp≤0.001). Effects on photosynthesis and carbon content even under moderate daily ozone peaks as in treatment A induced a significant yield loss of 11% (p≤0.001) as well, when applied during anthesis. It can be concluded that under equal dose conditions ozone treatments with comparatively high peak concentration induce more pronounced effects than ozone patterns with moderate peaks. ©2000 Elsevier Science B.V. All rights reserved.
Keywords:Ozone;Triticum aestivum(spring wheat); Assimilates; Photosynthesis; Yield; Dose–response relationship; Germany
1. Introduction
The potential of ozone to damage vegetation has been known for over 30 years but it is only in the recent past that ozone episodes, especially during
∗Corresponding author. Tel.:+49-0221-470-4061; fax:+49-0221-470-5062.
E-mail address:[email protected] (J. Willenbrink).
high pressure periods, have become a major concern in Europe. It has been clearly established that ozone at ambient concentrations found in Europe causes a range of effects including reduced photosynthesis (Fangmeier et al., 1993), altered carbon metabolism (Nie et al., 1993; Soja and Soja, 1995) and yield re-ductions (Fangmeier et al., 1994; Pleijel et al., 1995). The first target within the leaf at cellular level is the plasma membrane (Mortensen and Engvild, 1995;
Sandelius et al., 1995). As a consequence of dis-turbance of the overall phloem loading process by previous damage to the mesophyll plasma membrane, sucrose accumulates in the leaf cells which might cause down regulation of photosynthesis (Pollock and Farrar, 1997; Einig et al., 1997) resulting in several secondary effects, e.g. photoinhibition.
To evaluate ozone effects on agricultural crops in North Rhine Westphalia (NRW), a five year research program has been launched. In a first step various de-velopmental stages of a spring wheat were exposed to various ozone treatments; the most pronounced effects where observed during anthesis stage (Meyer et al., 1997). This paper examines effects of ozone, applied with two different peak scenarios, on physiological parameters (photosynthesis, assimilates, TGW) using wheat as an important agricultural crop in Europe.
2. Materials and methods
2.1. Cultivation of plants
Seeds of spring wheat (Triticum aestivum L. cv.
‘Nandu’) were germinated in a standardized soil (Fruhstorfer Einheitserde type ED 73) and sand mix-ture (4 : 1) containing defined amounts of a slow re-leasing fertilizer, so that no further fertilisation during the experiment was necessary. Plants were grown in ‘Riviera’-pots® having an integrated water reservoir providing a constant soil moisture content. Plants were kept in a glasshouse ventilated with charcoal filtered air until the stage of ‘anthesis’, stage EC 61 according to Tottman and Broad (1987).
2.2. Fumigation chambers
Experiments were carried out in closed hexagonal fumigation chambers described in detail by Meyer et al. (1997). Ozone was generated from pure oxygen by electrical discharge (VTU ozone generator) and mixed with charcoal filtered ambient air by means of mass flow controllers linked to a desktop com-puter, programmed with individual exposure profiles. To guarantee controlled and reproducible exposure conditions, concentrations of ozone were measured continuously within each chamber at plant height on a 10 min time-share basis by a Dasibi ozone
moni-Table 1
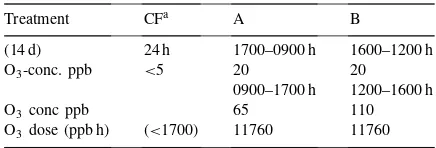
Ozone concentrations applied during exposure (30 June and 14 July 1997)
Treatment CFa A B
(14 d) 24 h 1700–0900 h 1600–1200 h
O3-conc. ppb <5 20 20
0900–1700 h 1200–1600 h
O3 conc ppb 65 110
O3 dose (ppb h) (<1700) 11760 11760
aCharcoal filtered ambient air.
tor (Dasibi 1008-AH, Environm., Colorado). Micro-climatic conditions (temperature, humidity, photosyn-thetic active radiation) were measured during exposure of plants. 12 h mean values (0800–2000 h) for cham-ber temperatures and relative humidity during the 1st
and 2nd week were calculated as 28.9◦C and 63.7%,
and 25.5◦C and 72.3%, respectively.
2.3. Exposure of plants
Eight pots each containing nine plants at the stage of anthesis (EC 61), were placed in each one of the six fu-migation chambers and fumigated with ozone or kept
in charcoal filtered ambient air (<5 ppb Ozone) as
con-trol. Table 1 gives the individual exposure regimes. Af-ter two weeks of exposure (stage EC 69), plants were transferred to a glasshouse ventilated with charcoal
filtered air (<5 ppb) until final harvest (stage EC 91).
2.4. Measurement of photosynthetic activity
2.5. Sampling and assay
Flag leaves as well as the penultimate internodes of six plants per chamber (12 plants per treatment) were harvested for carbohydrate analysis between 0900 and 1200 h, at day 7 and 14 during the exposure period (stage EC 65), as well as seven days past exposure to evaluate possible recovery effects. After determination
of fresh weight plant material was frozen (−20◦C),
lyophilized and stored at room temperature. The assay for carbohydrate analysis used in this investigation is described in detail by Meyer et al. (1997). Contents of glucose, fructose, sucrose and starch were analysed by a modified version of the Boehringer UV-test kit as described by Hoffmann-Thoma et al. (1996).
2.6. Hydrolysis and measurement of fructans
Aliquots (200ml) of the extract used for
determina-tion of glucose, fructose and sucrose concentradetermina-tions
were hydrolyzed with 400ml 1 M HCl at 60◦C for
15 min, then neutralized with 1 M NaOH. Fructan con-tent was estimated as fructose equivalents. Inulin from chicory root (Sigma, EEC No. 232-684-3) was used as an internal standard.
2.7. Pigment analysis
The amount of chlorophyll (a+b) in flag leaves
was determined non-destructively with the Minolta chlorophyll meter SPAD-502. Calculation of chloro-phyll content was based on the amount of light
trans-mitted by the leaf in two wavelength regions (≈650
and 940 nm) in which the absorbance of chlorophyll is different. The suitability of this method for
determin-ing chlorophyll a+b in wheat was shown by Finnan
et al. (1997b).
2.8. Yield
At final harvest (ripening, stage EC 91) main stem ear and ears of tillers of each plant were collected
separately and dried (80◦C for 2 days) before pooling
and counting all kernels per ear. Yield was calculated by determining the thousand grain weight (TGW).
2.9. Statistics
Plants from individual ozone treatments were used as replicates. Means of each ozone treatment were
compared with CF-values, in the case offluorescence
andchlorophyll measurement n=20, in the case of
measuring thousand grain weight n=12 and in the
case ofcarbohydrateanalysesn=12. Statistical
anal-ysis of the data were performed using SPSS (Bühl and Zöfel, 1994, Statistical Package for Social Sciences).
The Student’s t-test was used to compare treatment
means. Significant effects were indicated by *p≤0.05;
**p≤0.01; ***p≤0.001.
3. Results
3.1. Photosynthetic pigments and chlorophyll fluorescence quenching
There was a significant reduction in total
chloro-phyll after seven days in treatment B (35%,p≤0.001),
and after 14 days in treatment A (25%, p≤0.01)
(Table 2). Chlorophyll a+b content in leaves of the
ozone-treated plants was still significantly reduced in comparison with CF-plants at the end of the seven day recovery period. However, chlorophyll content even in control plants decreased according to the beginning senescence in flag leaves of wheat plants
≈25 days after anthesis.
The ratio of Fv : Fm declined in all plants during the measurement period, Fv : Fm declined most dis-tinctly in treatment B (Table 2). Even seven days after
transferring the plants to charcoal filtered air (<5 ppb
ozone) photosynthetic activity was still reduced (treat-ment B). As shown in Table 2 ozone induced a reduc-tion of maximal fluorescence Fm leading to the de-cline of Fv : Fm, whereas no increase of minimal flu-orescence Fo in relation to control could be detected.
3.2. Shifts of carbohydrate content in flag leaves and penultimate internodes
Both ozone treatments (A and B) induced marked changes in the content of water soluble carbohydrates in the flag leaf compared with CF-plants: a significant
decline up to 50% (p≤0.05) in the case of glucose
Table 2
Effects of ozone on Fo, Fv : Fm ratio, Fm and chlorophyll content (mg g−1dry wt.) of flag leaves (n=20) from plants exposed to treatments A, B and CF for 7 and 14 days during anthesis and seven days after the end of ozone exposure
Treatment Fo Fv : Fm Fm Chlorophyll
After 7 days of ozone exposure
CF 0.305±0.011 0.803±0.013 1.555±0.088 11.3±1.1
A 0.312±0.025 0.785±0.017∗ 1.453±0.076* 10.4±1.9
B 0.308±0.017 0.756±0.017*** 1.264±0.110*** 7.5±1.1***
After 14 days of ozone exposure
CF 0.332±0.020 0.767±0.014 1.422±0.043 11.0±1.1
A 0.324±0.006 0.743±0.014** 1.261±0.092*** 8.2±2.2**
B 0.329±0.017 0.724±0.020*** 1.195±0.081*** 6.7±1.5***
7 days after end of ozone exposure
CF 0.512±0.021 0.751±0.011 2.057±0.079 8.6±1.1
A 0.485±0.046 0.739±0.026 1.884±0.318** 7.3±0.9**
B 0.467±0.074 0.713±0.024*** 1.641±0.314** 7.3±1.8
∗p≤0.05; **p≤0.01; ***p≤0.001.
for starch content is obvious after 14 days of ozone exposure (Table 3).
Whereas this effect is evident already within seven days of ozone exposure, it becomes even more pro-nounced in the course of the second week of exposure. Corresponding to the shifts of Fv : Fm ratios, under equal dose conditions the higher peak concentration (B) results in a more drastic decline of both parame-ters sucrose and starch, compared with the lower peak concentrations (A). This difference apparently persists over the seven days under ozone-free conditions,
indi-Table 3
Carbohydrate content (mg g−1dry wt.) of flag leaves (n=12) from plants exposed to treatments A, B and CF for 7 and 14 days during anthesis and seven days after the end of ozone exposure
Treatment Glucose Fructose Sucrose Starch
After 7 days of ozone exposure
CF 23.66 17.41 80.00 37.22
A 30.02 23.86 49.13*** 19.30***
B 25.88 21.28 45.43*** 21.92**
After 14 days of ozone exposure
CF 20.52 19.64 81.15 39.57
A 12.82 11.41* 24.58*** 13.18**
B 10.61∗ 9.58*** 15.16*** 8.95***
7 days after end of ozone exposure
CF 10.39 10.61 52.71 28.11
A 16.23 14.72 36.76 19.87
B 11.05 10.60 20.17** 10.71**
∗p
≤0.05, **p≤0.01, ***p≤0.001.
cating that homeostasis can not compensate for ozone induced injury.
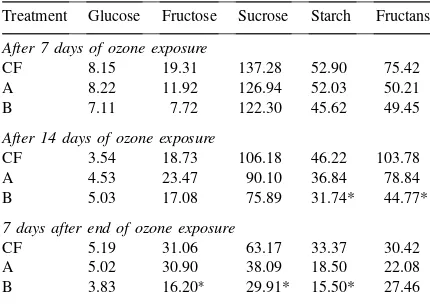
The carbohydrate content of the penultimate intern-ode was analysed because the intermediate storage of non-structural carbohydrates in the stem is well doc-umented (cf. Wardlaw, 1990; Schnyder, 1993). Un-der ozone exposure, however, the decline of carbohy-drates, most prominent in the fraction of the fructans during the two weeks of ozone exposure (Table 4), is even more pronounced under treatment B (sucrose and
starch: 30%, fructans: 45%,p≤0.05). In the course of
Table 4
Carbohydrate content (mg g−1dry wt.) of penultimate internodes (n=12) from plants exposed to treatments A, B and CF for 7 and 14 days during anthesis and seven days after the end of ozone exposure
Treatment Glucose Fructose Sucrose Starch Fructans
After 7 days of ozone exposure
CF 8.15 19.31 137.28 52.90 75.42
A 8.22 11.92 126.94 52.03 50.21
B 7.11 7.72 122.30 45.62 49.45
After 14 days of ozone exposure
CF 3.54 18.73 106.18 46.22 103.78
A 4.53 23.47 90.10 36.84 78.84
B 5.03 17.08 75.89 31.74* 44.77*
7 days after end of ozone exposure
CF 5.19 31.06 63.17 33.37 30.42
A 5.02 30.90 38.09 18.50 22.08
B 3.83 16.20∗ 29.91* 15.50* 27.46
∗p
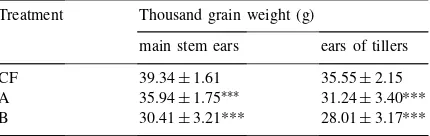
Table 5
Thousand grain weight (TGW) (g) from wheat plants exposed to treatments A, B and CF profiles for 14 days during anthesisa
Treatment Thousand grain weight (g)
main stem ears ears of tillers
CF 39.34±1.61 35.55±2.15
A 35.94±1.75∗∗∗ 31.24±3.40***
B 30.41±3.21*** 28.01±3.17***
aTGW of ears of the main stem (n=12) and the ears of tillers (n=16) is separated.
∗∗∗p≤0.001.
the subsequent week, levels of both sucrose and starch were markedly reduced (Table 4).
3.3. Thousand grain weight and grain yield
The data presented above indicate that a period of two weeks of exposure to short-term, realistic peak ozone concentrations cause inhibition of photosyn-thesis and, in consequence, a decline of assimilate production. It is assumed that this reduction of carbo-hydrates within the culm might disturb the supply of assimilates for kernel growth.
Weak effects on grain yield parameters such as thou-sand grain weight after ozone exposure have been re-ported earlier (Köllner et al., 1995). The data presented in Table 5 convincingly demonstrate that the kernel weight is reduced after two weeks of ozone exposure during the first period of anthesis (EC 61-65). Again, as in the case of photosynthesis and carbohydrates, the extent of reduction was dependent on the ozone ex-posure scenario applied. Furthermore, the whole ear weight of both main ears and ears of tillers was con-sistent with this tendency (data not shown).
4. Discussion
The aim of the study was to compare two ozone exposure patterns with different peak concentrations under equal dose conditions. The results indicate that under equal dose conditions photosynthesis, assimilate allocation, and as a consequence thou-sand grain weight were affected most strongly by an ozone regime with peaks of 110 ppb for 4 h per day compared with more constant concentrations. These results are in accordance with recent findings from time/concentration experiments with wheat in
open-top chambers (Pleijel et al., 1995; Legge et al., 1995; Finnan et al., 1996a, 1996b, 1997a) and with results from fumigation experiments under controlled environmental conditions (Musselman et al., 1994). Analysis of European open-top chamber data for spring wheat show that cumulative exposure indices give better fits in regression analysis than concentra-tion means (Finnan et al., 1996a; Fuhrer et al., 1997). One possible approach to describe dose–response relationships in this way provide cumulative doses like SUM06 or AOT40, 60 etc. (Lefohn et al., 1988; Fuhrer, 1995; Legge et al., 1995; Pleijel et al., 1995; Fuhrer et al., 1997) giving different weight to concen-trations above threshold concentration (Krupa et al., 1994; Sanders et al., 1995).
In this study the difference between treatments A and B (65/20 ppb vs. 110/20 ppb), is specially notewor-thy with respect to grain yield: two weeks of 8 h daily of 65 ppb result in 11% yield loss whereas 4 h daily of 110 ppb end up with 22% yield loss, thus show-ing the importance of specific ozone exposure patterns and their implication on plant performance which was anticipated earlier by Krupa et al. (1994).
The results of the determination of thousand grain yield correspond with the findings gained by the as-similate content of plant organs. The marked decrease of photosynthesis over the two weeks of ozone ex-posure caused a conspicuous decline of water-soluble carbohydrates in the flag leaf. These results seem to contradict earlier reports on spring wheat and its re-sponse to ozone because Balaguer et al. (1995) and Barnes et al. (1995) observed a weak, but significant accumulation of sucrose and starch in flag leaves when exposed to moderate doses of ozone. However, as dis-cussed by these authors and others, primary effects of ozone on plasma membranes which might impede assimilate transport, have to be taken into account as well as secondary effects. The latter are linked with the complex reactions of the photosynthetic apparatus and its biochemistry which enables synthesis of starch and, in the cytosol, of sucrose as well. The delay of assimilate export from the mesophyll might gradually inhibit photosynthesis which in turn leads to reduced assimilate content of the leaves, as suggested by Einig et al. (1997) and others.
non-structural carbohydrates in the penultimate in-ternode of control plants could be expected. It can be assumed that the lower content of both sucrose and fructans in the culm after ozone exposure — as compared with the control — already mirrors the obvious inadequate carbon supply for the growing ear. It can only be speculated whether the drastic decrease of sucrose and fructan content of the in-ternodes under ozone exposure indicates an increased mobilisation. Storage of assimilates in the culm could mask insufficient photosynthate supply to the grain (Kühbauch and Thome, 1989) for wheat plants under various source-sink manipulations, thus explaining the carbohydrate pattern in flag leaves. The findings of Willenbrink et al. (1998) for an increased activity of fructan exohydrolase in the culm of shaded plants, which was shown to be correlated with carbohydrate changes might support this interpretation.
The decrease of photosynthesis and chlorophyll content (Pleijel et al., 1997) coincides with the ob-served alteration of assimilate content (Bastrup-Birk and Mortensen, 1997). The measurement of chloro-phyll fluorescence could be an early indicator of detrimental ozone effects on plant health (Soja and Soja, 1995).
Considering the well-known difficulties of trans-ferring results gained with standardized ozone con-centrations under partially controlled chamber condi-tions to more complex situacondi-tions in the field, it can be concluded from these results that ozone episodes as applied in this experiment are capable of reduc-ing the vitality of wheat and maybe other crops as well. It therefore has to be postulated that setting of thresholds for atmospheric ozone should consider peak concentrations more effectively. For more real-istic fits of dose–response relationships further inves-tigations concerning the influence of environmental (Fuhrer, 1995; Grünhage and Jäger, 1996; Grünhage et al., 1997) and plant specific conditions (Sellden and Pleijel, 1995; Vandermeiren et al., 1995) on the ac-tual absorbed ozone dose affecting growth and yield of crops are important.
Acknowledgements
The authors thank Dipl. Ing. Jürgen Westphalen for his technical care of the exposure and monitoring
system and Mrs. Katja Piiper for her assistance during the experiments.
References
Balaguer, L., Barnes, J.D., Panicucci, A., Borland, A.M., 1995. Production and utilisation of assimilates in wheat (Triticum aestivumL.) leaves exposed to elevated O3 and/or CO2. New Phytologist 129, 557–568.
Barnes, J.D., Ollerenshaw, J.H., Whitefield, C.P., 1995. Effects of elevated CO2and/or O3on growth, development and physiology of wheat (Triticum aestivum L.). Global Change Biology 1, 129–142.
Bastrup-Birk, A., Mortensen, L., 1997. Effect of ozone on vegetation. In: Photochemical Air Pollution, In: Fenger, J. (Ed.) NERI Technical Report No. 199. ISBN 87-7772-334-1, 103–133 (Chapter 5).
Bühl, A., Zöfel, P., 1994. SPSS für Windows, Version 6. Addison-Wesley. ISBN 3-89319-689-6.
Einig, W., Lauxmann, U., Hauch, B., Hampp, R., Landolt, W., Maurer, S., Matyssek, R., 1997. Ozone-induced accumulation of carbohydrates changes enzyme activities of carbohydrate metabolism in birch leaves. New Phytologist 137, 673–680. Fangmeier, A., Kanbach, F., Jäger, H.-J., 1993. Response of
wheat photosynthesis to ozone: exposure–response relationships achieved in greenhouse chamber fumigations. Angewandte Botanik 67, 199–203.
Fangmeier, A., Brockerhoff, U., Grüters, U., Jäger, H.-J., 1994. Growth and yield responses of spring wheat (Triticum aestivum
L. cv. Turbo) grown in open-top chambers to ozone and water stress. Environmental Pollution 83, 317–325.
Finnan, J.M., Jones, M.B., Burke, J.I., 1996a. A time-concentration study on the effects of ozone on spring wheat (Triticum aestivum
L.). 1. Effect on yield. Agriculture Ecosystems and Environment 57, 159–167.
Finnan, J.M., Jones, M.B., Burke, J.I., 1996b. A time-concentration study on the effects of ozone on spring wheat (Triticum aestivum
L.). 2. A comparison of indices. Agriculture Ecosystems and Environment 57, 169–177.
Finnan, J.M., Burke, J.I., Jones, M.B., 1997a. An evaluation of indices that describe the impact of ozone on the yield of spring wheat (Triticum aestivum L.). Atmospheric Environment 31, 2685–2693.
Finnan, J.M., Burke, J.I., Jones, M.B., 1997b. A note on a non-destructive method of chlorophyll determination in wheat (Triticum aestivumL.). Irish J. Agricultural and Food Research 36 (1), 85–89.
Fuhrer, J., 1995. Critical level for ozone to protect agricultural crops: interaction with water availability. Water Air and Soil Pollution 85, 1355–1360.
Fuhrer, J., Skärby, L., Ashmore, M.R., 1997. Critical levels for ozone effects on vegetation in Europe. Environmental Pollution 97, 91–106.
L. (Eds.), Critical Levels for Ozone in Europe: Testing and Finalizing the Concepts. UN-ECE workshop report. Univ. of Kuopio, Dept. of Ecology and Environmental Science. Grünhage, L., Jäger, H.J., Haenel, H.D., Hanewald, K., Krupa, S.,
1997. Platin (plant–atmosphere interaction) II: Co-occurrence of high ambient ozone concentrations and factors limiting plant absorbed dose. Environmental Pollution 98, 51–60.
Hoffmann-Thoma, G., Hinkel, K., Nicolay, P., Willenbrink, J., 1996. Sucrose accumulation in sweet sorghum stem internodes in relation to growth. Physiologia Plantarum 97, 277–284. Köllner, B., Krause, G.H.M., Meyer, U., Willenbrink, J., 1995.
Effects of different ozone exposure regimes on yield, carbon metabolism and photosynthesis of spring wheat. International Workshop: Exceedances of critical loads and levels, Vienna, November 22–24.
Krupa, S.V., Nosal, M., Legge, A.H., 1994. Ambient ozone and crop loss: establishing a cause-effect relationship. Environmental Pollution 83, 269–276.
Kühbauch, W., Thome, V., 1989. Nonstructual carbohydrates of wheat stems as influenced by sink-source manipulations. J. Plant Physiology 134, 243–250.
Lefohn, A.S., Laurence, J.A., Kohut, R.J., 1988. A comparison of indices that describe the relationship between exposure to ozone and reduction in the yield of agricultural crops. Atmospheric Environment 22, 1229–1240.
Legge, A.H., Grünhage, L., Nosal, M., Jäger, H.-J., Krupa, S.V., 1995. Ambient ozone and adverse crop response: an evaluation of North American and European data as they relate to exposure indices and critical levels. Angewandte Botanik 69, 192–205. Meyer, U., Köllner, B., Willenbrink, J., Krause, G.H.M., 1997.
Effects of ozone on agricultural crops in Germany. I. Different ambient ozone exposure regimes affect photosynthesis and assimilate allocation in spring wheat. New Phytologist 136, 645–652.
Mortensen, L., Engvild, K.C., 1995. Effects of ozone on 14C-translocation velocity and growth of spring wheat (Triticum
aestivum L.) exposed in open-top chambers. Environmental Pollution 87, 135–140.
Musselman, R.C., Younglove, T., McCool, P.M., 1994. Response of Phaseolus vulgaris L. to differing ozone regimes having identical total exposure. Atmospheric Environment 28, 2727– 2731.
Nie, G.-Y., Tomasevic, M., Baker, N.R., 1993. Effects of ozone on the photosynthetic apparatus and leaf proteins during leaf development in wheat. Plant Cell and Environment 16, 643– 651.
Pleijel, H., Skärby, L., Wallin, G., Sellden, G., 1995. A process-oriented explanation of the non-linear relationship between grain yield of wheat and ozone exposure. New Phytologist 131, 241–246.
Pleijel, H., Ojanperä, K., Danielsson, H., Sild, E., Gelang, J., Wallin, G., Skärby, L., Selldén, G., 1997. Effects of ozone on leaf senescence in spring wheat — Possible consequences for grain yield. Phyton — Annales Rei Botanicae 37, 227–232. Pollock, C.J., Farrar, J., 1997. Source-sink relations: the role
of sucrose. In: Baker, N.R. (Eds.), Photosynthesis and the Environment. Dordrecht: Kluwer.
Sandelius, A.S., Näslund, K., Carlsson, A.S., Pleijel, H., Sellden, G., 1995. Exposure of spring wheat (Triticum aestivum) to ozone in open-top chambers. Effects on acyl lipid composition and chlorophyll content of flag leaves. New Phytologist 131, 231–239.
Sanders, G.E., Skärby, L., Ashmore, M.R., Fuhrer, J., 1995. Establishing critical levels for the effects of air pollution on vegetation. Water Air and Soil Pollution 85, 189–200. Schnyder, H., 1993. The role of carbohydrate storage and
redistribution in the source–sink relations of wheat and barley during grain filling — a review. New Phytologist 123, 233–245. Sellden, G., Pleijel, H., 1995. Photochemical oxidant effects on vegetation — Response in relation to plant strategy. Water Air and Soil Pollution 85, 111–122.
Soja, G., Soja, A.-M., 1995. Ozone effects on dry matter partitioning and chlorophyll fluorescence during plant development of wheat. Water Air and Soil Pollution 85, 1461– 1466.
Tottman, D.R., Broad, H., 1987. The decimal code for the growth stages of cereals, with illustrations. Ann. Appl. Biol. 110, 441– 454.
Vandermeiren, K., de Temmerman, L., Hookham, N., 1995. Ozone sensitivity of Phaseolus vulgaris in relation to cultivar differences, growth stage, growth stage and growing conditions. Water Air and Soil Pollution 85, 1455–1460.
Wardlaw, I.F., Willenbrink, J., 1994. Carbohydrate storage and mobilisation by the culm of wheat between heading and grain maturity: the relation to sucrose synthase and sucrose-phosphate synthase. Australian J. Plant Physiology 21, 255–271. Wardlaw, I.F., 1990. The control of carbon partitioning in plants.
New Phytologist 116, 341–381.