Top Gear Race : The Estimation of Society’s Choice on Tr ansportation Mode using a Multinomial Logit Model
I Wayan Sukadana1 Amr it a Nugr aheni Sar asw aty2 I Gusti Ayu Putr i Anggar a Indr asw ari3
1,2 ,3Depar tment of Development Economics, Faculty of Economics and
Business, Udayana Univer sity
Email : [email protected]
amr itasar [email protected]
Abstr act
Bal i as par t of Indonesian gr ow ing economy is facing an incr easi ng demand of t r anspor tati on infr ast ructur es. In or der t o r esponse hi gh demand of tr anspor tati on infr ast r uctur e, and to pr event t he thr eat of tr affic congesti on, the gover nment of Bali pr ovides t he society w ith a public tr anspor tation and a br and new toll r oad. These infr astr uctur es give an oppor tunity to soci ety to decide betw een tr avel by t heir ow n car / motor cycl e or publ ic tr anspor t. For the gover nment, i t is impor tant t o set effi cient t r anspor tati on infr ast ructur es to escape fr om high cost economy w hich appear fr om tr affi c congestion. This paper investi gates society’s choi ce on tr anspor t ati on mode in Denpasar City. We esti mat e the passenger ’s choi ce data using a Mul tinomi al Logit model, w ith i ncome and number of congestion spot as independent var i ables. The r esult show s that passenger w ho has high value of t ime pr efer to tr avel by their ow n vehicle compar e to publ ic tr anspor t. The r esult i s analogue to the Top Gear Race, w her e the car s most of the ti me w in the r ace against the publ ic t r anspor t. Finally, fr om the society’s point of vi ew , w e can say that the development of infr astr uctur es of public t ranspor t ation, w hich has been done by t he gover nment , sti ll less attr active compar e to the pr i vate tr anspor tati on.
Key wor ds: pr efer ence, tr anspor t ation infr astr uct ur e, lost mi nimi zati on, mul tinomial l ogit .
Abstrak
pemer intah Bal i menyediakan t r ansport asi umum dan jalan tol bar u bagi masyar akat. Infr astr uktur ini member ikan kesempatan kepada masyar akat untuk memutuskan apakah melakukan per jalanan dengan mobi l mer eka sendir i / sepeda motor atau angkutan umum. Bagi pemer intah, penting untuk mengatur infr astr uktur tr anspor tasi yang efisien unt uk ter hindar dar i ekonomi biaya ti nggi yang muncul dar i kemacetan lalu lintas. Makalah ini mengkaji pil ihan masyar akat pada moda tr anspor tasi di Kota Denpasar . Data pilihan penumpang diper kir akan menggunakan model Mul tinomi al Logit, dengan pendapat an dan jumlah lokasi kemacet an sebagai var i abel independen. Hasil penel itian menunjukkan bahw a penumpang yang memi liki nil ai w aktu tinggi lebih memil ih untuk beper gian dengan kendar aan sendi r i di bandi ngkan dengan angkutan umum. Hasil ini sesuai anal og Top Gear Race, di mana mobil-mobil pr ibadi sebagian besar w aktu memenangkan per lombaan melaw an angkutan umum. Akhir nya, dar i sudut pandang masyar akat, dapat di kat akan bahw a pembangunan infr astr uktur tr anspor t asi publ ik, yang telah dilakukan oleh pemeri nt ah, masih kur ang menar ik dibandingkan dengan kendar aan pr ibadi.
INTRODUCTION
Since the new economic or der in the late 1960s, economic development has been incr easing r apidly and so has the demand for transpor t. A decade later , it became obvious that tr anspor tation on the w hol e needed a lot of attention. Lending agenci es, as w ell as the centr al gover nment made funds available for highw ay and tr anspor tation pr ojects to impr ove its role in devel oping the nation. (Sutomo et.al, 1993). It then turned out that the supply of public transpor t failed to fulfill the mar ket demand, so people began to collectively opt for pr ivate vehicles over public transport ation.Now , for over the last decade, the aver age number of public tr anspor tati on user s has decr eased r apidl y, par tly due to the over all growth of the Indonesian economy, w hi ch has incr eased the number of mi ddle-income ear ner s and the mar ket’s vehicle affor dability (Seti aw an, 2013)
On 2003, public tr anspor t user s accounted for 45 per cent of total tr ansportation user s, and it r emai ned so until 2012. Fr om that poi nt, motor cycl es became mor e ubiquitous as a r esult of their almost 60 per cent mark et share, as few er and few er people took to public tr anspor tation. It i s also wor th nothing that over the same per iod, public tr anspor t onl y accounted for 1 per cent of total vehicles on the r oad.
Bali as par t of Indonesi an growi ng economy is also facing an incr easing demand of tr anspor t ation infr ast r uctures. In or der to r esponse high demand of tr anspor tation infr ast r uctur e, and to pr event the thr eat of traffic congestion, the gover nment of Bali provides the society w ith a public tr anspor tation and a br and new toll r oad. These infr ast ructur es give an oppor tunity to soci ety to decide between tr avel by their ow n car / motor cycle or publ ic tr anspor t. For the gover nment, i t is impor tant to set efficient t r anspor tation infr ast r uctur es t o escape fr om high cost economy w hich appear fr om t r affic congestion.
Literature Review
They also concl ude that a pr ogr am ai med at reducing congestion and poll ution dur ing peak hour s should focus on incr easing the cost of pr ivate transport and providing faster and mor e r el iable public tr ansport.
The opposi tion between car and public tr anspor t use and w ays to encour age people to take publ ic tr anspor t that pr ovided by the gover ment can be found in many empi ri cal r esear chs such as; Hensher (1998) and Meyer (1999) demonstr ate that, in ter m of t r anspor t demand management (TDM), the best action is to incr ease the pr ice of car for i ndividual use and to reduce the overall attractiveness of the car . Nak amur a and Hayashi (2013) define thr ee str ategies for low-carbon ur ban tr anspor t: ‘avoid’ (i.e. reducing unnecessar y tr avel demand), ‘shift’ (i .e. encour aging modal shift in favor of public tr anspor t use) and ‘i mpr ove’ (i.e. impr ovi ng fuel economy and emissi on intensity).
The method that usuall y uses to estimate tr anspor tati on mode choi ce is the logit model (McCar thy (2001) and al so Gebeyehu and Takano (2007). Depar t fr om those studies, w e also try to esti mate the society’s pr efer ence tow ar d the tr anspor tation mode. This study esti mates the i mpact of monetar y expense and value of time on the society’s choices
METHODOLOGY
Model of Society’s Choice
let w e consider a simple model of society’s choi ce, w hich adapt from Shy (1995) w ith a slight modifi cation. We assume that the passenger s, w ho travel fr om Denpasar to Bukit Jimbar an Campus, have tw o possible alter nati ves for getting there; each passenger can use either to tr avel by thei r ow n vehicle or choose to use the public tr ansport ation. For the passenger s who tr avel by their own vehi cle, we assume deal w ith tC tr avel time. This tr avel time depends on the tr affic ( congestion) and ther efor e depends on the number of all passengers w ho decide to tr avel wi th their ow n vehicl e. Formally, w e can w r ite thi s t ravel ti me as;
The par ameter
α
measur es the time that spend by passenger , w hich isindependent from congestion, such as the time it tak es to star t and heat a
car , to check the oil, dust, and so on. The par ameter
β
measures the effectof congestion on tr avel time, w hich depends on the quality of r oad,
number of lanes, and tr affic lights. Si mi lar to tr avel ti me by using pr ivate
vehicle, let we consider a tP for the t r avel time by using public
transport ation, and w e can w r ite for mall y as follow s;
tP
φ
ϕnC, w her e 0 φ
1 andϕ 0 (2)The par ameter
φ
measures the time that spend by passenger, w hich is independent fr om congestion, such as the time it takes to get to the bus station or stop. The par ameter ϕ measures the effect of congesti on on travel time, which depends on the quality of r oad, number of lanes, and traffic li ghts. The inter pr et ation of parameter ϕ almost identic w ithβ
, because publi c tr anspor tation has almost same r oute w ith pr ivate transport ation.We assume N passenger s w ill fall into nC passengers w ho chose to t r avel with
pr ivate vehicl e and nP passenger s w ho chose to tr avel by public
transport ation, so nCnPN . Than, we denote v as the value of time and define the lost function for the passenger s w ho use the pr ivate vehicl e as;
(
α
β
nC ) γ
(3) Meanw hile the lost function for passenger s w ho use publi c tr anspor t is as
(
φ
ϕnC ) λ
(4) The lost-minimization functions of the two al ter natives ar e functions of both
value of time and a monetar y expense.
We assume that ther e are a lar ge number of passenger s wi shing to go
Udayana Univer sity on Ji mbar an, so each passenger i gnor es thei r
marginal effect on congestion. Hence, each passenger tak e nC as given and
min
L
≡ min
LC, LP
(5)C,P
Therefor e, i f in equilibr ium passenger s use both tr anspor t ation methods, then nC
must satisfy;
v(
α
β
nC ) γ
v(φ
ϕnC ) λ
(6) Assuming that N is sufficiency large, so that not all passenger s use the same
transport ation mode, the equilibr ium al location of passenger s betw een
the two tr anspor t ation methods is given by;
n
Ce
(
λ
−
γ
)
v(
φ
−
α
)
(7)
v(β−ϕ)
RESULT AND DISCUSSION
Sample and Sur vey Result
The samples ar e the students and employee of Udayana Univer sity w ho travel for study or work in Buk it Ji mbar an Campus fr om Denpasar greater ar ea ( Sar bagita). We classified the mode of tr ansport ation into thr ee categor y; “public” for the tr ans-sar bagita, “motor ” for motor cycle, and “car” for car . We select the samples r andomly fr om the student and employee w ho have an exper ience in using t hose thr ee t ransport ation modes. This setting is ver y impor tant in gaini ng gr eater data sets that wil l use in Multinomial Logit Model l ater on. We classified the per son w ho usual ly uses the public transpor tation into samples that chose public transport ation and, w e coded it w ith 1 and 0 for others. We also applied the same method for others mode.
To collect the data, w e have distri buted 100 questionnair es, but ther e ar e 8
retur n questionnair es that not give clear infor mati on, and we deci de to
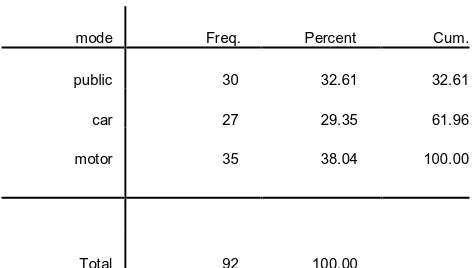
dr op it. Table 1. show the frequencies and percent ages of the mode
chosen by r espondent.
Table 1. Frequencies and Percentages of the Chosen Mode
mode Freq. Percent Cum.
public 30 32.61 32.61
car 27 29.35 61.96
motor 35 38.04 100.00
The data on Table 1, show that r espondents ar e di str ibuted al most equally
among the alternatives. Motor cycle appear s to be the most popular mode,
compar e to car or publ ic mode. This popular ity may because of
motor cycl e have the shor test tr avel ti me among the alter natives as show n
in Tabl e 2.
Table 2. Mean of Tr avel Time by Mode
mode mean(tmotor) mean(tcar) mean(tpublic)
public 32 48 120
car 29 44 107
motor 29 44 105
Respondent tend to choose motorcycle to tr avel when they face mor e congestion spot. Table 3, show us that the aver age number of congestion spot that face by r espondent w ho choose car and public tr ansportation does not differ so much. This figur e tell us that people tend to indiffer ent in choosing between car or public transpor t ation when they face less congestion spot.
Table 3. Mean of Congestion Spot by Mode
mode N(scong)
mean(scong
) sd(scong)
public 30 2.5 .5085476
car 27 2.22222 .4236593
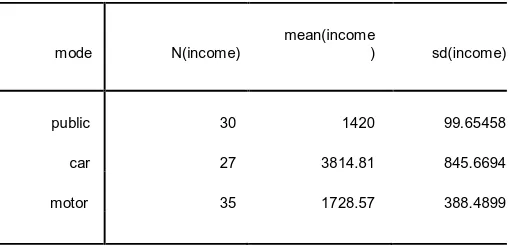
Fr om Table 4, w e can see that r espondent w ho has lower i ncome choose public mode. Meanw hi le, for the highest income tend to choose car.
Table 4. Mean of Respondent by Mode in Thousand Rupiah
mode N(income)
mean(income
) sd(income)
public 30 1420 99.65458
car 27 3814.81 845.6694
motor 35 1728.57 388.4899
Econometr ic Appr oach and Multinomial Logit Estimation
We estimate the passenger ’s choi ce data using a Multinomi al Logi t model, with i ncome and number of congestion spot as independent var iables. Fir st, w e estimate the impact of income on mode choice. This setti ng t ry to analyze monet ar y expense impact on society’s choice tow ard the transport ation mode.
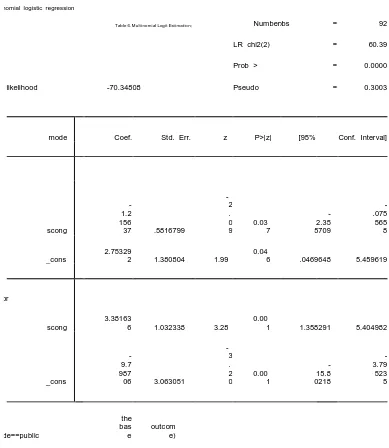
Table 5. Multinomial Logit Estimation; Monetar y Expense Impact
Multinomial logistic regression Number obs = 92
LR chi2(2) = 122.38
Prob > = 0.0000
Log likelihood = -39.354221 Pseudo = 0.6086
mode Coef. Std. Err. z P>|z| [95% Conf. Interval]
Car
inc 73.23428 41.03145 1.78
0.07 4
-7.18
_cons -569.214 321.6897 -1.77
Table 5, tell us that the incr ease i n income w ill induce the society to leave the
public tr ansportation. When society’s income incr eases they wi ll pr efer
motor cycl e compar e to public tr anspor tation. This phenomenon is causes
by the tr avel time using motorcycle is shor ter compar e to public
transport ation. When, their income incr eases mor e, and then they pr efer
car compar e to motor cycle. Although the tr avel time using motorcycle is
shor ter than car , using car gives peopl e mor e comfor t, mor e over if the
congestion spot is less.
available, w hil e r espondents w ho have tw o or mor e vehicles w er e less resistant to mode change.
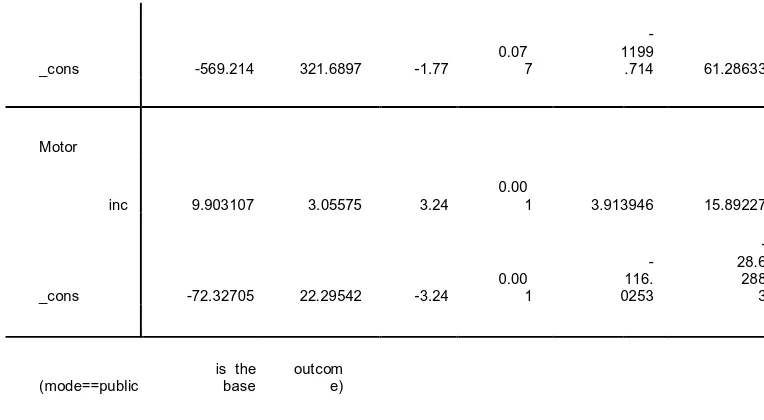
The second estimation is dedicated to test the value of ti me tow ard society’s the number of congestion spot as the proxy of value of time. The estimation r esult is as show n in Table 6.
Table 6. Estimation Result
mode Coef. Std. Err. z P>|z| [95% Conf. Interval]
scong
the number of congestion spot makes people to sw itch fr om using car to
public transpor tation. This r esul t suggest us that i f the gover nment w ant
to incr ease the number of publi c transportation costumer , the
gover nment have to decr ease the time tr avel of this publi c transportation
so can compete w ith motorcycle. It is i n line wi th other r esear ch that
conducted by Alpizar and Car lsson (2001) for r educing travel ti me.
CONCLUSION
The Multi nomial logit estimation shows that passenger who has high value of time pr efer to chose t ravel by their ow n vehicle, w hich is their motor cycl e, compar e to car or publ ic tr ansport. The r eason is, because it mor e pr acticable and no waiting time. The result is analogue t o the Top Gear Race, wher e the car s or motor cycle most of the time w in the r ace against the publ ic tr ansport. Finall y, from the society’s point of view , we can say that the development of infr astr uctur es of public tr anspor tation, which has been done by the government, still less attr acti ve compar e to the pr ivate tr anspor t ation. How ever , the gover nment stil l has an oppor tuni ty to w in the hear t of society by i ncreasing the number of bus to reduce the w aiting ti me. Although i t is hard to compete with the motor cycl e tr avel time and simpli city, the public transportation still may win in comfor t aspect.
RECOMMENDATION
emphasi s has to be put on redesi gning r outes and exclusive bus lanes, and pr ovi ding tr affic pr iority for buses, faster connections betw een routes, and mor e fr equent and reliable depar tur es, among other measur es intended to r educe travel ti me w ith public tr anspor t.
REFERENCES
Alpizar, F., and Carl sson, F. 2001. Policy Implicati ons and Analysis of the Deter minants of Tr avel Mode Choi ce: An Applicati on of Choi ce Exper iment s to Metr opolitan Costa Rica. Wor king Paper s in Economi cs no. 56. Depar t ment of Economics, Götebor g Univer sity. Sweden.
Gebeyehu,M and Tak ano, S. 2007. Diagnostic Evaluation of Public Tr ansportation Mode Choice in Addis Ababa.Jour nal of Publi c Tr anspor t at ion, Vol. 10, No. 4, 2007.pp 27-50
Hensher , D.A. 1998. The imbalance between car and public transport use in ur ban Australia: w hy does it exist?. Transpor t Policy, 5, pp. 193-204
McCarthy. P. S. 2001. Tr anspor tat ion Economics, Theory and Pract ice; A Case
St udy Appr oach. Massachusett s: Blackw ellpublisher s Inc.
Meyer, M.D. 1999. Demand management as an element of t r anspor tati on policy: using car r ots and stickts to infl uence t r avel behavior. Tr anspor t ation
Resear ch Par t A, 33, pp. 575-599
Muk al a, P. K. and M. Chunchu. 2011. Mode choice modelli ng for inter city tr anspor t ation in Indi a: A case of Guwahati to five met r o cities.
Int er nat i onal Jour nal of Ear t h Sciences and Engineer ing, vol. 04, no. 06 SPL, pp. 364-374
ur ban tr anspor t: an inter nation r eview on tr ends and effect s. Transpor t
Policy, 29, pp. 264-274
Nur deen. A., R. A. O. Rahmat, and A. Ismail. 2007. Modeling of t ransportation behavior for coer cive measur es for car dri ving in Kuala Lumpur . ARPN
Jour nal of Engineer ing and Applied Sciences, Vol. 2, no.2, pp.18-24
Paulley, N., Balcombe, R., Mackett, R., Tither idge, H., Pr eston, J., War dman, M., Shir es, J., Whi te, P. 2006, The demand for public tr anspor t: the effects of far es, quali ty of service, income and car ow ner ship. Transpor t Policy, 13, pp. 295-306
Setiaw an, R. 2013. Fixing Indonesia’s Public Transport Woes. Comment ar y
Ar t icle on The Jakar t a Globe. Nov. 4th. 2013. Retr ieved July 27 2014 fr om http:/ / w w w .thejakartagl obe.com/ opinion/ commentary/ fi xing-indonesias-public-tr anspor t-woes/
Shy, Oz. 1995. Indust r ial Organization Theory and Applicat ions. Cambr idge: MIT
Pr ess.
Sutomo, H., Dikun, S., Tumew u, W., 1993. Tr anspor t Problems, Policies and Cur r ent Resear ch and Education in Indonesi a : An Over view . IATSS