Pro
fi
le distribution and temporal changes of sulphate and nitrate contents and
related soil properties under beech and spruce forests
Václav Tejnecký
a,⁎
, Monika Bradová
a, Lubo
š
Bor
ů
vka
a, Karel N
ě
me
č
ek
a, Ond
ř
ej
Š
ebek
b,
Antonín Nikodem
a, Jitka Zenáhlíková
c, Jan Rejzek
c, Ond
ř
ej Drábek
aaDepartment of Soil Science and Soil Protection, Faculty of Agrobiology, Food and Natural Resources, Czech University of Life Sciences Prague, Kamýcká 129, 165 21 Prague 6, Czech Republic bLaboratories of the Geological Institutes, Faculty of Science, Charles University in Prague, Albertov 6, 128 43 Prague 2, Czech Republic
cDepartment of Silviculture, Faculty of Forestry and Wood Sciences, Czech University of Life Sciences Prague, Kamýcká 129, 165 21 Prague 6, Czech Republic
H I G H L I G H T S
►Distribution of sulphate and nitrate in the soil profile
►Sulphate and nitrate in acid forest soil under different vegetation covers ►Soil properties influencing the distribution of inorganic anions.
a b s t r a c t
a r t i c l e
i n f o
Article history:
Received 18 June 2012
Received in revised form 11 October 2012 Accepted 12 October 2012
Available online xxxx
Keywords:
Soil acidification Vegetation cover Forest soils Anions Sulphate Nitrate
The behaviour of principal inorganic anions in forest soils, originating mainly from acid deposition, strongly influences the forest ecosystem response on acidification. The aim of this study was to describe seasonal and temporal changes of sulphate and nitrate contents and related soil properties under beech and spruce forests in a region heavily impacted by acidification. The Jizera Mountains area (Czech Republic) was chosen as such a representative mountainous soil ecosystem. Soil samples were collected at monthly intervals from April to October during the years 2008–2010 under both beech and spruce stands. Soil samples were collected from surface fermentation (F) and humified (H) organic horizons, humic (A) organo-mineral horizons and subsur-face mineral (B) horizons (cambic or spodic). A deionised water extract was applied to unsieved fresh samples and the content of anions in these extracts was determined by ion chromatography (IC).
In the studied soil profiles, the lowest amount of SO42−was found in the organo-mineral A horizons under both types of vegetation. Under spruce the highest amount of SO42−was determined in mineral spodic (B) horizons, where a strong sorption influence of Fe and Al oxy-hydroxides is expected. Under beech the highest amount was observed in the surface organic F horizons (forestfloor). The amount of NO3−is highest in the F horizons and de-creases with increasing soil profile depth under both types of vegetation. A significantly higher amount of NO3− was determined in soils under the beech stand compared to spruce. For both soil environments–under beech and also spruce stands–we have determined a general increase of water-extractable SO42−and NO3−during the whole monitoring period. The behaviour of SO42−and NO3−in the soils is strongly related to the dynamics of soil organic matter and particularly to the DOC.
© 2012 Elsevier B.V. All rights reserved.
1. Introduction
Principal inorganic anions (Cl−, SO 4
2−and NO 3
−) are introduced
into the environment mainly by dry and wet depositions. These anions have a major impact on soil chemical and biological processes, forest health status and quality of surface waters (DeHayes et al., 1999; Krug and Frink, 1983; Puhe and Ulrich, 2001).
Deposition of SO42−and NO 3−is signi
ficantly affected by
anthropogen-ic emissions of SO2and NOx. Since 1985 there was a significant decrease
in the deposition of SO2and NOxin the Czech and Slovak Republics. By
the year 2000 the deposition of SO2had decreased by about 87% and
de-position of NOxhad decreased by about 51% (Kopáček and Veselý, 2005).
The decrease of SO42−deposition has been observed since 1990.Prechtel et al. (2001)report the decrease by about 38–82% on a European scale. However, pools of organically bound S (originating from the years of high S depositions) represent an internal source of SO42−in the soil
envi-ronment. Thus, this SO42−source can strongly affect the recovery of
an-thropogenically acidified soil environments (Mitchell et al., 2011). A faster degradation rate of soil organic matter (SOM) is attributed to the decreased deposition of SO42−and NO
3
−. In the same time, the amount
of dissolved organic carbon (DOC), observed in surface waters of North –
⁎ Corresponding author. Tel.: +420 224382759.
E-mail address:[email protected](V. Tejnecký).
0048-9697/$–see front matter © 2012 Elsevier B.V. All rights reserved. http://dx.doi.org/10.1016/j.scitotenv.2012.10.053
Contents lists available atSciVerse ScienceDirect
Science of the Total Environment
America and Europe, exhibited an increasing trend (De Wit et al., 2007; Monteith et al., 2007). Nowadays, the deposition of N compounds re-mains on a constant level. Nevertheless, a decrease of dissolved inorganic nitrogen forms (DIN) in surface waters has been reported. It was shown that the distribution and movement of DIN are significantly influenced by S deposition, depth of surface organic horizons and C/N ratios in forest
floors (Oulehle et al., 2008).
The type of vegetation cover strongly affects not only soil characteris-tics but also the amount of deposited S and N compounds. The difference between deposition caused by coniferous and broad-leaved species is ap-parent in basic soil characteristics, mainly in soil pH (De Schrijver et al., 2007; Rothe et al., 2002). Whilst studying clear-cut areas,Drábek et al. (2007)observed changes in Al speciation and pH in soils under different vegetation covers. Generally, it is coniferous vegetation cover that catches more of the dry deposition as opposed to broad leaved vegetation cover or clear cut-areas. The difference is caused by the higher specific surface of needles compared to leaves or grass and by the fact that needles are present the whole year, unlike leaves of deciduous species. Thus, the coniferous forests have higher interception of dust and gases. These deposits are consequently washed by precipitation into the soil environ-ment (Augusto et al., 2002; Berger et al., 2008; Rothe et al., 2002; Vannier et al., 1993).
Mayer et al. (1995)andZhang et al. (1998)concluded that the mineralization of carbon-bound S was a considerable source of SO42−
in soil solutions of acidic forest soils.Alewell et al. (1999)also identified that the organic S was determined as the main S pool in forest soils; moreover, they claimed that adsorption/desoption of SO42−plays an
im-portant role in the retention of S in forest watershed ecosystems.
Ukonmaanaho and Starr (2002)studied an acidified watershed and they found that organic soil layers are particularly important for N retention and in contrast, deeper soil mineral layers (containing S sorbents—Al and Fe hydroxide) are crucial for S retention.
Seasonal trends of SO42−and NO
3−contents in stream waters have
been reported (Likens et al., 2002; Oulehle et al., 2008). The accumulation of snow and its subsequent melting plays a major role in the dynamic of SO42−output from soils and their input into streamflows during the year
(Likens et al., 2002). Tree uptake was identified as the main mechanism that controls the amount of NO3−in watershed ecosystems during the
year (low values in midsummer and high values in winter) (Oulehle et al., 2008).
The aim of this work is to i) monitor the amount of water-extractable anions, namely SO42−and NO
3−, in soils under beech and spruce forests
af-fected by anthropogenic acidification and ii) assess seasonal and annual trends in the distribution and behaviour of these anions.
2. Materials and methods
2.1. Site description
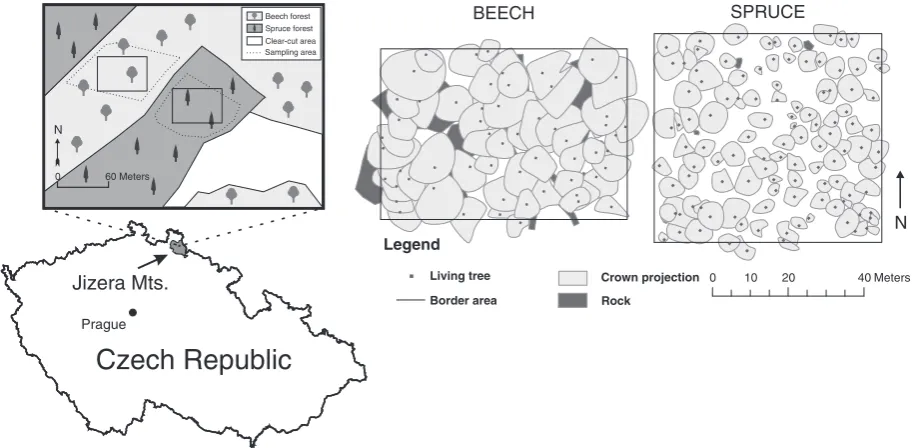
The principal part of the study was carried out on the locality Paličník in the Jizera Mountains located in the north of the Czech Republic (Fig. 1). The altitude of both studied plots ranges from 635 (bottom edge) to 680 (upper edge) m a.s.l. Annual precipitation is approximately 1200 mm and the annual mean temperature 4–7°°C (Balcar et al., 2012; Remrova and Císlerová, 2010). The climate is strictly identical between sites. Veg-etation cover is formed mainly by acidophilic beechwood (forest domi-nated byFagus sylvatica L.) and spruce monoculture (forest dominated byPicea abies[L.]Karst.) with a dominance ofCalamagrostis arundinacea
(L.) Roth andCalamagrostis villosa(Chaix ex Vill.) J. F. Gmel. in the herbal layer; the clear-cut area is predominantly covered byC. villosa(Chaix ex Vill.) J. F. Gmel. (Tejnecký et al., 2010). The average stand height is 28.6 m in the spruce forest and 32.4 m in the beech forest. Average crown area is 14.7 m2(spruce forest) and 32.4 m2(beech forest). Soils are developed
from medium-grained porphyric granite to granodiorite of the Upper Carboniferous age (Cháb et al., 2007). The soils were classified according to the World Reference Base for Soil Resources (WRB, 2006). The prevail-ing soil types are Entic and Haplic Podzols (et PZ, ha PZ) under spruce for-est and Aluminic Cambisols (au CM) under beech forfor-est.
The water regime of the studied area was previously described by (Batysta et al., 2010).
2.2. Soil sampling and sample treatment
Soil samples were collected on two adjacent areas; one covered with beech forest and one with spruce forest (Tejnecký et al., 2010). Sampling was carried out monthly in the period from April to October 2008–2010 (from April to November in 2009). Each time, three new soil pits were dug on each area, with two pits closer to the opposite edges and one close to the centre of the area. Following this rule, the particular place for each pit was selected randomly. The distance between pits was
Prague
at least 20 m. Soil samples were collected from all horizons with suffi -cient thickness. In all cases, samples were collected from surface fer-mentation (F) and humified (H) organic horizons and subsurface B horizons (cambic or spodic). Where possible, samples from the surface organo-mineral (humic, A) horizon were also collected. In total, 132 soil pits were described and sampled during the sampling period and 492 samples were collected.
Two permanent research plots (PRP) in the spruce stand (60×55 m) and in the beech stand (65×45 m) have been created in the investigated area since 2010 (Fig. 1).
Collected samples were immediately treated and analysed in the laboratory. Each sample was thoroughly mixed and then divided into two parts. Thefirst part was analysed in a“fresh”state representing actual soil moisture. The moisture was determined gravimetrically. The second part of each soil sample was air dried and sieved through a 2 mm sieve.
2.3. Sample analyses
2.3.1. Analysed soil characteristics
Fresh samples were subjected to a deionised water extracting agent (ratio soil/water 1:10 w/v, 24 h extraction on a reciprocal shaker at a stable laboratory temperature). The suspension was then centrifuged at 4000 rpm for 15 min;finally, extracts werefiltrated through a 0.45μm
nylon membranefilter (Cronus Membrane Filter Nylon, GB). In aqueous extracts the following chemical parameters were analysed: selected inorganic anions (F−, SO
4 2−, NO
3
−and Cl−) with ion chromatography
(IC) with suppressed conductivity, Al content with inductively coupled plasma–optical emission spectrometer (see details below). Dissolved or-ganic carbon (DOC) content was determined by a modified wet dichro-mate oxidation method according toYakovchenko and Sikora (1998)
and Zbíral (2004). Results were compared for selected soil samples with results of TOC Analyser (Apollo 9000HS, Central Laboratory of the Czech Geological Survey) (Tejnecký et al., in preparation). A significant correlation between results by the two methods was obtained (data not shown). All results were recalculated to soil dry weight.
Active and exchangeable pH (pHH2Oand pHKCl) were determined
on dried and sieved soil samples potentiometrically (pH metre inoLab pH level 1 WTW, Germany); ratio soil/water or 0.2 M KCl was 1:10 w/v.
2.3.2. Analytical equipment
The IC method for determination of inorganic anions was performed by means of the ion chromatograph ICS 90 (Dionex, USA) equipped with IonPac AS14A (Dionex, USA) guard and analytical columns were used. The eluent composition was 8.0 mM Na2CO3/1.0 mM NaHCO3
andflow rate was set to 1 mL min−1. To suppress eluent conductivity
an AMMS 300—4 mm suppressor (Dionex, USA) and 25 mM H2SO4
re-agent was used. The eluent conductivity was even further suppressed by the carbon removal device CRD 300—4 mm (Dionex, USA) and 0.2 M NaOH solution. Samples were introduced by the autosampler AS-DV (Dionex, USA). Chromatograms were processed and evaluated using the software Chromeleon 6.80 (Dionex, USA). The methodology
of the anion determination was based on the application manual of the IC instrument producer (Dionex, 2000; Dionex, 2003) and the US EPA methodology for water analysis (US EPA, 1993). Standards were prepared by dilution from 1 g L−1anion concentrates (Analytika, CZ)
and deionised water (conductivityb0.055μS cm−1; Millipore, USA) in
the range of 0.1–50 mg L−1. The following determination limits were
calculated according toCerjan Stefanovićet al. (2001): Cl−0.19, SO 4 2−
0.56, NO3−0.56 mg L−1.
The concentration of extracted Al was determined on an iCAP 6500 Radial ICP Emission spectrometer (Thermo Scientific, UK) equipped with a concentric nebulizer and cyclonic spray chamber. The radial plas-ma instrument was chosen to reduce plas-matrix interference. Standard ref-erence materials NIST 1640 and NIST 1643d were used to check the quality of the element determination in the aqueous extract. Aluminium concentration was determined at the wavelength 167.079 nm, determi-nation limit=0.05 mg Al L−1.
2.4. Statistical analyses
Stratigraphics XVI.I Centurion was used for statistical analyses. Basic statistical analyses such as simple and multiple regression and correlation and multivariate analysis of variance (MANOVA) were used.
3. Results and discussion
3.1. Basic soil characteristics
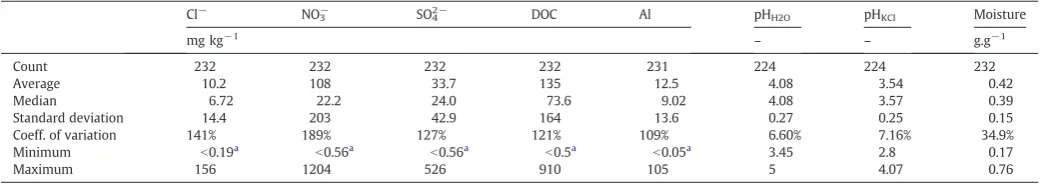
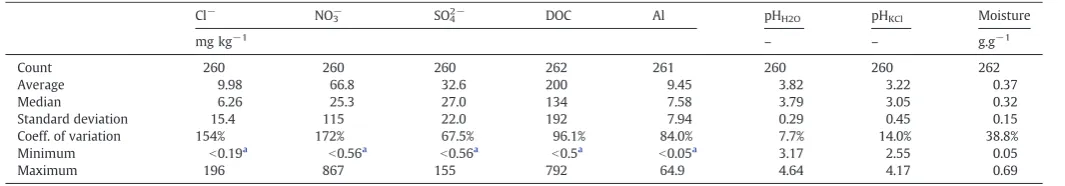
Tables 1 and 2summarise the basic soil properties and their statis-tical parameters for soils under beech and spruce vegetation cover. All sampled forest soils were strongly acidic. Under beech, active pH (pHH2O) ranged from 3.45 to 5.00, and exchangeable pH (pHKCl) values
ranged from 2.80 to 4.07 (Table 1). Under spruce, pHH2Oranged from
3.17 to 4.64, and pHKClvalues ranged from 2.55 to 4.17 (Table 2). In
comparison, soils under spruce forest were more acidic (3.82±0.29) than beech forest (4.08±0.27).
3.2. Water extractable anions in soil
The period under consideration was 3 years–22 months of sam-pling. Sampling month, vegetation cover, and soil horizons were con-sidered by means of MANOVA as the main factors influencing SO42−
and NO3−content in soil. The main factors influencing SO
42−were
de-termined to be the sampled horizon (F-ratio=12.33, pb0.001) and
month of sampling (F-ratio=3.52, pb0.001). The least important factor
for all samples was soil vegetation cover (F-ratio=0.01, p=0.906). The amount of water extractable NO3−was also mainly influenced by the
sampled horizon (F-ratio=30.97, pb0.001) and month of sampling
(F-ratio=12.05, pb0.001). However, the influence of soil vegetation
cover was also significant in the case of nitrates (F-ratio=9.57, p= 0.002). The various influences on the amount of SO42−and NO
3 −are
discussed separately in the following section.
Table 1
Basic statistical parameters of soil properties for the total set of soil beech samples.
Cl− NO
3
− SO
4
2− DOC Al pH
H2O pHKCl Moisture
mg kg−1 – – g.g−1
Count 232 232 232 232 231 224 224 232
Average 10.2 108 33.7 135 12.5 4.08 3.54 0.42
Median 6.72 22.2 24.0 73.6 9.02 4.08 3.57 0.39
Standard deviation 14.4 203 42.9 164 13.6 0.27 0.25 0.15
Coeff. of variation 141% 189% 127% 121% 109% 6.60% 7.16% 34.9%
Minimum b0.19a b0.56a b0.56a b0.5a b0.05a 3.45 2.8 0.17
Maximum 156 1204 526 910 105 5 4.07 0.76
Recalculations to dry sample weight.
aDetermination limits of the used analytical methods (mg L−1).
3.3. Distribution of anions in the soil profile
We have observed significant differences in anion distribution within soil profiles during the investigated period of time. The largest amount of SO42−under beech stands was identi
fied in the organic F
horizon (55.5±4.84 mg kg−1). The determined amount subsequently
decreases with depth to the lowest average value which was observed in the A organo-mineral horizon (17.2±7.59 mg kg−1). The deepest B
horizons exhibit a significantly higher amount of SO42−, compared to A
horizons (Table 3). In the case of the spruce stand, we have observed that the amount of SO42−follows the pattern: F>H>A
bB. Thus, a high
amount was found in F, less in H and the lowest amount was determined in the A horizons. However, the largest amount of SO42− (40.2±
2.11 mg kg−1) was determined for the mineral B horizon (Table 3).
Non-silicate Al and Fe forms and soil organic matter are very important soil constituents which significantly influence SO42−sorption (Sokolova and Alekseeva, 2008). The proportional share of Fe oxy-hydroxides can be roughly estimated from the soil colour determined by means of Munsell's colour scale (Scheinost and Schwertmann, 1999). We have ob-served differences in colour between cambic and spodic horizons for the studied soil environment. The cambic horizons have generally darker colours: brown–dark brown (7.5 YR, 4/4 value/chroma). The spodic ho-rizons are brighter in colour: light brown (7.5–10 YR, 5/6 value/chroma) and it can be expected that they have a higher content of Fe and Al oxy-hydroxides. It suggests that there is a higher amount of positive-ly charged sorption sites in spodic horizons leading to a stronger ability to bind sulphate anions. Another factor contributing to the release of SO42−can be the decomposition of S containing organic
matter (Mitchell et al., 2011).Kaiser et al. (2002)reported that in acidic soils only about 40–50% of organic carbon (OC) is contained in subsurface horizons, so the rest of the OC is located in mineral horizons—such as B horizons. The amount of soil water extractable OC was found to be significantly (p=0.005) higher for the spruce stand (62.8±7.32 mg kg−1) compared to the value determined for the beech
stand (32.1±7.72 mg kg−1), which could imply a stronger organic S
pool in soils under spruce.
The amount of NO3−(Table 4) determined in F and H horizons of
the beech forest stand was the highest and it was decreasing with in-creasing depth. The lowest NO3−content (26.1±18.4 mg kg−1) was
determined in the B horizons. A similar trend of NO3− was also
noted for the spruce stand. The highest NO3−amount was observed
in the F horizon, a significantly decreasing amount was further deter-mined for H, A and B horizons. The lowest amounts were deterdeter-mined in organo-mineral (15.0±11.8 mg kg−1) and mineral B (15.4±
9.61 mg kg−1) (Table 4) horizons. The distribution of NO 3 −in the
soil profile is significantly influenced by i) the continuous supply of NO3−by means of dry and wet deposition (Aber et al., 1989) and
ii) decomposition of soil organic matter and litter fall (Prescott, 2002). Albers et al. (2004)describe faster decomposition of litter fall in the environment under beech stands in comparison to that under spruce stands. Moreover, they claim that beech litter is a more favourable source of N for microorganisms, compared to spruce litter (Albers et al., 2004).
A significantly higher amount of NO3−was determined in the
sur-face horizons of the beech stand compared to the spruce stand (Table 4).Christiansen et al. (2006)also described higher soil satura-tion by NO3−and elevated NO3−leaching under beech stands
com-pared to spruce stands. The principal source of NO3−, utilised by
microorganisms and vegetation in the environment of the beech stand, seems to be from the decomposition of soil organic matter. According toChristiansen et al. (2006), this phenomenon is caused by the fact that the soils under beech stands have a higher nutrient content and a more favourable C:N ratio, in comparison to the condi-tions under spruce stands.
3.4. The relationship of water extractable sulphates and nitrates with other soil characteristics
Table 5shows correlations of SO42−and NO
3−contents with other
soil characteristics in the F and B horizons under spruce and beech forests. A fairly close and significant correlation between the content of SO42−and NO
3
−was found in the F horizons under both forest types
(r=0.444, at pb0.001 for F horizon under beech forest and r=0.579,
at pb0.001 for F horizon under spruce forest). A similar correlation
was also reported in stream waters e.g., byLikens et al. (2002). The content of SO42−in the F horizon is not significantly related to pH.
Sul-phates in the F horizons show positive correlations with DOC content. The release of SO42−from decomposed soil organic matter was
recent-ly reported byMitchell et al. (2011). Soil organic matter mineraliza-tion thus yields not only S, but also DOC (Kalbitz et al., 2000). Under
Table 3
Mean and 95% LSD interval of water extractable SO42−in beech and spruce forests (mg kg−1).
Horizon Beech SO42−(mg kg−1) Spruce SO 4
2−(mg kg−1)
Count LS mean LS sigma H.G. Count LS mean LS sigma H.G.
F 66 55.5 4.84 b 63 37.7 2.33 b
H 66 28.4 4.84 a 66 30.8 2.28 b
A 29 17.2 7.59 a 53 17.6 2.59 a
B 72 25.8 4.68 a 79 40.2 2.11 c
H.G. homogeneous groups.
Table 4
Mean and 95% LSD interval of water extractable NO3−in beech and spruce forests (mg kg−1).
Horizon Beech NO3−(mg kg−1) Spruce NO 3
−(mg kg−1)
Count LS mean LS sigma H.G. Count LS mean LS sigma H.G.
F 66 191 19.0 b 63 142 10.7 c
H 66 147 19.0 b 66 91.5 10.4 b
A 29 37.2 29.8 a 53 15.0 11.8 a
B 71 26.1 18.4 a 79 15.4 9.61 a
H.G. homogeneous groups.
Table 2
Basic statistical parameters of soil properties for the total set of soil spruce samples.
Cl− NO
3− SO
4
2− DOC Al pH
H2O pHKCl Moisture
mg kg−1 – – g.g−1
Count 260 260 260 262 261 260 260 262
Average 9.98 66.8 32.6 200 9.45 3.82 3.22 0.37
Median 6.26 25.3 27.0 134 7.58 3.79 3.05 0.32
Standard deviation 15.4 115 22.0 192 7.94 0.29 0.45 0.15
Coeff. of variation 154% 172% 67.5% 96.1% 84.0% 7.7% 14.0% 38.8%
Minimum b0.19a b0.56a b0.56a b0.5a b0.05a 3.17 2.55 0.05
Maximum 196 867 155 792 64.9 4.64 4.17 0.69
Recalculations to dry sample weight.
aDetermination limits of the used analytical methods (mg L−1).
beech forest, the content of SO42−and NO 3
−in the F horizons is
posi-tively correlated with water extractable Al. In contrast, under spruce forest the correlation between NO3−and Al is negative, and the
corre-lation between SO42−and Al is not signi
ficant. It suggests that
sul-phate anions play a more important role as ligands complexing Al under beech than under spruce, where the Al complexing role is played more by DOC (Tejnecký et al., 2010). This difference between soils under spruce and beech forests is supported by a closer correla-tion between Al and DOC in the F horizons under spruce (r=0.694, at pb0.001) than under beech (r=0.270, at p=0.03). The fact that DOC,
SO42−and NO
3−are important factors of Al mobility and speciation has
been reported by numerous authors (e.g.Drábek et al., 2005; Norton and Veselý, 2003).
Little to no effect of other determined soil characteristics on the content of SO42−and NO
3−could be determined in the B horizons
(Table 5).
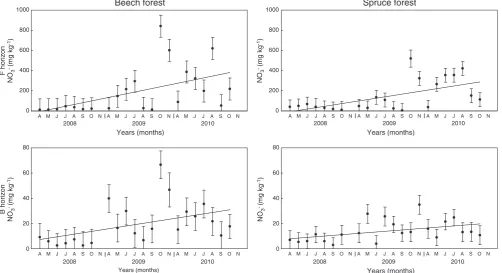
3.5. Temporal variations of the content of water extractable anions
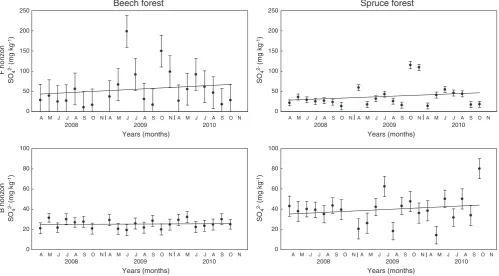
Short-term temporal and also seasonal variations in the forest ecosystem influence the soil vegetation cover, soil fauna and soil chemical and biological processes. The seasonality itself is pronounced in a scale of weeks or months. The main seasonal changes are the vege-tation growth, and the composition and activity of populations of organ-isms. All of these changes also strongly influence the soil environment (Puhe and Ulrich, 2001). During three years (2008–2010) the changes in the amount of water extractable SO42−and NO
3−were recorded. The
seasonal changes in organic F and mineral B horizons are shown in
Figs. 2 and 3. It is apparent that for the time period of concern, the amount of SO42−is increasing in F and B soil horizons under both
beech and spruce stands, though the rate of S deposition in Central Europe is decreasing or at least constant (CHMI, 2009; Kopáček and Veselý, 2005). We can easily explain this slight increasing trend of SO42−. Generally, the majority–around 95%–of total soil S is bound in
the structure of soil organic matter (Scherer, 2009), which seems to be increasingly decomposing and transforming. These changes of organic matter were reported e.g., byHruška et al. (2009). These authors have found an increasing release of DOC to surface water streams in the mountainous regions of the Czech Republic. The close correlation of the amount of aqueous extractable DOC and SO42−in soil F horizons was
discussed inSection 3.3.
The temporal variation of anion content under the beech stand is wider in F horizons compared to B horizons. A similar phenomenon was also observed in soils under spruce stands. However, the variability of SO42−in the B horizons was still quite strong under spruce. This is
A M J J A S O N A M J J A S O N A M J J A S O N A M J J A S O N A M J J A S O N A M J J A S O N
Fig. 2.Seasonal variation of water extractable SO42−in organic F (top) and mineral B (bottom) soil horizons under beech (left) and spruce (right) forests (mg kg−1; mean and 95% LSD interval).
Table 5
Correlation coefficients of the relationships between SO42−, NO 3
−and other soil charac-teristics in F and B horizons under spruce and beech forests.
F horizon
Moisture 0.228 0.216 −0.210 0.207
B horizon
Al 0.114 0.082 −0.010 0.110
Moisture 0.283⁎ 0.205 −0.163 −0.019
⁎ Significant at the probability level of 0.05.
⁎⁎Significant at the probability level of 0.01.
⁎⁎⁎Significant at the probability level of 0.001.
caused by larger amounts of SO42−in the B horizon under the spruce
stand compared to the beech forest (Fig. 2).
The amount of water extractable NO3−had increased slightly during
the investigated time period (Fig. 3). This fact cannot be attributed to the increased deposition of NO3−and NH
4+. Nitrate deposition in Central
Europe and in the Czech Republic remains constant or exhibits a slightly decreasing trend (CHMI, 2009; Kopáček and Veselý, 2005). The slightly increasing annual temperature might be a possible explanation for the increase of water extractable NO3−(Veselý et al., 2003) and thus
accel-erated nitrification processes. Moreover, nitrification processes are pos-itively affected by increasing pH (Ste-Marie and Paré, 1999). In the studied environment we have observed pH increases on both stands (Fig. 4). A higher variability for the water extractable NO3−content can
be seen in organic F horizons compared to the mineral B horizons. The influence of biota is apparent here and also a larger vulnerability of F horizons to external factors (precipitation, temperature, etc.) can be
observed (e.g.Attiwill and Adams, 1993). The increased amount of avail-able NO3−can in
fluence the vegetation cover, accelerate the environmen-tal acidification and indirectly increase Al toxicity (Bowman et al., 2008).
4. Conclusions
In soil profiles, the lowest amount of SO42−was found in the
organo-mineral A horizons under both types of vegetation. However, while under spruce stands the highest amount of SO42−was determined in
the mineral spodic (B) horizons (where a strong influence of Fe and Al oxy-hydroxides is expected), under beech stands the highest amount was observed in the surface organic F horizons (forestfloor). The amount of NO3−is highest in the F horizons and decreases with increasing soil pro-file depth under both types of vegetation. A significantly higher amount of NO3−was determined in soils under the beech stand compared to spruce.
F horizon pH
H20
Years (months) Years (months)
5.0
4.5
4.0
3.5
30
pH
H20
5.0
4.5
4.0
3.5
30
Fig. 4.Seasonal variation of active soil pH in organic F horizons under beech (left) and spruce (right) forests (mean and 95% LSD interval). Years (months)
A M J J A S O N A M J J A S O N A M J J A S O N
2009 2010 2008
Years (months)
Years (months)
A M J J A S O N A M J J A S O N A M J J A S O N
2009 2010 2008
A M J J A S O N A M J J A S O N A M J J A S O N
2009 2010 2008
Years (months)
A M J J A S O N A M J J A S O N A M J J A S O N
2009 2010 2008
NO
3
- (mg kg -1)
F horizon
NO
3
- (mg kg -1)
B horizon
Spruce forest
Beech forest
0 200 400 600 800 1000
NO
3
- (mg kg -1)
0 200 400 600 800 1000
0 20 40 60 80
NO
3
- (mg kg -1)
0 20 40 60 80
Fig. 3.Seasonal variation of water extractable NO3−in organic F (top) and mineral B (bottom) soil horizons under beech (left) and spruce (right) forests (mg kg−1; mean and 95% LSD interval).
Higher temporal variability in the investigated characteristics was proven for organic horizons compared to mineral horizons. The be-haviour of sulphates and nitrates in the soils is strongly related to the dynamics of soil organic matter and particularly to the DOC. An im-portant role of SO42−in Al behaviour was shown in organic horizons
under beech forest, while under spruce forest the effect of DOC is more prominent.
For both soil environments–under beech and also spruce stands–
we have determined a general increase of water-extractable SO42−
and NO3−contents during the whole monitoring period. It indicates
a long-lasting impact of these acidificants accumulated in soils, even though the rate of acid deposition has decreased significantly in the last decades.
Acknowledgements
This study was supported by the Czech University of Life Sciences Prague (project no. CIGA 1313/213106), the Ministry of Agriculture of the Czech Republic (project no. QI92A216) and the Ministry of Educa-tion, Youth and Sports (project no. MSM 6046070901 and project no. MSM 0021620855). We would like to express our gratitude to Chris Ash for editing the manuscript. The authors thank the associate editor Dr. Charlotte Poschenrieder and anonymous reviewers for their valu-able comments and suggestions to the manuscript.
References
Aber JD, Nadelhoffer KJ, Steudler P, Melillo JM. Nitrogen saturation in northern forest ecosystems. Bioscience 1989;39:378–86.
Albers D, Migge S, Schaefer M, Scheu S. Decomposition of beech leaves (Fagus sylvatica) and spruce needles (Picea abies) in pure and mixed stands of beech and spruce. Soil Biol Biochem 2004;36:155–64.
Alewell C, Mitchell MJ, Likens GE, Krouse HR. Sources of stream sulfate at the Hubbard Brook Experimental Forest: long-term analyses using stable isotopes. Biogeochem-istry 1999;44:281–99.
Attiwill PM, Adams MA. Nutrient cycling in forests. New Phytol 1993;124:561–82. Augusto L, Ranger J, Binkley D, Rothe A. Impact of several common tree species of European
temperate forests on soil fertility. Ann For Sci 2002;59:233–53.
Balcar V,Špulák O, Kacálek D, KunešI. Climatic conditions in the Jizerka experimental plot—I. Precipitation and soil moisture. Zpravy Lesnickeho Vyzkumu 2012;57:74–81. Batysta M, Borůvka L, Drábek O, Tejnecký V,Šebek O. Laboratory assay of aluminium
transport through intact soil sample under controlled conditions. Soil Water Res 2010;5:69–74.
Berger TW, Untersteiner H, Schume H, Jost G. Throughfallfluxes in a secondary spruce (Picea abies), a beech (Fagus sylvatica) and a mixed spruce-beech stand. For Ecol Manage 2008;255:605–18.
Bowman WD, Cleveland CC, Halada L, Hresko J, Baron JS. Negative impact of nitrogen deposition on soil buffering capacity. Nat Geosci 2008;1:767–70.
Cerjan Stefanović Š, Bolanča T,ĆurkovićL. Simultaneous determination of six inorganic anions in drinking water by non-suppressed ion chromatography. J Chromatogr A 2001;918:325–34.
Cháb J, Stráník Z, EliášM. Geological Map of the Czech Republic 1 : 500 000. Prague: Czech Geological Survey; 2007.
CHMI. Air pollution on the Czech Republic territory in 2008—yearbook. Prague: Czech Hydrometeorological Institute; 2009.
Christiansen JR, Elberling B, Jansson PE. Modelling water balance and nitrate leaching in temperate Norway spruce and beech forests located on the same soil type with the CoupModel. For Ecol Manage 2006;237:545–56.
De Schrijver A, Geudens G, Augusto L, Staelens J, Mertens J, Wuyts K, et al. The effect of forest type on throughfall deposition and seepageflux: a review. Oecologia 2007;153:663–74. De Wit HA, Mulder J, Hindar A, Hole L. Long-term increase in dissolved organic carbon in streamwaters in Norway is response to reduced acid deposition. Environ Sci Technol 2007;41(22):7706–13.
DeHayes DH, Schaberg PG, Hawley GJ, Strimbeck GR. Acid rain impacts on calcium nu-trition and forest health. Bioscience 1999;49:789–800.
Dionex. Application note 135: determination of inorganic anions in wastewater by ion chromatography. Dionex Corporation; 2000.
Dionex. IonPac AS14 product manual, document no. 031199. Dionex Corporation; 2003.
Drábek O, Mládková L, Borůvka L, Száková J, Nikodem A, Němeček K. Comparison of water-soluble and exchangeable forms of Al in acid forest soils. J Inorg Biochem 2005;99:1788–95.
Drábek O, Borůvka L, PavlůL, Nikodem A, Pírková I, Vacek O. Grass cover on forest clear-cut areas ameliorates some soil chemical properties. J Inorg Biochem 2007;101:1224–33. Hruška J, Krám P, McDowell WH, Oulehle F. Increased dissolved organic carbon (DOC)
in Central European streams is driven by reductions in ionic strength rather than climate change or decreasing acidity. Environ Sci Technol 2009;43:4320–6. Kaiser K, Eusterhues K, Rumpel C, Guggenberger G, Kögel-Knabner I. Stabilization of
or-ganic matter by soil minerals—investigations of density and particle-size fractions from two acid forest soils. J Plant Nutr Soil Sci 2002;165:451–9.
Kalbitz K, Solinger S, Park JH, Michalzik B, Matzner E. Controls on the dynamics dissolved organic matter in soils: a review. Soil Sci 2000;165:277–304. Kopáček J, Veselý J. Sulfur and nitrogen emissions in the Czech Republic and Slovakia
from 1850 till 2000. Atmos Environ 2005;39:2179–88.
Krug EC, Frink CR. Acid rain on acid soil: a new perspective. Science 1983;221:520–5. Likens GE, Driscoll CT, Buso DC, Mitchell MJ, Lovett GM, Bailey SW, et al. The
biogeo-chemistry of sulfur at Hubbard Brook. Biogeobiogeo-chemistry 2002;60:235–316. Mayer B, Feger K, Giesemann A, Jäger H-J. Interpretation of sulfur cycling in two
catch-ments in the Black Forest (Germany) using stable sulfur and oxygen isotope data. Biogeochemistry 1995;30:31–58.
Mitchell M, Lovett G, Bailey S, Beall F, Burns D, Buso D, et al. Comparisons of watershed sulfur budgets in southeast Canada and northeast US: new approaches and impli-cations. Biogeochemistry 2011;103:181–207.
Monteith DT, Stoddard JL, Evans CD, de Wit HA, Forsius M, Hogasen T, et al. Dissolved organic carbon trends resulting from changes in atmospheric deposition chemistry. Nature 2007;450:537–40.
Norton SA, Veselý J. Acidification and acid rain. In: Lollar BS, editor. Environmental geo-chemistry, treatise on geogeo-chemistry, vol. 9. Amsterdam: Elsevier; 2003. p. 367–406. Oulehle F, McDowell WH, Aitkenhead-Peterson JA, Kram P, Hruska J, Navratil T, et al.
Long-term trends in stream nitrate concentrations and losses across watersheds un-dergoing recovery from acidification in the Czech Republic. Ecosystems 2008;11: 410–25.
Prechtel A, Alewell C, Armbruster M, Bittersohl J, Cullen JM, Evans CD, et al. Response of sulphur dynamics in European catchments to decreasing sulphate deposition. Hydrol Earth Syst Sci 2001;5:311–25.
Prescott CE. The influence of the forest canopy on nutrient cycling. Tree Physiol 2002;22: 1193–200.
Puhe J, Ulrich B. Global climate change and human impacts on forest ecosystems. Berlin: Springer; 2001.
Remrova M, Císlerová M. Analysis of climate change effects on evapotranspiration in the watershed uhlířská in the Jizera mountains. Soil Water Res 2010;5:28–38. Rothe A, Huber C, Kreutzer K, Weis W. Deposition and soil leaching in stands of Norway
spruce and European Beech: results from the Höglwald research in comparison with other European case studies. Plant Soil 2002;240:33–45.
Scheinost AC, Schwertmann U. Color identification of iron oxides and hydroxysulfates: use and limitation. Soil Sci Soc Am J 1999;63:1463–71.
Scherer HW. Sulfur in soils. J Plant Nutr Soil Sci 2009;172:326–35.
Sokolova T, Alekseeva S. Adsorption of sulfate ions by soils (a review). Eurasian Soil Sci 2008;41:140–8.
Ste-Marie C, Paré D. Soil, pH and N availability effects on net nitrification in the forest floors of a range of boreal forest stands. Soil Biol Biochem 1999;31:1579–89. Tejnecký V, Drábek O, Borůvka L, Nikodem A, KopáčJ, Vokurková P, et al. Seasonal
var-iation of water extractable aluminium forms in acidified forest organic soils under different vegetation cover. Biogeochemistry 2010;101:151–63.
Tejnecký V, Drábek O, Nikodem A, Vokurková P, Němeček K, Borůvka L. Fast determi-nation of water extractable organic carbon from forest soil. in preparation. Ukonmaanaho L, Starr M. Major nutrients and acidity: budgets and trends at four
re-mote boreal stands in Finland during the 1990s. Sci Total Environ 2002;297:21–41. US EPA. The determination of inorganic anions in water by ion chromatography. U.S.
Environmental Protection Agency Method 300.0; 1993.
Vannier C, Didon-Lescot JF, Lelong F, Guillet B. Distribution of sulphur forms in soils from beech and spruce forests of Mont Lozère (France). Plant Soil 1993;154:197–209. Veselý J, Majer V, Kopáček J, Norton SA. Increasing temperature decreases aluminium
concentration in Central European lakes recovering from acidification. Limnol Oceanogr 2003;48(6):2346–54.
WRB. World reference base for soil resources 2006—a framework for international classi-fication, correlation and communication. World Reference Base for Soil Resources; 2006.
Yakovchenko VP, Sikora LJ. Modified dichromate method for determining low concen-trations of extractable organic carbon in soil. Commun Soil Sci Plant Anal 1998;29: 421–33.
Zbíral J. Analýza půd III-jednotné pracoví postupy, Brno: SKZÚZ; 2004 (in Czech). Zhang Y, Mitchell MJ, Christ M, Likens GE, Krouse HR. Stable sulfur isotopic
biogeo-chemistry of the Hubbard Brook Experimental Forest, New Hampshire. Biogeo-chemistry 1998;41:259–75.