Perkembangan Harga Kacang Kedelai Tingkat Produsen di Provinsi Sumatera Utara Tahun 2003-2012
Tahun
Jan
Feb
Maret
April
Mei
Juni
Juli
Agust
Sept
Okt
Nov
Des
2003 2,733 2,733 2,375 2,921 2,676 2,333 2,766 2,200 2,050 2,100 2,150 2,200
2004 3,000 2,400 2,800 2,850 2,400 2,600 2,425 2,500 2,475 2,495 2,500 2,550
2005 2,900 2,575 2,800 2,850 3,100 3,300 3,175 3,250 3,350 3,400 3,400 3,550
2006 3,604 4,000 5,175 4,100 4,165 4,124 4,200 4,200 4,225 4,200 4,196 4,200
2007 4,160 4,195 4,138 4,125 4,152 4,140 4,152 4,138 4,225 4,260 4,263 7,500
2008 5,715 6,700 6,970 7,242 6,490 7,257 7,016 7,216 6,770 6,837 7,627 7,250
2009 7,459 7,146 6,549 6,750 6,871 6,741 6,456 6,915 5,946 6,748 6,802 5,833
2010 6,833 7,625 6,500 5,625 5,204 4,958 7,563 9,000 6,750 8,000 8,300 7,400
2011 9,514 8,144 8,919 6,300 6,763 6,775 6,383 8,756 7,885 10,786 7,258 9,379
Lampiran 2
PERKEMBANGAN HARGA INTERNASIONAL KACANG KEDELAI
TAHUN 2003 S/D 2012 (US$ per
metric
ton)
Tahun
Jan
Februari Maret
April
Mei
Juni
Juli
Agustus September Oktober November Desember
2003 208.68 209.64 210.24 221.72 232.43 229.81 214.05 208.24 231.72 269.01 279.74 283.21
2004 300.94 316.58 360.72 363.55 347.91 320.69 289.82 225.81 206.47 193.45 95.84 198.62
2005 195.66 197.59 233.18 228.76 233.46 254.74 253.35 230.43 212.02 211.17 210.70 216.54
2006 214.01 214.37 212.71 208.90 217.36 216.50 217.25 203.84 199.31 217.89 244.00 243.31
2007 255.87 278.04 276.96 270.39 283.21 302.83 313.48 309.01 347.56 358.40 389.02 423.08
2008 461.72 508.22 495.69 482.79 489.09 552.47 554.15 472.07 437.84 338.78 329.14 318.81
2009 364.72 341.27 333.66 374.47 422.28 445.15 398.16 408.96 349.05 354.86 370.71 379.30
2010 358.97 344.66 348.95 357.65 349.06 348.51 370.98 379.46 390.23 427.18 459.96 483.76
2011 511.10 512.05 498.74 501.47 498.77 499.77 501.83 501.42 490.91 446.02 428.83 420.05
2012 441.73 461.56 496.29 529.42 520.93 522.33 609.45 622.91 615.18 565.53 533.03 534.79
sumber :
Perkembangan Produksi Kedelai di Kabupaten/Kota Sumatera Utara
Kabupaten/Kota Perkembangan Tahun 2007-2011
2007 2008 2009 2010 2011 2012
Nias 0 0 0 1 2
Madina 195 530 922 433 393 565
Tapanuli Selatan 801 1,194 435 862 507 693
Tapanuli Tengah 244 265 221 159 73 44
Tapanuli Utara 0 0 0 0 0 5
Toba Samosir 0 0 0 0 1 0
Labuhan Batu 146 489 132 3 59 312
Asahan 91 467 402 21 66 65
Simalungun 77 245 758 494 327 407
Dairi 0 0 6 0 0 0
Karo 27 144 0 0 0 0
Deli Serdang 1,470 2,644 3,305 1,604 1,607 1,241
Langkat 781 3,333 3,932 1,769 856 877
Nias Selatan 0 0 0 0 0 0
Humbang Hasundutan 3 1 5 8 8 7
Pakpak Barat 0 0 0 12 10 0
Samosir 62 34 20 5 2 39
Serdang Bedagai 234 1,922 2,415 2,787 6,331 319
Batu Bara 0 166 799 356 89 84
Padang Lawas Utara 0 0 204 51 127 160
Padang Lawas 0 0 319 300 265 223
Labuhan Batu Selatan 0 0 0 20 36 29
Labuhan Batu Utara 0 0 0 348 384 307
Nias Utara 0 0 0 0 40 1
Nias Barat 0 0 0 0 0 0
Tanjung Balai 0 4 0 2 0 0
Pematang Siantar 0 0 0 0 0 0
Tebing Tinggi 1 3 2 0 0 0
Medan 7 9 8 0 0 0
Binjai 183 182 264 180 217 13
Padang Sidimpuan 23 16 57 24 28 27
Gunung Sitoli 0 0 0 0 0 0
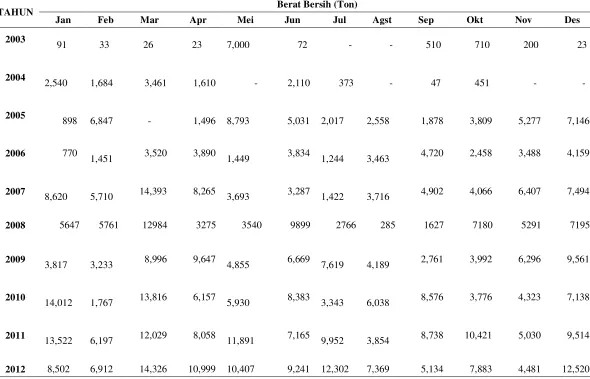
Lampiran 4
Tabel Impor Kedelai di Sumatera Utara Tahun 2003-2012
TAHUN Berat Bersih (Ton)
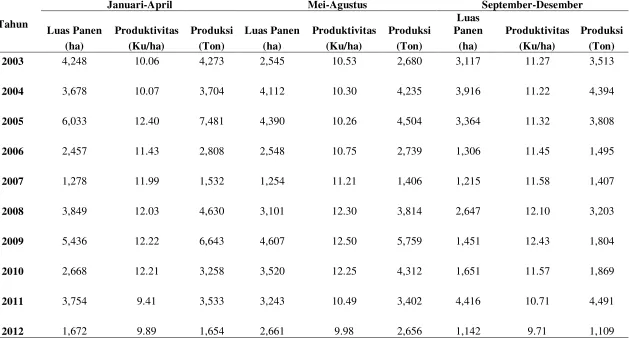
Tabel Produksi Kedelai di Provinsi Sumatera Utara Tahun 2008-2012
Tahun
Januari-April Mei-Agustus September-Desember
Luas Panen Produktivitas Produksi Luas Panen Produktivitas Produksi
Luas
Panen Produktivitas Produksi
(ha) (Ku/ha) (Ton) (ha) (Ku/ha) (Ton) (ha) (Ku/ha) (Ton)
2003 4,248 10.06 4,273 2,545 10.53 2,680 3,117 11.27 3,513
2004 3,678 10.07 3,704 4,112 10.30 4,235 3,916 11.22 4,394
2005 6,033 12.40 7,481 4,390 10.26 4,504 3,364 11.32 3,808
2006 2,457 11.43 2,808 2,548 10.75 2,739 1,306 11.45 1,495
2007 1,278 11.99 1,532 1,254 11.21 1,406 1,215 11.58 1,407
2008 3,849 12.03 4,630 3,101 12.30 3,814 2,647 12.10 3,203
2009 5,436 12.22 6,643 4,607 12.50 5,759 1,451 12.43 1,804
2010 2,668 12.21 3,258 3,520 12.25 4,312 1,651 11.57 1,869
2011 3,754 9.41 3,533 3,243 10.49 3,402 4,416 10.71 4,491
2012 1,672 9.89 1,654 2,661 9.98 2,656 1,142 9.71 1,109
Lampiran 6. Permintaan Kedelai Di Provinsi Sumatera Utara
Tahun
Permintaan Kedelai
(Ton)
2003
14,706
2004
15,399
2005
80,866
2006
84,056
2007
56,580
2008
57,314
2009
58,111
2010
58,167
2011
61,302
2012
60,115
Sumber: Badan Ketahanan Pangan
Lampiran 7. Penawaran Kedelai Di Provinsi Sumatera Utara
Tahun
Produksi
(Ton)
Impor
(Ton)
Total Penawaran
(Ton)
2003
10,466
38,821
49,287
2004
12,333
12,275
24,608
2005
15,739
45,752
61,545
2006
7,042
34,445
41,487
2007
4,345
58,597
62,942
2008
11,647
65,449
77,096
2009
14,206
71,636
85,842
2010
9,438
83,259
92,697
2011
11,426
106,370
117,796
2012
5,420
110,075
115,495
Your trial period for SPSS for Windows will expire in 14 days. NEW FILE.
DATASET NAME DataSet1 WINDOW=FRONT. DATASET ACTIVATE DataSet1.
DATASET CLOSE DataSet0. CORRELATIONS
/VARIABLES=lokal dunia /PRINT=TWOTAIL NOSIG
/STATISTICS DESCRIPTIVES XPROD
/MISSING=PAIRWISE.
Correlations
Descriptive Statistics
Mean Std. Deviation N
lokal 5.2293E3 2499.72397 30
dunia 3.5067E2 118.37166 30
Correlations
lokal dunia
lokal Pearson Correlation 1 .850**
Sig. (2-tailed) .000
Sum of Squares and
Cross-products 1.812E8 7.294E6
Covariance 6.249E6 2.515E5
N 30 30
dunia Pearson Correlation .850** 1
Sig. (2-tailed) .000
Sum of Squares and
Cross-products 7.294E6 4.063E5
Covariance 2.515E5 1.401E4
N 30 30
Lampiran 9. Output Korelasi Harga Kedelai Lokal Dengan Volume Impor Kedelai
CORRELATIONS
/VARIABLES=Harga Impor /PRINT=TWOTAIL NOSIG /STATISTICS DESCRIPTIVES
/MISSING=PAIRWISE.
Correlations
Descriptive Statistics
Mean Std. Deviation N
Harga 5.2293E3 2499.72397 30
Impor 5.0828E3 3102.75179 30
Correlations
Harga Impor
Harga Pearson Correlation 1 .784**
Sig. (2-tailed) .000
N 30 30
Impor Pearson Correlation .784** 1
Sig. (2-tailed) .000
N 30 30
Lampiran 10. Output Korelasi Produksi Kedelai Dengan Volume Impor Produksi
CORRELATIONS
/VARIABLES=impor produksi /PRINT=TWOTAIL NOSIG /STATISTICS DESCRIPTIVES
/MISSING=PAIRWISE.
Correlations
Descriptive Statistics
Mean Std. Deviation N
x 5.0819E3 3102.58476 30
y 3.4039E3 1559.96368 30
Correlations
x y
x Pearson Correlation 1 -.220
Sig. (2-tailed) .243
N 30 30
y Pearson Correlation -.220 1
Sig. (2-tailed) .243
Lampiran 10a. Output Korelasi Produksi Kedelai Dengan Volume Impor Produksi Dengan Lag 1
Bulan
CORRELATIONS
/VARIABLES=impor produksi /PRINT=TWOTAIL NOSIG /STATISTICS DESCRIPTIVES
/MISSING=PAIRWISE.
Correlations
Descriptive Statistics
Mean Std. Deviation N
impor 5.2566E3 3005.42259 29
produksi 3.4830E3 1525.06557 29
Descriptive Statistics
Mean Std. Deviation N
impor 5.2566E3 3005.42259 29
Bulan
DATASET ACTIVATE DataSet1. DATASET CLOSE DataSet2. NEW FILE.
DATASET NAME DataSet3 WINDOW=FRONT. CORRELATIONS
/VARIABLES=impor produksi /PRINT=TWOTAIL NOSIG /STATISTICS DESCRIPTIVES
/MISSING=PAIRWISE.
Correlations
Descriptive Statistics
Mean Std. Deviation N
impor 5.3812E3 2983.32866 28
produksi 3.5125E3 1544.58127 28
Correlations
impor produksi
impor Pearson Correlation 1 -.031
Sig. (2-tailed) .875
N 28 28
produksi Pearson Correlation -.031 1
Sig. (2-tailed) .875
Lampiran 11. Output Korelasi Produksi Kedelai harga kedelai lokal
CORRELATIONS
/VARIABLES=produksi harga /PRINT=TWOTAIL NOSIG /STATISTICS DESCRIPTIVES
/MISSING=PAIRWISE.
Correlations
Descriptive Statistics
Mean Std. Deviation N
produksi 3.4039E3 1559.96368 30
harga 5.0459E3 1290.08742 30
Correlations
produksi harga
produksi Pearson Correlation 1 -.178
Sig. (2-tailed) .348
N 30 30
harga Pearson Correlation -.178 1
Sig. (2-tailed) .348