Int. J. of GEOMATE, Month, Year, Vol.00, No.00 (Sl. No. 00), pp. 00-00
Fakultas Teknik, Universitas Negeri Padang
4th International Conference on Technical and Vocation Education and Training
Padang : November 9-11, 2017
THE EFFECT OF STRATEGY OF TRAINING MODELS IN
LEARNING ELECTRICAL INSTALLATION
Elfizon
1, Syamsuarnis
2dan Oriza Candra
3123
Department of Electrical Engineering, Fakulty of Engineering, Universitas Negeri Padang
Email:
[email protected]
,
[email protected]
ABSTRACT: This study aimed to determine the effect of model training strategy on learning outcomes in electrical installation courses in engineering majors of electrical engineering faculty of state universities of padang. The subjects of this study are students of electrical engineering education courses (S1) force 2016. Which consists of 55 people as an experimental class and 52 people as a control class. Assessment instruments using performance appraisal, and the data obtained were analyzed using two-tension test (t-test). From the results of data analysis showed that the class using the model training strategy has a higher average value when compared with students using conventional learning. Based on the calculation of t-test obtained t arithmetic> t table is 4.21255> 2.0042. Thus, the hypothesis in this study is that there is a significant influence of electrical electrical installation learning results in electrical engineering majors engineering faculty of state universities padang
Keywords: Influence Strategy, Training Model, Learning Outcomes
1. INTRODUCTION
The success rate of Indonesia's national development in all fields will depend on human resources as the nation's asset in optimizing and maximizing the development of all human resources. These efforts can be done and pursued through education, both through formal education and non-formal education channels. One institution on a formal education path that prepares its graduates to have excellence in the world of work and the Industrial world.
Education is a process of establishing qualified human resources. Improving the quality of education can only be achieved through improving the quality of the learning process which leads to improving the quality of educational outcomes. The realization of the government's efforts to prepare educational graduates in entering a challenging era of globalization is to apply an industry-minded curriculum.
Student competence will be formed and developed through a learning process that uses student-centered, learning-oriented approaches and methods. This learning will provide a challenging and fun learning experience. Students are expected to use the in-depth approach and strategic approach to learning, not just learning to remember information or learn to graduate. Lessons that need to be developed by lecturers in the framework of the formation of competencies are interactions that enable students to build knowledge, attitudes and skills through various transformations of learning experience.
Associated with learning to improve student competence, curriculum development needs
to be oriented to the world of work. Law No. 20/2003 on National Education System emphasizes the autonomy of educational units, competency-based curriculum and paradigm shift from teaching to learning. The existence of paradigm shift from teaching to learning requires a more innovative learning pattern, giving priority to increase the potential of study subjects, learning facilities, and facilities and infrastructure. The establishment of student competence is an educational process that requires the involvement of various parties, among others, family, school / campus, work / industry, government and professional associations.
State University of Padang (UNP) as one of the institution of higher education institution in Indonesia always strives to realize the national education function stated in Act on National Education System Number 20 Year 2003, that is to develop the ability and form the character and civilization of dignified nation in order to educate the life and organize the process education to produce educators who will participate to build the country through education.
Int. J. of GEOMATE, Month, Year, Vol.00, No.00 (Sl. No. 00), pp. 00-00
Fakultas Teknik, Universitas Negeri Padang
4th International Conference on Technical and Vocation Education and Training
Padang : November 9-11, 2017
of them with the application of effective learning strategies.
One of the learning strategies is learning model training strategy. Learning strategy Model Training is a strategy that focuses on job skills that are skills that involve all the senses, and are trained repeatedly in the form of organized and coordinated actions.
Learning Model Strategy Training will improve students' activity. Because in this strategy there is a demonstration or performance by lecturers before the students do lectures so that the students understand the procedure of doing the practice properly and correctly, the practice of diversion with the assignment of practical tasks that are more complex than the practical tasks taught so that students can develop an understanding of the material if linked to problems in the field or industry by giving the task of a visit to the industry so that students can match the lessons learned in school with the state of the field or the industry.
The lesson uses the Training Model's strategy of 6 stages: (1) Submission of objectives, (2) Explanation of supporting materials, (3)
Demonstration of performance, (4) Practice
simulation, (5) Transfer Practices and (6) Industrial Visits. Problems occur above, the author tries to improve learning outcomes is by comparing the students learning outcomes between learning strategies Model dengan conventional, this is in accordance with the title of research that the authors do is Influence Strategy Model Training on the recovery of electrical installations in engineering
majors Electrical Engineering Faculty State
University Padang.
2. RESEARCH METHODS
The method of investigation is the experimental method. This research consists of two classes namely control class and experiment class. In the experimental class in doing the learning in accordance with the procedure of model training strategy and on the control class is done by conventional learning.
This type of research is an experimental research that is categorized into quasi-experimental type. The research was conducted at the Department of Electrical Engineering Faculty of Engineering State University of Padang in Electrical Engineering Education Study Program S1 As the subject of research is the 3rd semester students of Electrical Engineering Education Study Program (S1) FT UNP which took the electrical installations totaling 107 people, consisting of two classes ie 2LA and 2LB. Where 2LA is an experimental class using Model Training strategy and 2LB is a control class that uses conventional learning. The determination of this class is done randomly from the existing class, this is done because the average score of student's GPA
does not differ significantly. Thus, based on the t-test the two classes have the same initial capability. The research design used in this study is presented as follows:
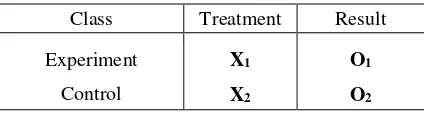
Table 1. Research Design
Class Treatment Result
Experiment
O1 = The results of the experimental
O2 = Results of a control class performance assessment
The type of instrument used in this study is the assessment of performance. According to Depdiknas (2009: 14) "Performance assessment is an assessment done by observing the activities of learners in doing something". Validity in this research is content validity. Implementation Content validity is by arranging aspects to be assessed in the electrical installation courses according to the curriculum in the Department of Electrical Engineering FT UNP.
After data collected conducted anilisa data. Prior to testing the research hypothesis, student learning outcomes must meet the requirements of normality test and homogeneity test:
1. Normality test
Normality test is used to determine the distribution of student learning outcomes, whether the data is normally distributed or not. Normality test is done by using chi-square test proposed by Riduwan (2006: 124). Criteria test normality, if ≤ then the data is normally distributed.
2. Homogeneity test
Homogeneity test was conducted to find out whether the research data has the same variance. The homogeneity test of experimental class and control class is done using F test with the formula of Sudjana (2005: 249). Homogeneity testing criterion is if Fhitung <Ftabel means data have homogeneous variance, other wise if Fcount> Ftabel means data not homogeneous.
3. Hypothesis test
Int. J. of GEOMATE, Month, Year, Vol.00, No.00 (Sl. No. 00), pp. 00-00
Fakultas Teknik, Universitas Negeri Padang
4th International Conference on Technical and Vocation Education and Training
Padang : November 9-11, 2017
hypothesis are:
a. Ho accepted if t count <ttabel and Ha rejected. b. Ho is rejected if thitung> ttabel and Ha accepted.
3. RESULTS AND DISCUSSION Data Description
This research was conducted in semester July - December 2017 Academic Calendar State University of Padang. The implementation of the research consists of 6 lecture meetings that include; Design of Electric Installation of Sedehana House, Electricity Installation of Multi-storey Home,
Maintenance and Maintenance of Electrical
Installation. Based on the result of the research, it is found that the average value () of the students' experimental learning result is higher than the control class as can be seen in table 2
Table 2. Average and Percentage Completion of Experiment and Control Class
Class Amount Result
Experiment (2LA)
Control (2LB)
55 52
85,5 81,3 Strategy Training model is essentially a strategy that can facilitate students in the lecture so that students become skilled. By using the strategy Training model requires students to work in stages and structured, which includes: the preparation stage, demonstration, imitation, and practice.
Based on the description and analysis of data that has been done on student learning outcomes on electrical installation learning through learning model training in the experimental class and conventional learning on the electronics engineering education faculty of Universitas Negeri Padang, there are differences in learning outcomes between the experimental class and the control class. This difference can be seen from the highest value of the experimental class 96 with an average of 85.5, while the control grade is at a high of 89 with an average of 81.41. Thus, it can be stated that the students 'learning outcomes in the experimental class is higher than the students' learning outcomes of the control class.
Strategy Training model is essentially a strategy that can facilitate students in the lecture so that students become skilled. By using the strategy Training model requires students to work in stages and structured, which includes: the preparation stage, demonstration, imitation, and practice. The following is the normal curve of the experimental class and control class as follows:
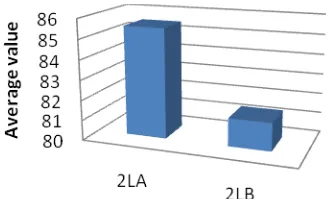
Figure 1. Graph of Experiment and Control Class
From the graph the difference in the mean values of the two classes taught. Where the experimental class (2LA) obtained an average value of 85.5, while for control class (2LB) taught by conventional methods obtained an average value of 81.4.
Data Analysis
The data analysis here is done manually. Differences in learning outcomes were analyzed using t-test by first looking at whether the subject was normally distributed and had a homogeneous variant. Therefore tested normality and homogeneity test.
a. Normality test
Based on the calculation results in the
experimental class at can = 6.37 and
control class at can = 0.908. While for
both classes at significance level with α =
0,05, got = 9,488. It can be concluded that
the data obtained from the two classes is normally distributed.
b. Homogeneity Test
Test homogeneity to see whether the two classes are homogeneous or not. Based on calculation results obtained Fhitung is 1.389 and Ftable value in experiment class and control class with dk numerator = 23 and dk denominator = 22 is 2.04 at significance level of 0.05. Thus Fcount <Ftable means that both classes have a homogeneous variance.
c. Hypothesis test
Based on the normality test and
Int. J. of GEOMATE, Month, Year, Vol.00, No.00 (Sl. No. 00), pp. 00-00
Fakultas Teknik, Universitas Negeri Padang
4th International Conference on Technical and Vocation Education and Training
Padang : November 9-11, 2017
value of ttable = 2.0157. Thus tacount> ttable, then Ho is rejected and also receive Ha. It can be concluded that there are significant differences in student learning outcomes that apply the strategy of Model Training with the conventional learning model in the electrical engineering practice course on the students of Electrical Engineering Education (S1) Program of Electrical Engineering Faculty of Engineering Universitas Negeri Padang.
Discussion
Based on the results of data analysis there are significant differences in student learning outcomes that apply the strategy of Model Training with the conventional learning model in Electrical Installation courses in the lectures of undergraduate students (S1) majoring in Electrical Engineering Faculty of Engineering, State University of Padang. Where the application of Strategy Strategy Model Training scores higher than students who are taught conventionally.
This is because the Model Training strategy is able to generate student motivation in learning, so that students are more motivated to improve their learning achievement. Model Strategy Training is a strategy that teaches how to bring students to learn and teach. The atmosphere of training means, not to bring students to the industrial world with sophisticated equipment.
But how the industry trains newly skilled employees is imitated by the strategy of the Model Training Program consists of five main models: 1) work instructions, 2) work methods, 3) employment relations, 4) work safety, 5) program development. All these programs are used to support the success of learning in the course. Application of learning strategy of Model Training in Electric Installation lecture able to increase student motivation in lecture. This is seen with the seriousness of students in doing all jobshet at every lecture meeting.
4. CONCLUSION Conclusion
Based on data analysis and discussion, it can be concluded that the learning motivation mahasisawa using Model Training strategy is better than conventional learning. This can be seen from the learning result obtained by the students who apply the strategy of the Training model is higher than the class that takes the conventional model. Thus there are differences in learning outcomes are significant between the application of training models on electrical installation lectures with
conventional learning on students Electrical
Engineering Education Studies (S1) Faculty of
Engineering Universitas Negeri Padang
Suggestions
It is expected that FT-UNP Leaders, especially lecturers to always try to improve student's learning achievement and foster self-reliance learning so as to complete the study on time with good achievement quality.
For the next researcher, it is suggested that the factors that influence the learning achievement are included as part of the research so that the research result is more objective.
5. REFERENCES
[1]Ahmad Sabri. 2006. Strategi belajar Mengajar &
Micro Teaching. Jakarta: Quantum Teaching.
[2] Depdiknas.2008. Pengembangan Perangkat
Penilaian Psikomotor. Jakarta: Gramedia. [3] Direktorat pembinaan SMA. juknis penyusunan
perangkat penilaian psikomotor di sma. http://teguhsasmitosdp1.files.wordpress.com/- juknis-penyusunan-perangkat-penilaian-psikomotor-_isi- revisi__0104.pdf[04/2/2013].
[4] Hermawati. 2012. Efektifitas Model
Pembelajaran Berbasis Proyek Terhadap Hasil Belajar Psikomotor Siswa Kelas X TITL pada Mata Diklat IPBB di SMKN 1 Batipuh. Skripsi tidak diterbitkan. Padang: UNP
[5] Kementerian Pendidikan Nasional. 2011. Buku
Panduan Penulisan Tugas Akhir/Skripsi Universitas Negeri Padang. Padang: Kemenas.
[6] Made Wena. 2008. Strategi Pembejalajaran
Inovatif Kontemporer.Jakarta: Bumi Aksara.
[7] Nana Sudjana. 2005. Dasar-dasar proses belajar
mengajar. Bandung: Sinar Baru Algesindo.
[8] Nana Sudjana. 2005. Methode Statistika.
Bandung: Tarsito
[9] Oemar Hamalik. 2004. Proses Belajar
Mengajar. Jakarta: Bumi Aksara
[10] Riduwan. 2006. Belajar Mudah Penelitian
Untuk Guru, Karyawan dan Penelitia Pemula.
Bandung: Alfabeta.
[11] Singgih Santoso. 2009. Panduan Lengkap
Menguasai Statistik dengan SPSS 17. Jakarta:
Gramedia Suharsimi Arikunto.2006. Prosedur
Penelitian Suatu Pendekatan Praktik. Jakarta: Rineka Cipta.
[12] Sastriadi. 2013. Model Pembelajaran
konvensional. http://mediafunia.blogspot.com /2013/01.
[13] Wina Sanjaya. 2006. Strategi Pembelajaran
Fakultas Teknik, Universitas Negeri Padang
4th International Conference on Technical and Vocation Education and Training
Padang : November 9-11, 2017
SOFTWARE DEVELOPMENT OF CONCENTRATION SELECTION
WITH INTEREST TEST BASED ON INTELLIGENT SYSTEM
Elin Haerani
Information Technology UIN Sultan Syarif Kasim Riau
Jl. H.R. Soebrantas No.155 KM 15 Simpang Baru Panam, Pekanbaru, Indonesia
ABSTRACT : Universities are designed to prepare graduates who are ready to enter the workforce and are able to develop a professional attitude. Educational institutions such as the University need a form of decisions in determining the right concentration for students, so that the learning process can be achieved well in accordance with the interests. The decision is very influential on the process of handling the choice of alternative concentration, choosing an appropriate concentration of interest will also have an impact on the research focus for the final assignment of students. To know the right concentration for students is not easy, because of the limited information possessed by students. This research develops student concentration selection system in Electrical Engineering Department UIN Suska Riau. The system was developed with three ktiteria, ie, interest tests using psychological tests, prerequisite concentration course grades, and GPA. The system is built using an intelligent system model that is Fuzzy Multiple Attribute Decision Making (FMADM) web-based, which helps the Department in the selection process and helps the process of career guidance on students. With this selection system, the Department can be provide the most suitable concentration decisions with interest in student concentration.
Keyword : Concentration, Interest, Intelligent, Career Guidance, Decision
1. INTRODUCTION
Interests are a source of motivation that encourages a person to do what one wants if the person is given the freedom to choose (Elisabeth B. Hurlock, 1999). Interest is also a tendency of a person's general behavior to be attracted to a certain group of things (Guilford in Munandir, 1997). Learning or working in areas that match the skills and interests, will bring motivation in studying or living it. Developing an interest is aimed at getting people to learn well and in the future able to work in a field that suits their abilities and interests so they can develop the capability to learn and work
optimally with great enthusiasm.
Related to the importance of choosing majors in accordance with the interests, which is one way to help the process of career counseling to students at the university. Career guidance is the most important thing to direct students according to their interests and potential. The selection of the right career in the students, will give satisfaction and will achieve maximum results.
University are part of vocational education developed in Indonesia, designed to prepare students or graduates who are ready to enter the workforce and are able to develop a professional attitude in the vocational field. University
graduates, are expected to be productive
individuals who are able to work as a manpower and have the readiness to face work competition. In accordance with the provisions set forth in the National Standard of Higher Education (SN
DIKTI) in 2014, each study program shall be supplemented with learning achievement targets (Belmawa, 2015). Educational institutions such as the University often require a form of decision in determining the appropriate concentration for the students so as to achieve good learning in accordance with student interests.
The decision is very influential on the process of handling alternative concentrations to be selected, choosing an appropriate concentration of interest will also have an impact on the research focus for the final assignment of the students. But to know the right concentration is not an easy thing, because of limited information owned by students. The various constraints in determining the concentration according to the criteria will confuse the students. According to Sutejo, et al (2012), in the process of selection of competence skills can affect the success of students at the time of study at the University and after graduation later.
In the selection process of determining the concentration in the Department of Electrical Engineering which acts as a decision-making is the Chief of the Department, the person acting as the decision maker performs comparisons on several alternatives, including evaluating the calculations. The process of choosing a concentration at the Department of Electrical UIN Suska Riau today, is done by conventional method where the selection process is carried out with some administrative
requirements by looking at student value
Fakultas Teknik, Universitas Negeri Padang
4th International Conference on Technical and Vocation Education and Training
Padang : November 9-11, 2017
of the selection process will take time in the process because it is still done manually. In addition, the selection process is also vulnerable to errors and obstacles in reporting results that can impact on the stage of announcement of results. The second problem is the lack of guidance to students in choosing the right concentration for themselves.
The purpose of the specialization itself is explained in the guidance of specialization issued by the Ministry of Education and Culture of the Republic of Indonesia (May, 2013) which can be described that the service of student's interest is part of the advocacy effort and facilitate the development of learners to actively develop their potential to have spiritual spiritual power , self-control, personality, intelligence, noble character, and skills needed by him, society, nation and state (direction of Article 1 number 1 of Law Number 20 Year 2003 on National Education System) so as to
achieve optimal development. Optimal
development is not limited to achievement in accordance with the intellectual capacity and interests it has, but as a condition of development that allows learners to make choices and decisions in a healthy and responsible and have a high adaptability to the dynamics of life it faces.
This study aims to develop a concentration selection system of students in the Department of Electricity UIN Suska Riau with interest tests, using an intelligent system model that is Fuzzy Multiple Attribute Decision Making (FMADM). Interest tests are used for students as a guide in choosing concentrations, the system is expected to assist the Department in the selection process and can help the Student Guidance Counseling process, and can provide concentration decisions that best suit the interests of the students.
II. LITERATURE REVIEW
A. Fuzzy Multiple Attribute Decision Making
(FMADM)
According to Kusumadewi (2007), Fuzzy Multiple Attribute Decision Making (FMADM) is a method used to find the optimal alternative of a number of alternatives with certain criteria. The core of FMADM is to determine the weight value for each attribute, then proceed with the ranking process that will select the alternatives already given. Basically there are 3 approaches to finding attribute weight value, that is subjective approach, objective approach and integration approach between subjective & objective. Each approach has its advantages and disadvantages. In the subjective approach the weighting value is determined by the subjectivity of the decision makers, so that several factors in the alternative ranking process can be determined freely.
Whereas in the objective approach, the weight value is calculated mathematically so that it ignores the subjectivity of the decision maker. The Fuzzy Multiple Attribute Making algorithm is:
1. Give each alternative value (Ai) on each
criterion (Cj) that has been determined, where the value is obtained based on crisp value; i = 1,2, ... m and j = 1,2, ... n.
2. Provide weight value (W) which is also
obtained based on crisp value.
3. Normalize the matrix by calculating the
normalized performance rating (rij) value of the alternative Ai on the attribute Cj based on the equation adjusted to the type of attribute (attribute benefit = MAXIMUM or cost attribute / cost = MINIMUM). If the attribute is a gain, the crisp (Xij) value of each attribute
4. Perform the ranking process by multiplying the
normalized matrix (R) with the weight value alternatives are preferred. (Kusumadewi, 2007).
There are several methods that can be used to solve FMADM problems. Among others (Kusumadewi, 2006):
a.
Weighted Product (WP)b.
ELECTREc.
Technique for Order Preference by Similarity toIdeal Solution (TOPSIS)
d.
Analytic Hierarchy Process (AHP)e.
Simple Additive Weighting Method (SAW).The SAW (Simple Additive Weighting) method is often also known as the weighted summing method. The basic concept of the SAW method is to find the weighted sum of performance ratings on each alternative on all attributes. The SAW method requires the process of normalizing the decision matrix (X) on a scale that can be compared with all the alternative ratings available. The steps are:
Fakultas Teknik, Universitas Negeri Padang
4th International Conference on Technical and Vocation Education and Training
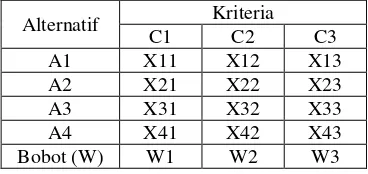
Padang : November 9-11, 2017 where each alternative has a value corresponding to the criteria. Here are the match rate tables of each alternative on each criteria:
Tabel 1-2 Rating Matches Any Alternative
Alternatif Kriteria
Then create a decision matrix from the match table:
X
=
With rij is the normalized performance rating of the alternative Ai on the attribute Cj; i = 1,2, ..., m and
r_ij : Normalized performance rating value
x_ij : The attribute value that belongs to each
The final result is obtained from the ranking process that is the sum of the normalized matrix multiplication R with the weight vector to obtain the largest value chosen as the best alternative (Ai) as the solution. (Kusumadewi, 2006). The preference value for each alternative (Vi) is given (𝑉𝑖= ∑𝑛𝑗=1𝑤𝑗𝑟𝑖𝑗
The largest value of Vi indicates that Ai's alternatives are preferred.
B. Measurements and Psychological Tests
Interest tests are a type of test instrument used in assessing individual interests in different types of activities (Chaplin, 2000). Much of interest inventory is designed to estimate individual interests in various occupations. A number of inventories also provide an analysis of interest in the educational curriculum or field of study, which in turn is related to career decisions.
The identification of students' direction of interest can be done with both test and non test approaches. A test approach is usually done using standard instruments such as psychological tests that we know. While the non-test approach is based on data from non-standard instruments, such as academic achievement, observation, interview, questionnaire, etc.
Psychological measurement is the
measurement of visible aspects of behavior, which are considered to reflect the achievements, talents, attitudes and other aspects of personality (T. Raka
Joni, 1977). In practice, psychological
measurements generally use many tests as a tool. The term psychological test is a tool for investigating the reaction or disposition of a person on the basis of his behavior. Thus the notion of psychological measurements and psychological tests are essentially the same. Its foundation lies in the process and its tools used as the basis for the use of the term in practice.
C. Various Scale In Psychology (Ordinal Scale) Ordinal scale occurs when the objects that exist in one category of a scale not only different from those objects, but also have a relationship with each other. The usual relationships we encounter among classes are: higher, more favorable, more frequent, more difficult, more mature and so on
Ordinal measurement scale provides
Fakultas Teknik, Universitas Negeri Padang
4th International Conference on Technical and Vocation Education and Training
Padang : November 9-11, 2017
characteristics possessed by a particular object or individual. This level of measurement has nominal-scale information coupled with a certain relative means of ranking that provides information on whether an object has more or less characteristics but not how many flaws and strengths.
Measurements made on an ordinal scale are objects distinguished according to their equations and in order. So can be made a sequence or a complete and regular rankings delivered classes.
Ordinal scale is a scale that is the second level of measure, which is tiered something that becomes 'more' or 'less' than others, this measure is used to sort objects from the lowest to the highest and vice versa which means researchers have made measurements on the variables studied. Example: measure sports championships, work performance, seniority of employees. For example: Answer questions such as rank: strongly disagree, disagree, neutral, agree and strongly agree can be symbolized numbers 1, 2,3,4 and 5. These numbers are only a symbol of ranking, not expressing the number.
The Ordinal scale is higher than the nominal scale, and is often also called the rank scale. This is because on an ordinal scale, the symbols of the number of measurements other than indicating the distinction also indicate the order or degree of the object as measured by certain characteristics [6]. For example the level of satisfaction of a person to the product. Can we give a number with 5 = very satisfied, 4 = satisfied, 3 = less satisfied, 2 = not satisfied and 1 = very dissatisfied. Or for example in a race, the winner is ranked 1,2,3 etc.
On an ordinal scale, unlike the nominal scale, when we want to change the numbers, it must be done sequentially from large to small or from small to large. So, should not be made 1 = very satisfied, 2 = not satisfied, 3 = satisfied dstnya. Allowable is 1 = very satisfied, 2 = satisfied, 3 = distance the satisfaction from the unsatisfied to the less satisfied. In other words too, although very satisfied we give 5 and very unsatisfied we give the number 1, we can not say that satisfaction is very satisfied five times higher than the very dissatisfied.
Just as on a nominal scale, on an ordinal scale we also can not apply standard (arithmetic) mathematical operations such as subtraction, addition, multiplication, and others. Statistical equipments that correspond to ordinal scales are also statistical tools based on numbers and proportions such as mode, frequency distribution, Chi Square and some other non-parametric
Analysis of FMADM method with SAW
Requirement Data Score value Prerequisite of concentration
selection
1) Design of Data Subsystem
This stage is the design of the analysis of the previous data management subsystem. This stage of the sculpting context diagrams, data flow diagrams and entity relationship diagrams. And next will be made data dictionary design.
2) Design Subsystem Model
This stage is the result of model analysis that is the method used in making the system. At this stage will be made a model design in the form of flowchart system and flowchart calculation FMADM method of the process of determining the ranking of alternative priority sequence.
3) Design of Dialog Subsystem
Fakultas Teknik, Universitas Negeri Padang
4th International Conference on Technical and Vocation Education and Training
Padang : November 9-11, 2017
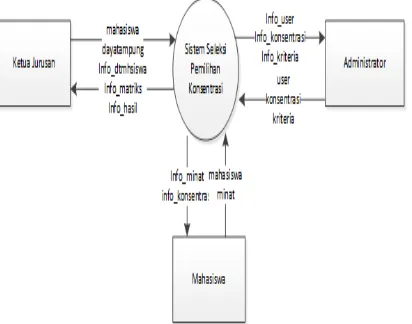
IV. ANALYSIS AND DESIGN SYSTEM Context diagram used to describe the work process of a system in general. DFD level 0 or diagram context is depicted in Figure 4.1 below:
Figure 4.1 Context diagram
Menu Structure Design, The design goal is to create a design guide at the implementation stage of the design design of the system to be built. Menu structure of decision support system of majors selection can be seen in Figure 4.2 below:
Pengembangan Model Seleksi Pemilihan Konsentrasi Jurusan Teknik Elektro UIN Suska
Perhitungan (FMADM - SAW)
Hasil Akhir
Data Mahasiswa Keluar
Data Master
Data Pengguna
Data Konsentrasi Data Kriteria
Figure 4.2 Menu Structure Design
IV. IMPLEMENTATION AND TESTING Implementation stage is a condition where the system has been analyzed and designed ready to be operated under the actual conditions, from this stage of implementation will know the success rate of analysis and design on the system to be built.
The implementation of this system is divided into two components, namely hardware and software, the following is the operational environment used in the implementation of the system:
a. Hardware
Processor: Intel Pentium Dual CPU 1.86 GHz
Memory (RAM) : 1.00 GB
System Type : 32 bits
b. Software
Operating System : Windows 8
Programming Language: PHP
DBMS : MySQL
Tools : Sublime Text
Web Browser :Mozilla Firefox
Users are divided into 3 namely the head of the department, admin majors and students. Administrator (head of department and admin) has full access rights to system, can add, change and delete master data and can see student test result report.
Students can only test interest only. Before accessing the system Students must first fill the data to get login permissions. To Fill student bios with the way to start the test.
1. Home View
Before accessing the system Admin must login first, input username and password. After Login will appear Home Page As Next:
Figure 5.1 Home View
Fakultas Teknik, Universitas Negeri Padang
4th International Conference on Technical and Vocation Education and Training
Padang : November 9-11, 2017
Selection Concentration Based Intelligent System With This Interest Test, there is the main menu that is Data administrator with submenu. Each has different sub-menus and uses. Sub menus that exist are:
a.
User Datab.
Criteria Datac.
Concentration Datad.
Course Datae.
Value Range Dataf.
Student DataThe User Submenu is a menu for managing system user data, such as add user, view, modify, and delete. The criteria submenu is a menu for managing criteria data, such as add, view, modify, and delete criteria data. Submenu Concentration is a menu to manage concentration data majors such as add, see, change, and delete the concentration. Course submenu is a menu for managing course data such as add, view, change, and delete the course. And the Range of Values submenu is a menu for managing fuzzy value range data for GPA, Subject and Interests values such as add, view, change and delete value ranges.
On the Student Data Submenu, a menu to manage student data, by first selecting the desired year and semester. Administrators can fill in MK Value, IPK Value such as add, view, modify, and delete. The administrator can see the Student Interest Value derived from the interest test process that has been done by the student. Administrators can perform the ranking process to see the student grade ratings. Below will show the various processes that have been described above in the form of images.
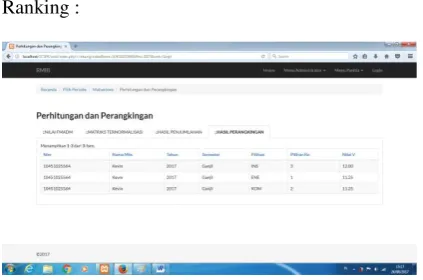
Sub-menu of Results Calculation and
Ranking :
Figure 5.3 Results Calculation and Ranking
on the Submenu of Calculation and Ranking The results can be seen by the student and concentration rankings that best match the interest of the student.
The purpose of testing is to look for errors or errors in accordance with the criteria set, the benefits of this test is that if the system is used no errors or no problems, which in essence this
application in accordance with the design and built based on the analysis described previously. There are two ways of testing that will be done that is testing the application view or using Blackbox and testing with User Acceptance Test.
1. Blackbox is an application that has been
designed and built in accordance with the wishes in terms of appearance and in terms of accuracy of data calculation process. How to test the look of this application is to call the form or display of each application process and test the correctness of the process done, whether it has been in accordance with the design made earlier. Blackbox testing is done with various tests such as menus, input, and buttons.
2. User Acceptance Test is a system testing
process given to the user with the aim to generate a conclusion whether the system has been developed is acceptable by the user or not. If the test results (testing) already meet the needs of users, it means that the system has been developed in accordance with the understanding and needs of end users (end users). Testing using the user acceptance test technique is done by giving some questions about the function and work system according to the user. In this test taken some users who act as respondents who then given some questions in the form of questionnaires.
VI. Conclusions
After completing several stages of research in establishing a system of concentration selection in this department of electrical engineering, some conclusions can be drawn:
a. the concentration selection system in this
electrical engineering department using the Fuzzy Multiple Attribute Decision Making method with Simple Additive Weighting has been built and is able to provide quick decisions to determine the best course for students.
b. The system may also recommend
concentrations for students based on areas of expertise of interest.
c. According to the table the question of user
Fakultas Teknik, Universitas Negeri Padang
4th International Conference on Technical and Vocation Education and Training
Padang : November 9-11, 2017
BIBLIOGRAPHY
Abdul Kadir, 2003, Pengenalan Sistem Informasi,
Andi, Yogyakarta.
Abror, Abd. Rachman. 1993. Psikologi Pendidikan.
Yogyakarta: Tiara WacanaYogya
Agus Suryosubroto. 2004. Sarana Prasarana
Pendidikan Jasmani. Yogyakarta: Alfabeta.
Ali, M & asrori. 2005. Psikologi Remaja,
Perkembangan Peserta Didik. Jakarta: Bumi Aksara.
Alvin Leung ,dkk 2014 “The use of interest and competence scores to predict educational choices of Chinese high school students
“Journal of Vocational Behavior 84 (2014)
385–394
Anas Sudijono. 2009. Pengantar Statistik
Pendidikan. Jakarta: Rajawali pers
Andi Kristanto. 2004. Jaringan Syaraf Tiruan
(Konsep Dasar, Algoritma, dan. Aplikasi).
Yogyakarta.
Andi Mappiare. 1994. Psikologi Remaja. Surabaya:
Usaha Nasional.
Anonim. 2003. Undang-Undang No. 20 Tahun
2003 tentang Sistem Pendidikan Nasional
Anonim. 2000. Peraturan Pemerintah Nomor 2
9 Tahun 1990 tentang Pendidikan Mene ngah. Jakarta: Depdiknas
Arikunto, Suharsimi, 1999, Prosedur Penelitian
Suatu Pendekatan Praktek, Jakarta : PT.Rineka Cipta.
Azwar Saifuddin. 2012. Penyusunan Skala
Psikologi. Yogyakarta. Pustaka Pelajar
Azwar, S, 2000. Reliabilitas dan Validitas. Edisi 3.
Yogyakarta : Pustaka Pelajar
Belmawa Ristek dikti, 2015, Panduan Penyusunan
Capai Pembelajaran,
Byram & Wenrich. 1956. Vocational Education and Practical Arts in the Community School, Macmillan Company
Carmen Camelia Vasilescu dkk , 2015, “The relationship between career interests and academic major: a comparative analysis”
Procedia - Social and Behavioral Sciences 187 ( 2015 ) 559 – 564
Conny Semiawan dkk. 1985 Pendekatan
Keterampilan Proses, Penerbit PT. Gramedia, Jakarta. New York: Mc. Graw-Hill, Book Company
Gordon B. Davis, Kerangka Dasar Sistem
Informasi Manajemen Bagian 1, PT Pustaka Binamas Pressindo, Jakarta: 1991
Hake. 1999. Analyzing change/gain
score.http://www.physics.indiana.edu. (12 Februari 2017)
Hamalik, Oemar. 2001. Proses Belajar Mengajar.
Jakarta : Bumi Aksara. _________, 2008.
Metode Diskusi.
Hidayat, Heri dan Siti Aisah. 2013. “Read Interest Co-Relational With Student Study Performance In IPS Subject Grade IV (Four) In State Elementary School 1 Pagerwangi Lembang”. International Journal Of Scientific & Tecnology Research. Vol. 2 (1): 2277-8616.
Holland, J. L., & Nichols, R.C. 1964.
Explorations of a theory of vocational choice : III. A Longitudinal study of change in major field of study. Personnel and Guideance Journal, 43, 235
– 42.
Holland, J. L. 1973. Making vocational choices.
Englewood Cliffs, NJ: Prentice Hall.
Hurlock, Elizabeth B, 1999. Psikologi
Perkembangan Suatu Pendekatan Sepanjang Rentang kehidupan, Edisi kelima, Jakarta: Erlangga
Jogiyanto. 2005. Analisis dan Desain Sistem
Informasi. Yogyakarta: Penerbit Andi.
John Killis. 1988. Hubungan Minat Kerja, Motivasi
Ekstrinsik dan Bimbingan dalam Pelajaran dengan Kecakapan Kerja Teknik Listrik Lulusan STM pada Industri-industri DIY. Tesis. Jakarta: Fakultas
Pasca Sarsana IKIPJakarta.
Khasanah, Fata Nidaul dkk, 2015. Fuzzy MADM
for Major Selection at Senior High School,
2nd Int. Conference on Information Technology, Computer and Electrical Engineering (ICITACEE), Indonesia, Oct 16-18th.
Kusumadewi, S.. 2004, Aplikasi Logika Fuzzy
Untuk Pendukung Keputusan, Graha Ilmu ,Yogyakarta
Kusumadewi, Sri., Hartati, S., Harjoko, A., dan
Wardoyo, R. 2006. Fuzzy Multi-Attribute
Decision Making (FUZZY MADM). Yogyakarta: Penerbit Graha Ilmu.
Kusumadewi, Sri., Hartati, S., Harjoko, A., dan
Wardoyo, R. 2006. Fuzzy Multi-Attribute
Decision Making (FUZZY MADM).
Fakultas Teknik, Universitas Negeri Padang
4th International Conference on Technical and Vocation Education and Training
Padang : November 9-11, 2017
M.Fikry, Detha Yurisna, Inggih Permana, 2011.
Aplikasi Pengecekan LJK Untuk Tes Psikologi RMIB Dengan Operasi Intensity Slicing. Jurnal Sains, Teknologi dan Industri, Vol. 9 No. 1.
Muliaty A.M. 2007. Evaluasi Program Pendidikan
Sistem Ganda: Suatu Penelitian Kualitatif berdasarkan Stake’s Countenance Model Mengenai Program Pendidikan Sistem Ganda pada sebuah UNIVERSITAS di Sulawesi Selatan (2005/2007).
Munandar, S.C. Utami , 1992, Mengembangkan
Bakat Anak, Jakarta :Gramedia
Munandir. 1997 . Program Bimbingan Karier di
Sekolah. Jakarta: Depdiknas Hal. 128-130. Pers)
Plomp 2007. “Educational Design Research : An Introduction”, dalam An Introduction to Educational Research. Enschede,
Netherland : National Institute for
Curriculum Development.
Purwanto, 2009, Evaluasi Hasil Belajar,
Yogyakarta: Pustaka Pelajar.
Prayitno dan Erman Amti. 1999. Dasar-dasar
Bimbingan dan Konseling. Depdikbud : Rineka Cipta.
Pressman, Roger S. Rekayasa Perangkat Lunak :
Pendekatan Praktisi (Buku Satu). Yogyakarta : Andi Offset. 2002.
Rice, P. L. 1999. Stress and Health. United States of America: Brooks/Cole
Publishing company.
Rita C. Richey, J. D. K., Wayne A. Nelson. (2009).
Developmental Research : Studies of Instructional Design and Development.
Rohman, Nanan dkk, Aplikasi Test Minat Dan
Bakat Penerimaan Mahasiswa Baru Pada Universitas Ti Garuda Nusantara Cimahi Menggunakan Visual Basic.Net, Jurnal Computech & Bisnis, Vol. 7, No. 1, Juni 2013, 13-18 ISSN 2442-4943
Siti Rahayu Hadinoto.1998. Psikologi
Perkembangan. Yogyakarta: Gajahmada University Press
Slameto. 1995. Belajar Dan Factor-faktor Yang
Mempengaruhinya (Jakarta : Rineka cipta). Edisi revisi
Slameto. 2003. Belajar dan Faktor-Faktor yang
Mempengaruhinya. Jakarta: PT. Rineka Cipta.
Sudira, Putu, 2009. Studi Mandiri Grounded
Theory. Program Pasca Sarjana Universitas Negeri Yogyakarta.
Sugiyono, 2008. Metode Penelitian Kunatitatif
Kualitatif dan R&D. Bandung
Sukadji, Soetarlinah. 2000. Psikologi Pendidikan
dan Psikologi Sekolah (Direvisi dan Dilengkapi). Depok : Universitas Indonesia.
Sukardi. 2003. Metodologi Penelitian Pendidikan
Kompetensi dan Prakteknya Jakarta: Bumi Aksara.
Sutejo, Imam. 2012, Faktor yang Mempengaruhi
Pemilihan Kompetensi Keahlian, Tingkat Pemahaman Vokasional, dan Prestasi Belajar Mahasiswa UNIVERSITAS Program Studi Keahlian Teknik
Bangunan, TESIS Program Pascasarjana UM.
Vladan Papic ,dkk, 2009, Identification of sport
talents using a web-oriented expert system with a fuzzy module, Journal Elsevier Expert Systems with Applications 36
(2009) 8830–8838
Winkel,W.S. 1996. Psikologi Pengajaran.
Jakarta.:Grasindo
Winkel,WS. 1991. Bimbingan dan Konseling di
Institusi Pendidikan. Jakarta : PT. Grasindo.
Yumarlin, MZ, 2016. Decision Support System for
Informatics Speciality in Janabadra University Yogyakarta, Citec Journal, Vol.