Network Security Through Data Analysis by Michael Collins
Copyright © 2014 Michael Collins. All rights reserved.
Printed in the United States of America.
Published by O’Reilly Media, Inc., 1005 Gravenstein Highway North, Sebastopol, CA 95472.
O’Reilly books may be purchased for educational, business, or sales promotional use. Online editions are also available for most titles (http://my.safaribooksonline.com). For more information, contact our corporate/ institutional sales department: 800-998-9938 or [email protected].
Editors: Andy Oram and Allyson MacDonald Production Editor: Nicole Shelby
Copyeditor: Gillian McGarvey Proofreader: Linley Dolby
Indexer: Judy McConville Cover Designer: Randy Comer Interior Designer: David Futato
Illustrators: Kara Ebrahim and Rebecca Demarest
February 2014: First Edition
Revision History for the First Edition: 2014-02-05: First release
See http://oreilly.com/catalog/errata.csp?isbn=9781449357900 for release details.
Nutshell Handbook, the Nutshell Handbook logo, and the O’Reilly logo are registered trademarks of O’Reilly Media, Inc. Network Security Through Data Analysis, the picture of a European Merlin, and related trade dress are trademarks of O’Reilly Media, Inc.
Many of the designations used by manufacturers and sellers to distinguish their products are claimed as trademarks. Where those designations appear in this book, and O’Reilly Media, Inc. was aware of a trademark claim, the designations have been printed in caps or initial caps.
While every precaution has been taken in the preparation of this book, the publisher and author assume no responsibility for errors or omissions, or for damages resulting from the use of the information contained herein.
ISBN: 978-1-449-35790-0
Table of Contents
Preface. . . ix
Part I. Data
1. Sensors and Detectors: An Introduction. . . 3
Vantages: How Sensor Placement Affects Data Collection 4
Domains: Determining Data That Can Be Collected 7
Actions: What a Sensor Does with Data 10
Conclusion 13
2. Network Sensors. . . 15
Network Layering and Its Impact on Instrumentation 16
Network Layers and Vantage 18
Network Layers and Addressing 23
Packet Data 24
Packet and Frame Formats 24
Rolling Buffers 25
Limiting the Data Captured from Each Packet 25
Filtering Specific Types of Packets 25
What If It’s Not Ethernet? 29
NetFlow 30
NetFlow v5 Formats and Fields 30
NetFlow Generation and Collection 32
Further Reading 33
3. Host and Service Sensors: Logging Traffic at the Source. . . 35
Accessing and Manipulating Logfiles 36
The Contents of Logfiles 38
The Characteristics of a Good Log Message 38
Existing Logfiles and How to Manipulate Them 41
Representative Logfile Formats 43
HTTP: CLF and ELF 43
SMTP 47
Microsoft Exchange: Message Tracking Logs 49
Logfile Transport: Transfers, Syslog, and Message Queues 50
Transfer and Logfile Rotation 51
Syslog 51
Further Reading 53
4. Data Storage for Analysis: Relational Databases, Big Data, and Other Options. . . 55
Log Data and the CRUD Paradigm 56
Creating a Well-Organized Flat File System: Lessons from SiLK 57
A Brief Introduction to NoSQL Systems 59
What Storage Approach to Use 62
Storage Hierarchy, Query Times, and Aging 64
Part II. Tools
5. The SiLK Suite. . . 69
What Is SiLK and How Does It Work? 69
Acquiring and Installing SiLK 70
The Datafiles 70
Choosing and Formatting Output Field Manipulation: rwcut 71
Basic Field Manipulation: rwfilter 76
Ports and Protocols 77
Size 78
IP Addresses 78
Time 80
TCP Options 80
Helper Options 82
Miscellaneous Filtering Options and Some Hacks 82
rwfileinfo and Provenance 83
Combining Information Flows: rwcount 86
rwset and IP Sets 88
rwuniq 91
rwbag 93
Advanced SiLK Facilities 93
pmaps 93
Collecting SiLK Data 95
rwptoflow 98
rwtuc 98
Further Reading 100
6. An Introduction to R for Security Analysts. . . 101
Installation and Setup 102
Basics of the Language 102
The R Prompt 102
R Variables 104
Writing Functions 109
Conditionals and Iteration 111
Using the R Workspace 113
Data Frames 114
Visualization 117
Visualization Commands 117
Parameters to Visualization 118
Annotating a Visualization 120
Exporting Visualization 121
Analysis: Statistical Hypothesis Testing 121
Hypothesis Testing 122
Testing Data 124
Further Reading 127
7. Classification and Event Tools: IDS, AV, and SEM. . . 129
How an IDS Works 130
Basic Vocabulary 130
Classifier Failure Rates: Understanding the Base-Rate Fallacy 134
Applying Classification 136
Improving IDS Performance 138
Enhancing IDS Detection 138
Enhancing IDS Response 143
Prefetching Data 144
Further Reading 145
8. Reference and Lookup: Tools for Figuring Out Who Someone Is. . . 147
MAC and Hardware Addresses 147
IP Addressing 150
IPv4 Addresses, Their Structure, and Significant Addresses 150
IPv6 Addresses, Their Structure and Significant Addresses 152
Checking Connectivity: Using ping to Connect to an Address 153
Tracerouting 155
IP Intelligence: Geolocation and Demographics 157
DNS 158
DNS Name Structure 158
Forward DNS Querying Using dig 159
The DNS Reverse Lookup 167
Using whois to Find Ownership 168
Additional Reference Tools 171
DNSBLs 171
9. More Tools. . . 175
Visualization 175
Graphviz 175
Communications and Probing 178
netcat 179
nmap 180
Scapy 181
Packet Inspection and Reference 184
Wireshark 184
GeoIP 185
The NVD, Malware Sites, and the C*Es 186
Search Engines, Mailing Lists, and People 187
Further Reading 188
Part III. Analytics
10. Exploratory Data Analysis and Visualization. . . 191
The Goal of EDA: Applying Analysis 193
EDA Workflow 194
Variables and Visualization 196
Univariate Visualization: Histograms, QQ Plots, Boxplots, and Rank Plots 197
Histograms 198
Bar Plots (Not Pie Charts) 200
The Quantile-Quantile (QQ) Plot 201
The Five-Number Summary and the Boxplot 203
Generating a Boxplot 204
Bivariate Description 207
Scatterplots 207
Contingency Tables 210
Multivariate Visualization 211
Further Reading 220
11. On Fumbling. . . 221
Attack Models 221
Fumbling: Misconfiguration, Automation, and Scanning 224
Lookup Failures 224
Automation 225
Scanning 225
Identifying Fumbling 226
TCP Fumbling: The State Machine 226
ICMP Messages and Fumbling 229
Identifying UDP Fumbling 231
Fumbling at the Service Level 231
HTTP Fumbling 231
SMTP Fumbling 233
Analyzing Fumbling 233
Building Fumbling Alarms 234
Forensic Analysis of Fumbling 235
Engineering a Network to Take Advantage of Fumbling 236
Further Reading 236
12. Volume and Time Analysis. . . 237
The Workday and Its Impact on Network Traffic Volume 237
Beaconing 240
File Transfers/Raiding 243
Locality 246
DDoS, Flash Crowds, and Resource Exhaustion 249
DDoS and Routing Infrastructure 250
Applying Volume and Locality Analysis 256
Data Selection 256
Using Volume as an Alarm 258
Using Beaconing as an Alarm 259
Using Locality as an Alarm 259
Engineering Solutions 260
Further Reading 260
13. Graph Analysis. . . 261
Graph Attributes: What Is a Graph? 261
Labeling, Weight, and Paths 265
Components and Connectivity 270
Clustering Coefficient 271
Analyzing Graphs 273
Using Component Analysis as an Alarm 273
Using Centrality Analysis for Forensics 275
Using Breadth-First Searches Forensically 275
Using Centrality Analysis for Engineering 277
Further Reading 277
14. Application Identification. . . 279
Mechanisms for Application Identification 279
Port Number 280
Application Identification by Banner Grabbing 283
Application Identification by Behavior 286
Application Identification by Subsidiary Site 290
Application Banners: Identifying and Classifying 291
Non-Web Banners 291
Web Client Banners: The User-Agent String 292
Further Reading 294
15. Network Mapping. . . 295
Creating an Initial Network Inventory and Map 295
Creating an Inventory: Data, Coverage, and Files 296
Phase I: The First Three Questions 297
Phase II: Examining the IP Space 300
Phase III: Identifying Blind and Confusing Traffic 305
Phase IV: Identifying Clients and Servers 309
Identifying Sensing and Blocking Infrastructure 311
Updating the Inventory: Toward Continuous Audit 311
Further Reading 312
Preface
This book is about networks: monitoring them, studying them, and using the results of those studies to improve them. “Improve” in this context hopefully means to make more secure, but I don’t believe we have the vocabulary or knowledge to say that confidently —at least not yet. In order to implement security, we try to achieve something more quantifiable and describable: situational awareness.
Situational awareness, a term largely used in military circles, is exactly what it says on the tin: an understanding of the environment you’re operating in. For our purposes, situational awareness encompasses understanding the components that make up your network and how those components are used. This awareness is often radically different from how the network is configured and how the network was originally designed. To understand the importance of situational awareness in information security, I want you to think about your home, and I want you to count the number of web servers in your house. Did you include your wireless router? Your cable modem? Your printer? Did you consider the web interface to CUPS? How about your television set?
To many IT managers, several of the devices listed didn’t even register as “web servers.” However, embedded web servers speak HTTP, they have known vulnerabilities, and they are increasingly common as specialized control protocols are replaced with a web interface. Attackers will often hit embedded systems without realizing what they are— the SCADA system is a Windows server with a couple of funny additional directories, and the MRI machine is a perfectly serviceable spambot.
This book is about collecting data and looking at networks in order to understand how the network is used. The focus is on analysis, which is the process of taking security data and using it to make actionable decisions. I emphasize the word actionable here because effectively, security decisions are restrictions on behavior. Security policy involves telling people what they shouldn’t do (or, more onerously, telling people what they must do). Don’t use Dropbox to hold company data, log on using a password and an RSA dongle, and don’t copy the entire project server and sell it to the competition. When we make
security decisions, we interfere with how people work, and we’d better have good, solid reasons for doing so.
All security systems ultimately depend on users recognizing the importance of security and accepting it as a necessary evil. Security rests on people: it rests on the individual users of a system obeying the rules, and it rests on analysts and monitors identifying when rules are broken. Security is only marginally a technical problem—information security involves endlessly creative people figuring out new ways to abuse technology, and against this constantly changing threat profile, you need cooperation from both your defenders and your users. Bad security policy will result in users increasingly evading detection in order to get their jobs done or just to blow off steam, and that adds additional work for your defenders.
The emphasis on actionability and the goal of achieving security is what differentiates this book from a more general text on data science. The section on analysis proper covers statistical and data analysis techniques borrowed from multiple other disciplines, but the overall focus is on understanding the structure of a network and the decisions that can be made to protect it. To that end, I have abridged the theory as much as possible, and have also focused on mechanisms for identifying abusive behavior. Security analysis has the unique problem that the targets of observation are not only aware they’re being watched, but are actively interested in stopping it if at all possible.
The MRI and the General’s Laptop
Several years ago, I talked with an analyst who focused primarily on a university hospital. He informed me that the most commonly occupied machine on his network was the MRI. In retrospect, this is easy to understand.
“Think about it,” he told me. “It’s medical hardware, which means its certified to use a specific version of Windows. So every week, somebody hits it with an exploit, roots it, and installs a bot on it. Spam usually starts around Wednesday.” When I asked why he didn’t just block the machine from the Internet, he shrugged and told me the doctors wanted their scans. He was the first analyst I’ve encountered with this problem, and he wasn’t the last.
We see this problem a lot in any organization with strong hierarchical figures: doctors, senior partners, generals. You can build as many protections as you want, but if the general wants to borrow the laptop over the weekend and let his granddaughter play Neopets, you’ve got an infected laptop to fix on Monday.
1. Consider automatically locking out accounts after x number of failed password attempts, and combine it with logins based on email addresses. Consider how many accounts you can lock out that way.
much, and when we do automate defenses, we find out that attackers can now use them to attack us.1
I am, as a security analyst, firmly convinced that security should be inconvenient, well-defined, and constrained. Security should be an artificial behavior extended to assets that must be protected. It should be an artificial behavior because the final line of defense in any secure system is the people in the system—and people who are fully engaged in security will be mistrustful, paranoid, and looking for suspicious behavior. This is not a happy way to live your life, so in order to make life bearable, we have to limit security to what must be protected. By trying to watch everything, you lose the edge that helps you protect what’s really important.
Because security is inconvenient, effective security analysts must be able to convince
people that they need to change their normal operations, jump through hoops, and otherwise constrain their mission in order to prevent an abstract future attack from happening. To that end, the analysts must be able to identify the decision, produce information to back it up, and demonstrate the risk to their audience.
The process of data analysis, as described in this book, is focused on developing security knowledge in order to make effective security decisions. These decisions can be forensic: reconstructing events after the fact in order to determine why an attack happened, how it succeeded, or what damage was done. These decisions can also be proactive: devel‐ oping rate limiters, intrusion detection systems, or policies that can limit the impact of an attacker on a network.
Audience
Information security analysis is a young discipline and there really is no well-defined body of knowledge I can point to and say “Know this.” This book is intended to provide a snapshot of analytic techniques that I or other people have thrown at the wall over the past 10 years and seen stick.
The target audience for this book is network administrators and operational security analysts, the personnel who work on NOC floors or who face an IDS console on a regular basis. My expectation is that you have some familiarity with TCP/IP tools such as
netstat, and some basic statistical and mathematical skills.
In addition, I expect that you have some familiarity with scripting languages. In this book, I use Python as my go-to language for combining tools. The Python code is il‐ lustrative and might be understandable without a Python background, but it is assumed that you possess the skills to create filters or other tools in the language of your choice.
In the course of writing this book, I have incorporated techniques from a number of different disciplines. Where possible, I’ve included references back to original sources so that you can look through that material and find other approaches. Many of these techniques involve mathematical or statistical reasoning that I have intentionally kept at a functional level rather than going through the derivations of the approach. A basic understanding of statistics will, however, be helpful.
Contents of This Book
This book is divided into three sections: data, tools, and analytics. The data section discusses the process of collecting and organizing data. The tools section discusses a number of different tools to support analytical processes. The analytics section discusses different analytic scenarios and techniques.
Part I discusses the collection, storage, and organization of data. Data storage and lo‐ gistics are a critical problem in security analysis; it’s easy to collect data, but hard to search through it and find actual phenomena. Data has a footprint, and it’s possible to collect so much data that you can never meaningfully search through it. This section is divided into the following chapters:
Chapter 1
This chapter discusses the general process of collecting data. It provides a frame‐ work for exploring how different sensors collect and report information and how they interact with each other.
Chapter 2
This chapter expands on the discussion in the previous chapter by focusing on sensors that collect network traffic data. These sensors, including tcpdump and NetFlow, provide a comprehensive view of network activity, but are often hard to interpret because of difficulties in reconstructing network traffic.
Chapter 3
This chapter discusses sensors that are located on a particular system, such as host-based intrusion detection systems and logs from services such as HTTP. Although these sensors cover much less traffic than network sensors, the information they provide is generally easier to understand and requires less interpretation and guess‐ work.
Chapter 4
Part II discusses a number of different tools to use for analysis, visualization, and re‐ porting. The tools described in this section are referenced extensively in later sections when discussing how to conduct different analytics.
Chapter 5
System for Internet-Level Knowledge (SiLK) is a flow analysis toolkit developed by Carnegie Mellon’s CERT. This chapter discusses SiLK and how to use the tools to analyze NetFlow data.
Chapter 6
R is a statistical analysis and visualization environment that can be used to effec‐ tively explore almost any data source imaginable. This chapter provides a basic grounding in the R environment, and discusses how to use R for fundamental stat‐ istical analysis.
Chapter 7
Intrusion detection systems (IDSes) are automated analysis systems that examine traffic and raise alerts when they identify something suspicious. This chapter fo‐ cuses on how IDSes work, the impact of detection errors on IDS alerts, and how to build better detection systems whether implementing IDS using tools such as SiLK or configuring an existing IDS such as Snort.
Chapter 8
One of the more common and frustrating tasks in analysis is figuring out where an IP address comes from, or what a signature means. This chapter focuses on tools and investigation methods that can be used to identify the ownership and prove‐ nance of addresses, names, and other tags from network traffic.
Chapter 9
This chapter is a brief walkthrough of a number of specialized tools that are useful for analysis but don’t fit in the previous chapters. These include specialized visual‐ ization tools, packet generation and manipulation tools, and a number of other toolkits that an analyst should be familiar with.
The final section of the book, Part III, focuses on the goal of all this data collection: analytics. These chapters discuss various traffic phenomena and mathematical models that can be used to examine data.
Chapter 10
Exploratory Data Analysis (EDA) is the process of examining data in order to iden‐ tify structure or unusual phenomena. Because security data changes so much, EDA is a necessary skill for any analyst. This chapter provides a grounding in the basic visualization and mathematical techniques used to explore data.
Chapter 11
This chapter looks at mistakes in communications and how those mistakes can be used to identify phenomena such as scanning.
Chapter 12
This chapter discusses analyses that can be done by examining traffic volume and traffic behavior over time. This includes attacks such as DDoS and database raids, as well as the impact of the work day on traffic volumes and mechanisms to filter traffic volumes to produce more effective analyses.
Chapter 13
This chapter discusses the conversion of network traffic into graph data and the use of graphs to identify significant structures in networks. Graph attributes such as centrality can be used to identify significant hosts or aberrant behavior.
Chapter 14
This chapter discusses techniques to determine which traffic is crossing service ports in a network. This includes simple lookups such as the port number, as well as banner grabbing and looking at expected packet sizes.
Chapter 15
This chapter discusses a step-by-step process for inventorying a network and iden‐ tifying significant hosts within that network. Network mapping and inventory are critical steps in information security and should be done on a regular basis.
Conventions Used in This Book
The following typographical conventions are used in this book:
Italic
Indicates new terms, URLs, email addresses, filenames, and file extensions.
Constant width
Used for program listings, as well as within paragraphs to refer to program elements such as variable or function names, databases, data types, environment variables, statements, and keywords.
Constant width bold
Shows commands or other text that should be typed literally by the user.
Constant width italic
This icon signifies a tip, suggestion, or general note.
This icon indicates a warning or caution.
Using Code Examples
Supplemental material (code examples, exercises, etc.) is available for download at
https://github.com/mpcollins/nsda_examples
This book is here to help you get your job done. In general, if example code is offered with this book, you may use it in your programs and documentation. You do not need to contact us for permission unless you’re reproducing a significant portion of the code. For example, writing a program that uses several chunks of code from this book does not require permission. Selling or distributing a CD-ROM of examples from O’Reilly books does require permission. Answering a question by citing this book and quoting example code does not require permission. Incorporating a significant amount of ex‐ ample code from this book into your product’s documentation does require permission. We appreciate, but do not require, attribution. An attribution usually includes the title, author, publisher, and ISBN. For example: “Network Security Through Data Analysis by Michael Collins (O’Reilly). Copyright 2014 Michael Collins, 978-1-449-3579-0.” If you feel your use of code examples falls outside fair use or the permission given above, feel free to contact us at [email protected].
Safari® Books Online
Safari Books Online is an on-demand digital library that delivers expert content in both book and video form from the world’s leading authors in technology and business.
Technology professionals, software developers, web designers, and business and crea‐ tive professionals use Safari Books Online as their primary resource for research, prob‐ lem solving, learning, and certification training.
Safari Books Online offers a range of product mixes and pricing programs for organi‐ zations, government agencies, and individuals. Subscribers have access to thousands of
books, training videos, and prepublication manuscripts in one fully searchable database from publishers like O’Reilly Media, Prentice Hall Professional, Addison-Wesley Pro‐ fessional, Microsoft Press, Sams, Que, Peachpit Press, Focal Press, Cisco Press, John Wiley & Sons, Syngress, Morgan Kaufmann, IBM Redbooks, Packt, Adobe Press, FT Press, Apress, Manning, New Riders, McGraw-Hill, Jones & Bartlett, Course Technol‐ ogy, and dozens more. For more information about Safari Books Online, please visit us
online.
How to Contact Us
Please address comments and questions concerning this book to the publisher:
O’Reilly Media, Inc.
1005 Gravenstein Highway North Sebastopol, CA 95472
800-998-9938 (in the United States or Canada) 707-829-0515 (international or local)
707-829-0104 (fax)
We have a web page for this book, where we list errata, examples, and any additional information. You can access this page at http://oreil.ly/nstda.
To comment or ask technical questions about this book, send email to bookques [email protected].
For more information about our books, courses, conferences, and news, see our website at http://www.oreilly.com.
Find us on Facebook: http://facebook.com/oreilly
Follow us on Twitter: http://twitter.com/oreillymedia
Watch us on YouTube: http://www.youtube.com/oreillymedia
Acknowledgements
I need to thank my editor, Andy Oram, for his incredible support and feedback, without which I would still be rewriting commentary on network vantage over and over again. I also want to thank my assistant editors, Allyson MacDonald and Maria Gulick, for riding herd and making me get the thing finished. I also need to thank my technical reviewers: Rhiannon Weaver, Mark Thomas, Rob Thomas, André DiMino, and Henry Stern. Their comments helped me to rip out more fluff and focus on the important issues.
this includes Tom Longstaff, Jay Kadane, Mike Reiter, John McHugh, Carrie Gates, Tim Shimeall, Markus DeShon, Jim Downey, Will Franklin, Sandy Parris, Sean McAllister, Greg Virgin, Scott Coull, Jeff Janies, and Mike Witt.
Finally, I want to thank my parents, James and Catherine Collins. Dad died during the writing of this work, but he kept asking me questions, and then since he didn’t under‐ stand the answers, questions about the questions until it was done.
PART I
Data
This section discusses the collection and storage of data for use in analysis and response. Effective security analysis requires collecting data from widely disparate sources, each of which provides part of a picture about a particular event taking place on a network. To understand the need for hybrid data sources, consider that most modern bots are general purpose software systems. A single bot may use multiple techniques to infiltrate and attack other hosts on a network. These attacks may include buffer overflows, spreading across network shares, and simple password cracking. A bot attacking an SSH server with a password attempt may be logged by that host’s SSH logfile, providing concrete evidence of an attack but no information on anything else the bot did. Network traffic might not be able to reconstruct the sessions, but it can tell you about other actions by the attacker—including, say, a successful long session with a host that never reported such a session taking place, no siree.
The core challenge in data-driven analysis is to collect sufficient data to reconstruct rare events without collecting so much data as to make queries impractical. Data collection is surprisingly easy, but making sense of what’s been collected is much harder. In security, this problem is complicated by rare actual security threats. The majority of network traffic is innocuous and highly repetitive: mass emails, everyone watching the same YouTube video, file accesses. A majority of the small number of actual security attacks will be really stupid ones such as blind scanning of empty IP addresses. Within that minority is a tiny subset that represents actual threats such as file exfiltration and botnet communications.
can generate five terabytes of raw data per day. By comparison, an eSATA interface can read about 0.3 gigabytes per second, requiring several hours to perform one search across that data, assuming that you’re reading and writing data across different disks. The need to collect data from multiple sources introduces redundancy, which costs additional disk space and increases query times.
A well-designed storage and query system enables analysts to conduct arbitrary queries on data and expect a response within a reasonable time frame. A poorly designed one takes longer to execute the query than it took to collect the data. Developing a good design requires understanding how different sensors collect data; how they comple‐ ment, duplicate, and interfere with each other; and how to effectively store this data to empower analysis. This section is focused on these problems.
CHAPTER 1
Sensors and Detectors: An Introduction
Effective information monitoring builds on data collected from multiple sensors that generate different kinds of data and are created by many different people for many different purposes. A sensor can be anything from a network tap to a firewall log; it is something that collects information about your network and can be used to make judgement calls about your network’s security. Building up a useful sensor system re‐ quires balancing its completeness and its redundancy. A perfect sensor system would be complete while being nonredundant: complete in the sense that every event is mean‐ ingfully described, and nonredundant in that the sensors don’t replicate information about events. These goals, probably unachievable, are a marker for determining how to build a monitoring solution.
No single type of sensor can do everything. Network-based sensors provide extensive coverage but can be deceived by traffic engineering, can’t describe encrypted traffic, and can only approximate the activity at a host. Host-based sensors provide more extensive and accurate information for phenomena they’re instrumented to describe. In order to effectively combine sensors, I classify them along three axes:
Vantage
The placement of sensors within a network. Sensors with different vantages will see different parts of the same event.
Domain
The information the sensor provides, whether that’s at the host, a service on the host, or the network. Sensors with the same vantage but different domains provide complementary data about the same event. For some events, you might only get information from one domain. For example, host monitoring is the only way to find out if a host has been physically accessed.
Action
How the sensor decides to report information. It may just record the data, provide events, or manipulate the traffic that produces the data. Sensors with different ac‐ tions can potentially interfere with each other.
Vantages: How Sensor Placement Affects Data Collection
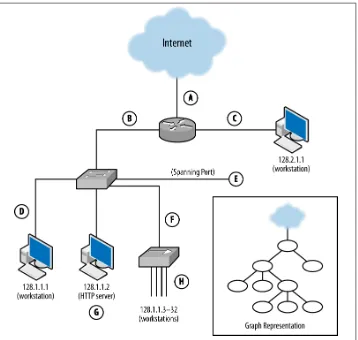
A sensor’s vantage describes the packets that a sensor will be able to observe. Vantage is determined by an interaction between the sensor’s placement and the routing infra‐ structure of a network. In order to understand the phenomena that impact vantage, look at Figure 1-1. This figure describes a number of unique potential sensors differ‐ entiated by capital letters. In order, these sensor locations are:
A
Monitors the interface that connects the router to the Internet.
B
Monitors the interface that connects the router to the switch.
C
Monitors the interface that connects the router to the host with IP address 128.2.1.1.
D
Monitors host 128.1.1.1.
E
Monitors a spanning port operated by the switch. A spanning port records all traffic that passes the switch (see the section on port mirroring in Chapter 2 for more information on spanning ports).
F
Monitors the interface between the switch and the hub.
G
Collects HTTP log data on host 128.1.1.2.
H
Figure 1-1. Vantage points of a simple network and a graph representation
Each of these sensors has a different vantage, and will see different traffic based on that vantage. You can approximate the vantage of a network by converting it into a simple node-and-link graph (as seen in the corner of Figure 1-1) and then tracing the links crossed between nodes. A link will be able to record any traffic that crosses that link en route to a destination. For example, in Figure 1-1:
• The sensor at position A sees only traffic that moves between the network and the Internet—it will not, for example, see traffic between 128.1.1.1 and 128.2.1.1. • The sensor at B sees any traffic that originates or ends in one of the addresses
“beneath it,” as long as the other address is 128.2.1.1 or the Internet. • The sensor at C sees only traffic that originates or ends at 128.2.1.1.
• The sensor at D, like the sensor at C, only sees traffic that originates or ends at 128.1.1.1.
• The sensor at E sees any traffic that moves between the switches’ ports: traffic from 128.1.1.1 to anything else, traffic from 128.1.1.2 to anything else, and any traffic from 128.1.1.3 to 128.1.1.32 that communicates with anything outside that hub. • The sensor at F sees a subset of what the sensor at E sees, seeing only traffic from
128.1.1.3 to 128.1.1.32 that communicates with anything outside that hub.
• G is a special case because it is an HTTP log; it sees only HTTP traffic (port 80 and 443) where 128.1.1.2 is the server.
• Finally, H sees any traffic where one of the addresses between 128.1.1.3 and 128.1.1.32 is an origin or a destination, as well as traffic between those hosts.
Note that no single sensor provides complete coverage of this network. Furthermore, instrumentation will require dealing with redundant traffic. For instance, if I instrument H and E, I will see any traffic from 128.1.1.3 to 128.1.1.1 twice. Choosing the right vantage points requires striking a balance between complete coverage of traffic and not drowning in redundant data.
When instrumenting a network, determining vantage is a three-step process: acquiring a network map, determining the potential vantage points, and then determining the optimal coverage.
The first step involves acquiring a map of the network and how it’s connected together as well as a list of potential instrumentation points. Figure 1-1 is a simplified version of such a map.
The second step, determining the vantage of each point, involves identifying every po‐ tentially instrumentable location on the network and then determining what that loca‐ tion can see. This value can be expressed as a range of IP address/port combinations.
Table 1-1 provides an example of such an inventory for Figure 1-1. A graph can be used to make a first guess at what vantage points will see, but a truly accurate model requires more in-depth information about the routing and networking hardware. For example, when dealing with routers it is possible to find points where the vantage is asymmetric (note that the traffic in Table 1-1 is all symmetric). Refer to “Network Layering and Its Impact on Instrumentation” on page 16 for more information.
Table 1-1. A worksheet showing the vantage of Figure 1-1
Vantage point Source IP range Destination IP range
A Internet 128.1, 2.1.1-32
128.1, 2.1.1-32 Internet
B 128.1.1.1-32 128.2.1.1, Internet
Vantage point Source IP range Destination IP range
C 128.2.1.1 128.1.1.1-32, Internet
128.1.1.1-32, Internet 128.2.1.1
D 128.1.1.1 128.1.1.2-32, 128.2.1.1, Internet
128.1.1.2-32, 128.2.1.1, Internet 128.1.1.1
E 128.1.1.1 128.1.1.2-32, 128.2.1.1, Internet
128.1.1.2 128.1.1.1, 128.1.1.3-32, 128.2.1.1,Internet
128.1.1.3-32 128.1.1.1-2,128.2.1.1, Internet
F 128.1.1.3-32 128.1.1.1-2, 128.2.1.1, Internet
128.1.1.1-32, 128.2.1.1, Internet 128.1.1.3-32
G 128.1,2.1.1-32, Internet 128.1.1.2:tcp/80
128.1.1.2:tcp/80 128.1,2.1.1-32
H 128.1.1.3-32 128.1.1.1-32, 128.2.1.1,Internet
128.1.1.1-32, 128.2.1.1, Internet 128.1.1.3-32
The final step is to pick the optimal vantage points shown by the worksheet. The goal is to choose a set of points that provide monitoring with minimal redundancy. For example, sensor E provides a superset of the data provided by sensor F, meaning that there is no reason to include both. Choosing vantage points almost always involves dealing with some redundancy, which can sometimes be limited by using filtering rules. For example, in order to instrument traffic between the hosts 128.1.1.3–32, point H
must be instrumented, and that traffic will pop up again and again at points E, F, B, and A. If the sensors at those points are configured to not report traffic from 128.1.1.3–32, the redundancy problem is moot.
Domains: Determining Data That Can Be Collected
Sensor G in Figure 1-1 differs from the other sensors in that image; while the other sensors in the network are presumed to record all network traffic, G is recording only HTTP traffic (tcp/80). While all the other sensors are collecting network traffic data, G is collecting data in a different domain. A sensor’s domain describes the scope of the information it records. A sensor can collect data in one of three domains:
Network
This collects information about network traffic. Examples of these sensors include VPNs, most intrusion detection systems (IDSes), NetFlow collectors such as YAF (described in “YAF” on page 96), and TCP collectors such as Snort and raw data collected by tcpdump.
Host
Resides on the host and monitors the activity on a host: logins, logouts, file accesses, and so on. A host-based sensor can provide information that a network based sensor
can’t, such as physical logins to a particular host or the use of a USB peripheral. Host-based sensors include IPS tools such as Tripwire or McAfee’s HIPS applica‐ tion, as well as system logfiles or security logs. Host-based sensors provide infor‐ mation on the low-level operation of a host, but won’t provide much information on the services that are running there. Clearly, you can implement host-based sen‐ sors only on hosts that you know about. Unauthorized hosts have to be found before you can monitor them.
Service
Service sensors are generated by a particular service process, such as HTTP or SMTP server logs. Service sensors keep track of well-formed, if not necessarily legitimate, activity within the service (for example, an HTTP sensor will record a failed attempt to fetch a URL, but won’t record a port 80 session that didn’t send HTTP compliant commands). Unlike host and sensor logs, which are general sen‐ sors, service-based sensors are focused on logging interactions with a particular service: mail messages sent, HTTP requests served, and so on. As with a host-based sensor, you must be aware that the service exists before you can use a service-based sensor.
Stream Reassembly and Packet Dissection
There are a number of different tools that can take network traffic and approximate a service log by extracting the relevant information from the packets. For example, the contents of a CLF record (see “HTTP: CLF and ELF” on page 43 for more information) are exchanged between an HTTP client and an HTTP server.
Network analysis tools often provide packet dissection or session reconstruction facili‐ ties as part of deep packet inspection. These construct a model of the session based on the packet data. These tools are very useful for approximating what happens in a session if you don’t have service logs, however they run into the standard limits involving net‐ work session reconstruction: they won’t work with encrypted data, they’re approximat‐ ing the session and can miss implementation-specific details, and the process of recon‐ struction is expensive. At the same time, these collectors will work on any network traffic data and do not require the logistically painful process of identifying and instrumenting individual service.
Note that the domain describes the information that the sensor uses, not the information that the sensor reports. For example, NetFlow, tcpdump, and network-based IDS sensors all work within the network domain, but each provides a different output.
an HTTP server’s logfile. The network sensor can record the packets that were sent, but does not relate them together into HTTP structures such as sessions, cookies, or pages. The host sensor can record the last time a file was accessed, but does not relate that file to a URL or request. The service sensor can say that an HTTP session took place and include what page was served, but it will not record a half-open scan on port 80. Of the three sensors, the one with the service domain is the only one that can (barring tampering with the logger) state that a particular interaction took place; the others can only provide information for an analyst to use for guesswork. All things being equal, it is always preferable to have a sensor whose domain is as close to the target as possible. The sensors’ domains, together with their vantages, determine how redundant a sensor combination is. If two sensors have the same domain, and one sensor’s vantage is a superset of the other, the smaller sensor is redundant and probably shouldn’t be run. Conversely, if two sensors have the same vantage but different domains, they should complement each other.
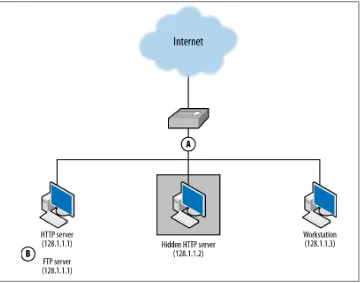
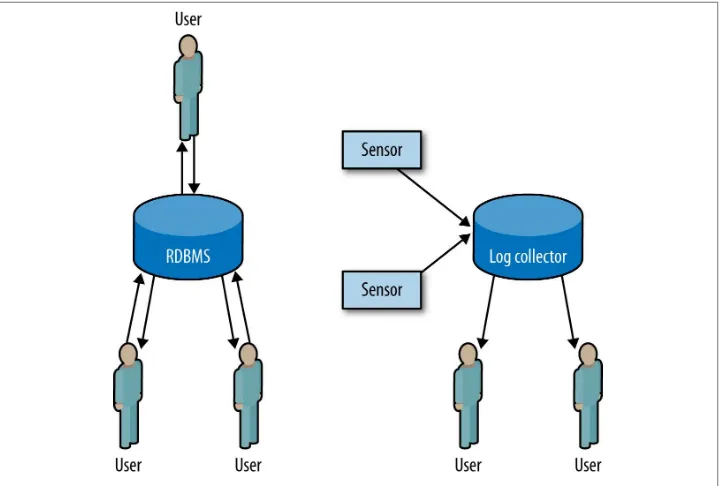
Consider the example network in Figure 1-2, which has an HTTPS server on 128.2.1.1, an unknown HTTP server on 128.2.1.2, and a client on 128.2.1.3.
Figure 1-2. An example of host- and network-based sensors working together
The HTTPS server is accessible via FTP, which is not logged. We summarize this in‐ formation by expanding the table format used in Table 1-1 and adding the domains, shown in Table 1-2.
Table 1-2. Vantage and domain for Figure 1-2
Vantage point Source IP range Destination IP range Domain
A 128.1.1.1-3 Internet Network
128.1.1.1-3 128.1.1.1-3 Network
Internet 128.1.1.1-3 Network
B 128.1.1.2-3,Internet 128.1.1.1:tcp/443 Service/HTTPS
128.1.1.1:tcp/443 128.1.1.2-3,Internet Service/HTTPS
Now, let’s run through some different attacks and how these sensors react to them.
• An attacker scans the network for FTP servers. The scan and the responses will be seen by sensor A. B will not see the scan, as there is no FTP sensor.
• An attacker scans the network for HTTPS servers by opening a GET / request to 443. Sensor A sees a session to 128.1.1.1, but sensor B has the actual information on the session.
• An attacker scans for HTTP servers. A sees the scan, but B logs HTTPS events— not HTTP, and ignores the scan. Sensor A also sees the response from 128.1.1.2, identifying a previously unidentified HTTP server.
Sensors in different domains provide richer information than single sensors, even if those sensors provide the same vantage. Host-based sensors provide more information and can provide data, such as unencrypted payload, that might not be available to a network sensor. However, a defender has to be aware that a host-based sensor exists before he can use it.
Network-based sensors generally provide more information than host-based sensors, both because network sensors cover multiple hosts, and because a host may not react to traffic sent across the network. At the same time, network data is of relatively low value compared to its volume—more records have to be observed to find out what happened, and it’s often hard to determine whether a host actually responded to network traffic. Network sensors can aid in discovery and serve as a fallback to host-based sensors when that information is not available.
Actions: What a Sensor Does with Data
Report
Simply provide information on all phenomena that the sensor observes. Reporting sensors are simple and important for baselining. They are also useful for developing signatures and alerts for phenomena that alerting and blocking sensors haven’t yet been configured to recognize. Reporting sensors include NetFlow collectors,
tcpdump, and server logs.
Event
An event sensor differs from a report sensor in that it consumes multiple data to produce an event that summarizes some subset of that data. For example, a host-based intrusion detection system might examine a memory image, find a malware signature in memory, and send an event indicating that its host was compromised by malware. At their most extreme, event sensors are black boxes that produce events in response to internal processes developed by experts. Event sensors include IDS and antivirus (AV).
Control
A controlling sensor, like an event sensor, consumes multiple data and makes a judgment about that data before reacting. Unlike an event sensor, a controlling sensor modifies or blocks traffic when it sends an event. Controlling sensors include IPSes, firewalls, antispam systems, and some anti-virus systems.
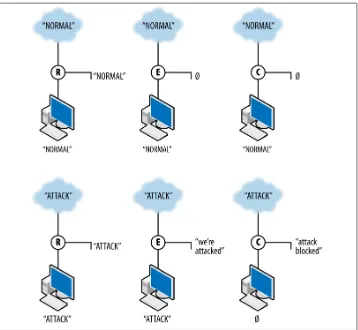
A sensor’s action not only affects how a sensor reports data, but also how it affects the data it’s observing. Controlling sensors can modify or block traffic. Figure 1-3 shows how these three different types of action interact with data. The figure shows the work of three sensors: R, a reporting sensor; E, an event sensor; and C, a controlling sensor. The event and control sensors are signature matching systems that react to the string
ATTACK. Each sensor is placed between the Internet and a single target.
Figure 1-3. Three different sensor actions
R, the reporter, simply reports the traffic it observes. In this case, it reports both normal and attack traffic without affecting the traffic and effectively summarizes the data ob‐ served. E, the event sensor, does nothing in the presence of normal traffic but raises an event when attack traffic is observed. E does not stop the traffic; it just sends an event. C, the controller, sends an event when it sees attack traffic and does nothing to normal traffic. In addition, however, C blocks the aberrant traffic from reaching the target. If another sensor is further down the route from C, it will never see the traffic that C blocks.
Aggregation and Transport Tools
1. The flow-tools mailing list and repository are both available for free download.
Some examples include the use of aggregation in Cisco NetFlow and the various redi‐ rection and transport tools in flow-tools.1 Historically, NetFlow records in their basic format (raw flows) were sent to a collector, which would then aggregate them into various reports. flow-tools provides a number of tools that can take flow data and route it to different sensors as needed.
Conclusion
The taxonomy introduced in this chapter should be sufficient to describe any sensors available for security monitoring and explain how they can potentially interact. This description is intended to be at a high enough level that an operator can start classifying sensors without getting mired in details. In Chapter 2 and Chapter 3, we discuss vantage, domain, and action in-depth in order to provide a more precise enumeration of how they relate to real systems.
CHAPTER 2
Network Sensors
A network sensor collects data directly from network traffic without the agency of an intermediary application, making them different from the host-based sensors discussed in Chapter 3. Examples include NetFlow sensors on a router and sensors that collect traffic using a sniffing tool such as tcpdump.
The challenge of network traffic is the challenge you face with all log data: actual security events are rare, and data costs time and storage space. Where available, log data is preferable because it’s clean (a high-level event is recorded in the log data) and compact. The same event in network traffic would have to be extracted from millions of packets, which can often be redundant, encrypted, or unreadable. At the same time, it is very easy for an attacker to manipulate network traffic and produce legitimate-looking but completely bogus sessions on the wire. An event summed up in a 300-byte log record could easily be megabytes of packet data, wherein only the first 10 packets have any analytic value.
That’s the bad news. The good news is that network traffic’s “protocol agnosticism,” for lack of a better term, means that it is also your best source for identifying blind spots in your auditing. Host-based collection systems require knowing that the host exists in the first place, and there are numerous cases where you’re likely not to know that a particular service is running until you see its traffic on the wire. Network traffic provides a view of the network with minimal assumptions—it tells you about hosts on the network you don’t know existed, backdoors you weren’t aware of, attackers already inside your bor‐ der, and routes through your network you never considered. At the same time, when you face a zero-day vulnerability or new malware, packet data may be the only data source you have.
The remainder of this chapter is broken down as follows. The next section covers
network vantage: how packets move through a network and how to take advantage of
that when instrumenting the network. The next section covers tcpdump, the funda‐ mental network traffic capture protocol, and provides recipes for sampling packets,
filtering them, and manipulating their length. The section after that covers NetFlow, a powerful traffic summarization approach that provides high-value, compact summary information about network traffic. At the end of the chapter, we look at a sample network and discuss how to take advantage of the different collection strategies.
Network Layering and Its Impact on Instrumentation
Computer networks are designed in layers. A layer is an abstraction of a set of network functionality intended to hide the mechanics and finer implementation details. Ideally, each layer is a discrete entity; the implementation at one layer can be swapped out with another implementation and not impact the higher layers. For example, the Internet Protocol (IP) resides on layer 3 in the OSI model; an IP implementation can run iden‐ tically on different layer 2 protocols such as Ethernet or FDDI.
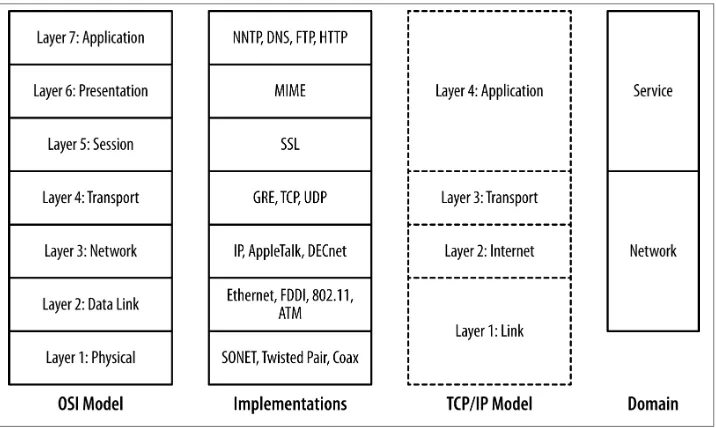
There are a number of different layering models. The most common ones in use are the OSI’s seven layer model and TCP/IP’s four layer model. Figure 2-1 shows these two models, representative protocols, and their relationship to sensor domains as defined in Chapter 1. As Figure 2-1 shows, the OSI model and TCP/IP model have a rough correspondence. OSI uses the following seven layers:
1. Physical: The physical layer is composed of the mechanical components used to connect the network together—the wires, cables, radio waves, and other mecha‐ nisms used to transfer data from one location to the next.
2. Data link: The data link layer is concerned with managing information that is transferred across the physical layer. Data link protocols, such as Ethernet, ensure that asynchronous communications are relayed correctly. In the IP model, the data link and physical layers are grouped together as the link layer.
3. Network: The network layer is concerned with the routing of traffic from one data link to another. In the IP model, the network layer directly corresponds to layer 2, the Internet layer.
4. Transport: The transport layer is concerned with managing information that is transferred across the network layer. It has similar concerns to the data link layer, such as flow control and reliable data transmission, albeit at a different scale. In the IP model, the transport layer is layer 3.
5. Session: The session layer is concerned with the establishment and maintenance of a session, and is focused on issues such as authentication. The most common ex‐ ample of a session layer protocol today is SSL, the encryption and authentication layer used by HTTP, SMTP, and many other services to secure communications. 6. Presentation: The presentation layer encodes information for display at a higher
7. Application: The application layer is the service, such as HTTP, DNS, and SSH. OSI layers 5 through 7 correspond roughly to the application layer (layer 4) of the IP model.
Figure 2-1. Layering models
The layering model is just that: a model rather than a specification, and models are necessarily imperfect. The TCP/IP model, for example, eschews the finer details of the OSI model, and there are a number of cases where protocols in the OSI model might exist in multiple layers. Network interface controllers (NICs) dwell on layers 1 and 2 in the model. The layers do impact each other, in particular through how data is trans‐ ported (and is observable), and by introducing performance constraints into higher levels.
The most common place where we encounter the impact of layering on network traffic is the maximum transmission unit (MTU). The MTU is an upper limit on the size of a data frame, and impacts the maximum size of a packet that can be sent over that medium. The MTU for Ethernet is 1,500 bytes, and this constraint means that IP packets will almost never exceed that size.
The layering model also provides us with a clear difference between the network and service-based sensor domains. As Figure 2-1 shows, network sensors are focused on
layers 2 through 4 in the OSI model, while service sensors are focused on layers 5 and above.
Layering and the Role of Network Sensors
It’s logical to ask why network sensors can’t monitor everything; after all, we’re talking about attacks that happen over a network. In addition, network sensors can’t be tampered with or deleted like host logs, and they will see things like scans or failed connection attempts that host logs won’t.
Network sensors provide extensive coverage, but recovering exactly what happened from that coverage becomes more complex as you move higher up the OSI model. At layer 5 and above, issues of protocol and packet interpretation become increasingly prominent. Session encryption becomes an option at layer 5, and encrypted sessions will be unreadable. At layer 6 and layer 7, you need to know the intricacies of the actual protocol that’s being used in order to extract meaningful information.
Protocol reconstruction from packet data is complex and ambiguous; TCP/IP is de‐ signed on end-to-end principles, meaning that the server and client are the only parties required to be able to construct a session from packets. Tools such as Wireshark (de‐ scribed in Chapter 9) or NetWitness can reconstruct the contents of a session, but these are approximations of what actually happened.
Network, host, and service sensors are best used to complement each other. Network sensors provide information that the other sensors won’t record, while the host and service sensors record the actual event.
Recall from Chapter 1 that a sensor’s vantage refers to the traffic that a particular sensor observes. In the case of computer networks, the vantage refers to the packets that a sensor observes either by virtue of transmitting the packets itself (via a switch or a router) or by eavesdropping (within a collision domain). Since correctly modeling vantage is necessary to efficiently instrument networks, we need to dive a bit into the mechanics of how networks operate.
Network Layers and Vantage
collision domain is called such because the individual elements can potentially send data at the same time, resulting in a collision; layer 2 protocols include mechanisms to compensate for or prevent collisions.
The net result is that layer 2 datagrams are broadcast across a common source, as seen in Figure 2-2. Network interfaces on the same collision domain all see the same data‐ grams; they elect to only interpret datagrams that are addressed to them. Network cap‐ ture tools like tcpdump can be placed in promiscuous mode and will then record all the datagrams observed within the collision domain.
Figure 2-2. Vantage across collision domains
Figure 2-2 shows the vantage across a broadcast domain. As seen in this figure, the initial frame (A to B) is broadcast across the hub, which operates as a shared bus. Every host connected to the hub can receive and react to the frames, but only B should do so. C, a compliant host, ignores and drops the frame. D, a host operating in promiscuous mode, records the frame. The vantage of a hub is consequently all the addresses connected to that hub.
Shared collision domains are inefficient, especially with asynchronous protocols such as Ethernet. Consequently, layer 2 hardware such as Ethernet switches are commonly used to ensure that each host connected to the network has its own dedicated Ethernet port. This is shown in Figure 2-3.
Figure 2-3. Vantage across a switch
A capture tool operating in promiscuous mode will copy every frame that is received at the interface, but the layer 2 switch ensures that the only frames an interface receives are the ones explicitly addressed to it. Consequently, as seen in Figure 2-3, the A to B frame is received by B, while C and D receive nothing.
There is a hardware-based solution to this problem. Most switches implement some form of port mirroring. Port mirroring configurations copy the frames sent between different ports to common mirrored ports in addition to their original destination. Using mirroring, you can configure the switch to send a copy of every frame received by the switch to a common interface. Port mirroring can be an expensive operation, however, and most switches limit the amount of interfaces or VLANs monitored. Switch vantage is a function of the port and the configuration of the switch. By default, the vantage of any individual port will be exclusively traffic originating from or going to the interface connected to the port. A mirrored port will have the vantage of the ports it is configured to mirror.
Layer 3, when routing becomes a concern, is when vantage becomes messy. Routing is a semiautonomous process that administrators can configure, but is designed to provide some degree of localized automation in order to provide reliability. In addition, routing has performance and reliability features, such as the TTL, which can also impact mon‐ itoring.
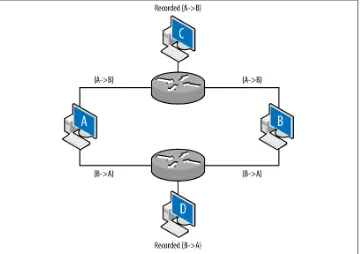
Layer 3 vantage becomes more complex when dealing with multihomed interfaces, such as the example shown in Figure 2-4. Up until this point, all vantages discussed in this book have been symmetric—if instrumenting a point enables you to see traffic from A to B, it also enables you to see traffic from B to A. A multihomed host like a router has multiple interfaces that traffic can enter or exit.
Figure 2-4. Vantage when dealing with multiple interfaces
Figure 2-4 shows an example of multiple interfaces and their potential impact on vantage at layer 3. In this example, A and B are communicating with each other: A sends the packet {A→B} to B, B sends the packet {B→A} to A. C and D are monitoring at the routers: router 1 is configured so that the shortest path from A to B is through it. Router 2 is configured so that shortest path from B to A is through it. The net effect of this configuration is that the vantages at C and D are asymmetric. C will see traffic from A to B, D will see traffic from B to A, but neither of them will see both sides of the inter‐ action. While this example is contrived, this kind of configuration can appear due to business relationships and network instabilities. It’s especially problematic when dealing with networks that have multiple interfaces to the Internet.
IP packets have a built-in expiration function: a field called the time-to-live (TTL) value. The TTL is decremented every time a packet crosses a router (not a layer 2 facility like a switch), until the TTL reaches zero. In most cases, the TTL should not be a problem
—most modern stacks set the TTL to at least 64, which is considerably longer than the number of hops required to cross the entire Internet. However, the TTL is manually modifiable and there exist attacks that can use the TTL for evasion purposes. Table 2-1
lists default TTLs by operating system.
Table 2-1. Default TTLs by operating system
Operating system TTL value
Linux (2.4, 2.6) 64
FreeBSD 64
Mac OS X 64
Windows XP 128
Windows 7, Vista 128
Solaris 255
Figure 2-5 shows how the TTL operates. Assume that hosts C and D are operating on monitoring ports and the packet is going from A to B. Furthermore, the TTL of the packet is set to 2 initially. The first router receives the packet and passes it to the second router. The second router drops the packet; otherwise, it would decrement the TTL to zero. TTL does not directly impact vantage, but instead introduces an erratic type of blind spot—packets can be seen by one sensor, but not by another several routers later as the TTL decrements.
The net result of this is that the packet is observed by C, never received by B, and possibly
(depending on the router configuration) observed at D.
Physical Taps
Instead of configuring the networking hardware to report data on a dedicated interface, you can monitor the cables themselves. This is done using network taps, which are objects that physically connect to the cables and duplicate traffic for monitoring pur‐ poses. Network taps have the advantage of moving the process of collecting and copying data off the network hardware, but only have the vantage of the cables to which they connect.
Network Layers and Addressing
Entities on a network will have multiple addresses that can be used to reach them. For example, the host www.mysite.com may have the IP address 196.168.1.1 and the Ethernet Address 0F:2A:32:AA:2B:14. These addresses are used to resolve the identity of a host at different abstraction layers of the network. In most networks, a host will have a MAC (Ethernet) address and an IPv4 or IPv6 address.
These addresses are dynamically moderated through various protocols, and various types of networking hardware will modify the relationships between addresses. The most common examples of these are DNS modifications, which associate a single name with multiple addresses and vice versa; this is discussed in more depth in Chapter 8. The following addresses are commonly used on networks:
MAC address
A 48-byte identifier used by the majority of layer 2 protocols, including Ethernet, FDDI, Token Ring, Bluetooth, and ATM. MAC addresses are usually recorded as a set of six hexadecimal pairs (e.g., 12:34:56:78:9A:BC). MAC addresses are assigned to the hardware by the original manufacturer, and the first 24 bits of the interface are reserved as a manufacturer ID. As layer 2 addresses, MAC addresses don’t route; when a frame is transferred across a router, the addressing information is replaced with the addressing information of the router’s interface. IPv4 and IPv6 addresses are related to MAC addresses using Address Resolution Protocol (ARP).
IPv4 address
An IPv4 address is a 32-bit integer value assigned to every routable host, with ex‐ ceptions made for reserved dynamic address spaces (see Chapter 8 for more infor‐ mation on these addresses). IPv4 addresses are most commonly represented in dotted quad format: four integers between 0 and 255 separated by periods (e.g., 128.1.11.3).
IPv6 address
IPv6 is the steadily advancing replacement for IPv4 that fixes a number of design flaws in the original protocol, in particular the allotment of IP addresses. IPv6 uses a 128-bit address to identify a host. By default, these addresses are described as a set of 16-bit hexadecimal values separated by colons (e.g., AAAA: 2134:0918:F23A:A13F:2199:FABE:FAAF). Given their length, IPv6 addresses use a number of conventions to shorten the representation: initial zeroes are trimmed, and the longest sequence of 16-bit zero values is eliminated and replaced by double colons (e.g., 0019:0000:0000:0000:0000:0000:0000:0182 becomes 19::182).
All of these relationships are dynamic, and multiple addresses at one layer can be as‐ sociated with one address at a another layer. As discussed earlier, a single DNS name can be associated with multiple IP addresses through the agency of the DNS service. Similarly, a single MAC address can support multiple IP addresses through the agency of the ARP protocol. This type of dynamism can be used constructively (like for tun‐ neling) and destructively (like for spoofing).
Packet Data
In the context of this book, packet data really means the output of libpcap, either through an IDS or tcpdump. Originally developed by LBNL’s Network Research Group, libp‐ cap is the fundamental network capture tool and serves as the collector for tools such as Snort, bro, and tcpdump.
Packet capture data is a large haystack with only scattered needles of value to you. Cap‐ turing this data requires balancing between the huge amount of data that can be captured and the data that it makes sense to actually capture.
Packet and Frame Formats
On almost any modern system, tcpdump will be capturing IP over Ethernet, meaning that the data actually captured by libpcap consists of Ethernet frames containing IP packets. While IP contains over 80 unique protocols, on any operational network, the overwhelming majority of traffic will originate from three protocols: TCP (protocol 6), UDP (protocl 17), and ICMP (protocol 1).
While TCP, UDP, and ICMP make up the overwhelming majority of IP traffic, a number of other protocols may appear in networks, in particular if VPNs are used. IANA has a
complete list of IP suite protocols. Some notable ones to expect include IPv6 (protocol number 41), GRE (protocol number 47), and ESP (protocol number 50). GRE and ESP are used in VPN traffic.
1. The snaplen is based on the Ethernet frame size, so 20 additional bytes have to be added to the size of the corresponding IP headers.
of rolling buffers to keep a timed subsample, manipulating the snap length to capture only a fixed size packet (such as headers), and filtering traffic using BPF or other filtering rules. Each approach is an analytic trade-off that provides different benefits and disad‐ vantages.
Rolling Buffers
A rolling buffer is a location in memory where data is dumped cyclically: information is dropped linearly, and when the buffer is filled up, data is dumped at the beginning of the buffer, and the process repeats. Example 2-1 gives an example of using a rolling buffer with tcpdump. In this example, the process writes approximately 128 MB to disk, and then rotates to a new file. After 32 files are filled (specified by the -W switch), the process restarts.
Example 2-1. Implementing a rolling buffer in tcpdump
host$ tcpdump -i en1 -s 0 -w result -C 128 -W 32
Rolling buffers implement a time horizon on traffic analysis: data is available only as long as it’s in the buffer. For that reason, working with smaller file sizes is recommended, because when you find something aberrant, it needs to be pulled out of the buffers quickly.
Limiting the Data Captured from Each Packet
An alternative to capturing the complete packet is to capture a limited subset of payload, controlled in tcpdump by the snaplen (-s) argument. Snaplen constrains packets to the frame size specified in the argument. If you specify a frame size of at least 68 bytes, you will record the TCP or UDP headers.1 That said, this solution is a poor alternative to NetFlow, which is discussed later in this chapter.
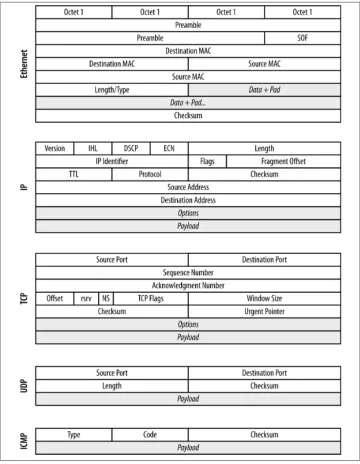
Filtering Specific Types of Packets
An alternative to filtering at the switch is to filter after collecting the traffic at the span‐ ning port. With tcpdump and other tools, this can be easily done using Berkeley Packet Filtering (BPF). BPF allows an operator to specify arbitrarily complex filters, and con‐ sequently your possiblities are fairly extensive. Some useful options are described in this section, along with examples. Figure 2-6 provides a breakdown of the headers for Ethernet frames, IP, UDP, ICMP, and TCP.
Figure 2-6. Frame and packet formats for Ethernet, IP, TCP, UDP, and ICMP