Production of gamma-valerolactone from
sugarcane bagasse over TiO
2
-supported platinum
and acid-activated bentonite as a co-catalyst
Jindrayani N. Putro,aAlfin Kurniawan,bFelycia E. Soetaredjo,*aShi-Yow Lin,b Yi-Hsu Juband Suryadi Ismadji*a
Nowadays, biomass utilization has become the center of attention for researchers worldwide and is driven by the depletion of global petroleum supplies for the production of energy and valuable chemicals while easing the atmospheric CO2 burden. We propose here a green strategy for transforming sugarcane bagasse into gamma-valerolactone (GVL), an attractive platform molecule that can be further converted into a variety of chemical derivatives for wide use in industrial applications. Our recent strategy involves the solid acid-catalyzed hydrothermal conversion of cellulose and hemicellulose derived from biomass to give an aqueous solution comprising levulinic acid (LA), followed by catalytic hydrogenation of LA to GVL. Native and acid-activated bentonites were used as solid acid catalysts to promote hydrothermal conversion of cellulose and hemicellulose. The maximum achievable yield of LA was 159.17 mg per gram of oven-dried biomass for 60 min reaction at 473.2 K in the presence of a 2% acid-activated bentonite catalyst. Catalytic hydrogenation reactions of LA to GVL over 1% Pt@TiO2and acid-activated bentonite as a co-catalyst were performed at temperatures of 393.2–473.2 K and residence times of 120–360 min. The combined solid catalyst gave an attractive performance with respect to LA conversion (100%) and GVL selectivity (95%) under milder reaction conditions in comparison to 1% Pt@TiO2without an acid co-catalyst. The spent catalyst could be reused forfive consecutive hydrogenation cycles with a marginal decrease in the catalytic activity and GVL selectivity. Coke formation was believed to be the main cause of catalyst poisoning and calcination of the spent catalyst under a stream of pure oxygen at 723.2 K was applied for removing coke deposits from the active catalyst sites, thus restoring the catalytic performance.
Introduction
Over the past decade, the 2nd generation of liquid biofuels has become the present global challenge in the energyeld. The primary focus of such research is to develop sustainable liquid biofuels from lignocellulosic biomass in a competitive market and environmentally sustainable route, which can be used to replacenite fossil fuel resources and boost the economics of biofuel production.1,2 Lignocellulosic biomass, in the form of
agricultural crops, forestry residues or waste from whole food supply chains is being paid more attention worldwide as a potential resource for the production of liquid biofuels, thanks to its renewability, high abundance and inherently carbon neutral nature.3–5Lignocellulosic biomass consists of 35–50%
cellulose, 20–35% hemicellulose and 10–25% lignin.5 All are
natural polymeric materials which constitute the structural integrity and much of the mass of plants. The challenge now is
tond an alternative route to convert the hardly decomposed cellulose and hemicellulose intove- and six-carbon sugars that can be run economically at the scale required. The existing thermochemical routes which are considered more economi-cally and technieconomi-cally feasible than conventional biochemical route featuring enzymatic hydrolysis and fermentation for the conversion of lignocellulosic biomass to fuels and commodity chemicals include the Fischer–Tropsch synthesis (FTS) and bione processes, catalytic hydrotreatment, catalytic pyrolysis and hydrothermal liquefaction.5–11 However, one the major
obstacles faced in these thermochemical conversion routes is associated with the production of bio-crude containing high oxygen, nitrogen and sulfur, which renders the product with undesirable properties as fuel including thermally and chemi-cally unstable, corrosive and low energy density. Further phys-ical or chemphys-ical upgrading strategies are required in order to improve the quality of as-produced biocrude, which oen involves a series of unit operations and extensive energy input requirements for the processes performed under high temper-ature conditions. Furthermore, the implementation of most, if not all, of the aforesaid thermochemical technologies for industrial process scale-up is now under-performing.
aDepartment of Chemical Engineering, Widya Mandala Surabaya Catholic University,
Kalijudan 37, Surabaya 60114, Indonesia. E-mail: [email protected]
bDepartment of Chemical Engineering, National Taiwan University of Science and
Technology, No. 43, Sec. 4, Keelung Rd, Taipei 106, Taiwan, Republic of China
Cite this:RSC Adv., 2015,5, 41285
Received 7th April 2015 Accepted 30th April 2015
DOI: 10.1039/c5ra06180f
www.rsc.org/advances
RSC Advances
There are two critical steps in the conversion of cellulosic components of lignocellulosic biomass into fuels and chemicals: hydrolysis and dehydration processes. In the hydrolysis process, hemicellulose is converted intove- and six-carbon sugars under catalysis by mineral acids (mostly sulfuric acid) while cellulose
ber is enzymatically hydrolyzed into glucose by commercial cellulase and cellobiase enzymes. The resulting aqueous mixture of fermentable sugars containing xylose, arabinose and glucose then undergoes dehydration reaction, leading to formation of levulinic acid (LA) and furan derivatives. In the next process, the aqueous solution containing LA undergoes catalytic reduction with molecular hydrogen to form gamma-valerolactone (GVL), which serves as a high-value chemical intermediate for the production of straight and branched alkanes and cycloalkanes with appropriate molecular weight and structure for use in gasoline and jet fuel applications. Intensive research activities have sought to develop a simple yet highly efficient catalyst for the hydrogenation of LA to GVL. Heterogeneous catalysts based on noble metals such as Pd, Ru, Rh, Pt, Au and Ir and base metals such as Fe, Cu, Co and Ni on carbon, zeolite or metal oxide support materials have received much attention for practical use,8,10,12–18mainly associated with their advantages such as ease
of catalyst separation, reusability, less damage to reactor and relatively high turnover numbers (TONs). Homogeneous catalytic systems have also shown great potential for the hydrogenation of LA to GVL in terms of catalyst activity and selectively under relatively mild reaction conditions. For instance, ruthenium/ phosphine complexes, especially complexes with the facially coordinating tridentate ligand (TriPhos) have found application as a highly active catalyst toward carbonyl compounds such as esters and amides and even free carboxylic acids in the homo-geneous hydrogenation reaction.19 Robust iridium trihydride
complexes of pincer ligands with TONs as high as 71 000 have been tested for the synthesis of GVL from hydrogenation of biomass-derived LA under relatively mild reaction conditions by Zhou and his group20and the GVL yield could reach 99%. Very
recently, Tukacs and co-workers have reported the application of ruthenium catalysts modied with bidentate phosphine ligands and they showed that the proposed catalytic system could be reused for ten consecutive runs while achieving full conversion of LA with a representative turnover frequency (TOF) of 21 233 h 1 in solvent-, chlorine- and additive-free reaction environments.21
GVL has proved to demonstrate many of the important properties of an ideal liquid fuel including renewable, easy and safe to store and transport, very low vapor pressure even at high temperature (3.5 kPa at 80C), high boiling point (207C) and open cupash
point (96C) and miscible with water.22Therefore, the
produc-tion of GVL from lignocellulosic biomass has moved globally in large numbers and very recent potential applications include a green reaction medium for the conversion of various carbohy-drates to 5-hydroxymethylfurfural (5-HMF) and LA,22,23 ionic
liquid phase catalytic system for the hydrogenation of different olens,24precursors in manufacturing bio-based polymers and
resins25or chemical additives for gasoline and diesel fuel.23
Sugarcane bagasse (SB) is a major agro-industrial byproduct generated from the sugar milling. In the sugar milling process, a part of thisbrous residue is normally burned to generate
steam and electricity for factory operation and stockpiling becomes a common practice for handling the excess bagasse. However, long-term storage of large quantities of bagasse in the uncovered stockpiles continues to be a menace to the environ-ment and surrounding communities through hazards associ-ated with spontaneous combustion, groundwater seepage and generation of contaminated leachates. It is required tond a suitable use for the excess bagasse as a means of managing these hazards and minimizing potential environmental impacts. SB is composed of cellulose, hemicellulose and lignin and more importantly this lignocellulosic biomass has signi -cant advantage that it does not interfere with food resources for chemicals and fuels production. Several studies22,23,26 have
demonstrated different methods for transforming sugars in lignocellulosic biomass into sustainable platform chemicals such as LA, GVL and furanic aldehydes (e.g., 5-HMF and furfural). For instance, the high sugar-containing juice derived from sweet sorghum can be utilized as a non-food source to produce platform molecules namely LA and 5-HMF by a microwave dielectric heating method.27The maximum yield of
LA (31.4%) was achieved from the sorghum sample treated for 20 min centrifugation time in the presence of 2 M sulfuric acid under 30 min microwave irradiation. Horvath and co-workers28
investigated several intermediates and different reaction path-ways in the acid-catalyzed dehydration of fructose to 5-HMF in dimethyl sulfoxide solvent with or without sulfuric acid as catalyst. They found from isotopic labeling results that the reversible formation of 2,6-anhydro-b-D-fructofuranose
inter-mediate played a crucial role in controlling two irreversible pathways toward desirable product (5-HMF)viaa furanose route or toward the unwanted side productsviaa pyranose route. In this study, we utilize non-food SB biomass as a potential raw material for the production of GVL via a two-step process involving arst step for hydrothermal conversion of biomass to LA and a second step for hydrogenation of LA to GVL. In therst step, subcritical water (hereaer called sub-CW) is used as a
reaction medium, which is safe, non-toxic, inexpensive and readily available. The native and acid-activated bentonites are used as heterogeneous solid acid catalysts in therst step and the catalyst performance study for given reaction is presented. On the other hand, titania-supported platinum catalysts (Pt@TiO2) in the absence or in combination with acid-activated
bentonite as a co-catalyst are utilized in the second step. The catalyst performance evaluation in the second step is based on LA conversion, GVL selectivity and GVL yield. Furthermore, the effects of temperature and residence time on the extent of hydrogenation of LA to GVL are investigated and discussed in this paper. Finally, studies were carried out to assess the potential reuse of the hydrogenating catalyst in at least ve consecutive reaction cycles.
Experimental
Materialsoven at 80C for 12 h. The dried biomass was pulverized using a
bench-scale hammer mill to particle sizes ranging from 0.15–
0.18 mm (80/100 mesh, U.S. Sieve Series). Moisture content of the pulverized biomass was determined by using an Ohaus® MB-35 moisture analyzer. Delignication step was conducted by soaking powdered biomass into a 20 wt% sodium hydroxide solution with a solid to solution ratio of 1 : 10 under continuous stirring (500 rpm) at room temperature for 24 h. The treated biomass was separated by vacuumltration, washed with warm distilled water until the pH of the washing solution ranged between 6.5 and 7 and oven-dried at 110C for 12 h. Thenal
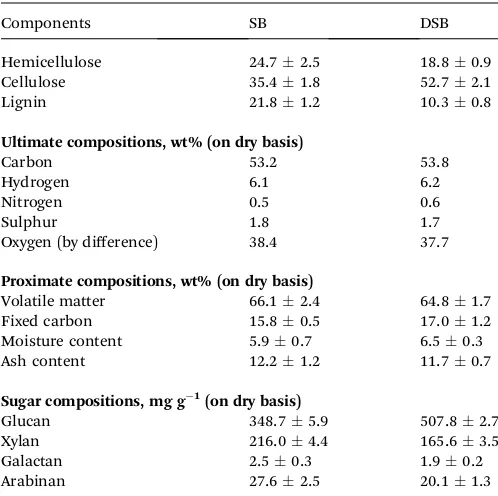
product (DSB) was stored in sealed plastic bags for further use. The determination of lignocellulose contents of SB and DSB samples was carried out following the standardized wet chem-ical methods used in the wood industry sector. The percentage weights of the elements C, H, N, O and S of SB and DSB samples were determined by a CHNS/O analyzer model 2400 from Perkin-Elmer. The proximate analysis was conducted following the established ASTM procedure. The results from three repeated analyses are presented as average valuesstandard deviations (Table 1).
Natural Ca-bentonite with grayish white color was collected from a mining site located at Pacitan district in East Java. Prior to its use, the bentonite was puried according to the procedure described by Soetaredjo and colleagues.29 The chemical
composition of the puried bentonite was SiO2(63.5%), Al2O3
(17.8%), Fe2O3(2.2%), MnO2(0.5%), TiO2(0.2%), MgO (1.2%),
K2O (1.6%), Na2O (1.5%), CaO (2.8%) and LOI (loss on ignition)
(8.7%). The montmorillonite content of the bentonite was 78%. Anatase titanium(IV) oxide (TiO2) powder (99%) was purchased
from Sigma Aldrich, Singapore and used as-received. For chemical analysis and preparation of catalysts, the following reagents include anhydrous sodium hydroxide pellets (98%,
Sigma Aldrich), sulfuric acid (98%, Merck), chloroplatinic acid hexahydrate (8 wt% in H2O, Aldrich), acetonitrile (LC-MS
CHROMASOLV®, 99.9%, Fluka), hexyl alcohol (99.9%, Fluka) and standards ofD(+)glucose (99.5%, Sigma), D(+)xylose (99%,
Aldrich), L(+)arabinose (98%, Aldrich), D(+)galactose (99%,
Fluka), furfural (98.5%, Fluka), 5-HMF (98%, Fluka), LA (98%, Aldrich) and GVL (98.5%, Fluka) were directly used without further purication. Ultra-high purity nitrogen and hydrogen gases (99.9%) were supplied by a local company. The ultrapure water obtained from a Milli-Q waterltration station (Millipore Corp., Milford, MA) was used in all experiments unless other-wise stated.
Preparation of catalyst materials
Natural Ca-bentonite was utilized as a heterogeneous solid catalyst in this study due to its mechanical and hydrothermal stability, low swelling capacity, high cation exchange capacity (CEC, 58.3 meq. 100 g 1clay according to methylene blue test method designed in ASTM C837-99), environmentally benign and easily obtainable material. The acid treatment of bentonite aims to enhance its adsorption and catalytic properties for the hydrolysis of cellulosic components of biomass into water-soluble saccharides. The acid-activated bentonite was prepared based on the following procedure: 50 g of puried bentonite was immersed in a 500 ml solution of sulfuric acid (2 N) and transferred into a round-bottomask. The resulting suspension was heated at 80C under reux and stirring for 4 h.
Then, the solid was separated by vacuumltration, washed with warm distilled water until free of sulphate ions (tested by BaCl2
solution) and dried in an oven at 110 C for 6 h. The
acid-activated bentonite was crushed and sieved to particle sizes of 125–150mm. Here, the untreated and acid-activated bentonite samples were designated as UB and AAB, respectively. The titania-supported 1 wt% Pt catalyst (1% Pt@TiO2) was prepared
by incipient wetness impregnation method based on Zhang and co-workers procedure.30
Characterizations of biomass precursors and catalyst materials
The thermal stability of SB and DSB samples was determined by thermal gravimetric analysis (TGA) using a Mettler-Toledo TGA/DTA 1 thermal analyzer with a heating and cooling rate of 10 K min 1up to 1073 K under continuous nitrogen gas
ow of 150 ml min 1. The mass of the samples in each experiment
was about 10 mg. The surface morphology of biomass precur-sors and catalyst materials was visualized by scanning electron microscope (SEM), on a JEOL JSM-6390F operated at an accel-erating voltage of 10 kV. Prior to SEM imaging, an ultra-thin layer of conductive platinum was sputter-coated on the speci-mens using an autone coater (JFC-1200, JEOL, Ltd., Japan) for 120 s in an argon atmosphere. The powder X-ray diffraction (XRD) patterns were acquired on a Philips PANalytical X'Pert powder X-ray diffractometer with a monochromated high-intensity Cu Ka1 radiation (l ¼ 0.15406 nm) operating at
40 kV, 30 mA and a step size of 0.05 s 1 in the 2-theta scan
range of 5–90. The peak locations corresponding to the
Table 1 Characteristics of SB and DSB lignocellulosic materials
Components SB DSB
Hemicellulose 24.72.5 18.80.9
Cellulose 35.41.8 52.72.1
Lignin 21.81.2 10.30.8
Ultimate compositions, wt% (on dry basis)
Carbon 53.2 53.8
Hydrogen 6.1 6.2
Nitrogen 0.5 0.6
Sulphur 1.8 1.7
Oxygen (by difference) 38.4 37.7
Proximate compositions, wt% (on dry basis)
Volatile matter 66.12.4 64.81.7
Fixed carbon 15.80.5 17.01.2
Moisture content 5.90.7 6.50.3
Ash content 12.21.2 11.70.7
Sugar compositions, mg g 1(on dry basis)
Glucan 348.75.9 507.82.7
Xylan 216.04.4 165.63.5
Galactan 2.50.3 1.90.2
crystalline phases were compared with standard JCPDS les. The specic surface areas and pore structures of the catalysts were characterized by nitrogen adsorption–desorption isotherms. The adsorption and desorption isotherms were conducted at the boiling temperature of liquid nitrogen (77.2 K) using an automated Micromeritics ASAP2010 sorption appa-ratus. Before measurements, the samples were outgassed under vacuum for 6 h at 473.2 K. The Brunauer–Emmett–Teller (BET) equation was used to calculate the specic surface area from adsorption data in the relative pressure (P/Po) range of 0.01–
0.30. Total pore volume (VT) was determined from the amount
of adsorbed gas at a relative pressure of 0.995.
Catalytic hydrothermal conversion of DSB biomass
The hydrothermal conversion of DSB biomass was carried out in a 150 ml lab-scale high pressure batch reactor. The high pres-sure batch reactor was equipped with a prespres-sure gauge, an external electrical heating system, a Type K thermocouple as internal temperature control device and M8 screws for tight-ening the reactor with its cap. The maximum allowable oper-ating pressure and temperature of the reactor are 10 MPa and 523.2 K, respectively. Typical hydrothermal conditions were described as follows: temperatures 393.2–473.2 K, catalyst loading 0–2% (w/v), DSB to water ratio 1 : 10 (w/v), stirring speed (300 rpm) and internal pressures (3–5 MPa). The hydro-thermal reaction was conducted at desired temperatures for 60 min and aer the completion of reaction, the reactor was rapidly cooled down to room temperature by quenching in a cold water bath and the gas pressure was recorded and vented. The solid fraction was separated by centrifugation at 3000 rpm for 15 min. An aliquot of liquid samples obtained aer the reaction was withdrawn and the concentrations of 5-HMF, furfural, LA, organic acids and monomeric sugars were quan-tied by using high performance liquid chromatography (HPLC) as described later.
Catalytic hydrogenation of hydrothermal liquor containing LA
The catalytic hydrogenation reactions were performed in a 250 ml Parr 4576A bench top stirred HP/HT reactor equipped with a temperature controller unit (model P.I.D. 4843), a pressure transducer and gage and overhead stirring. Before use, the catalyst was activated underowing H2 at 573.2 K and
atmo-spheric pressure for 3 h. In a typical procedure, the aqueous solution containing LA obtained from hydrothermal reaction at 453.2 K with 2% AAB catalyst was introduced into the reactor, followed by the addition of 0.5 g of catalyst comprising 0.4 g 1% Pt@TiO2 and 0.1 g AAB as an acid co-catalyst. An equivalent
amount of 1% Pt@TiO2hydrogenation catalyst (0.4 g) was also
used in the reaction. In order to remove air inside the reaction vessel, the reactor was slowlyushed with argon three times before hydrogen gas was charged. Aerward, the reactor was
pressurized with hydrogen gas to 3 MPa and sufficient temperature ramping time was allowed before the reaction step at the chosen temperature. Zero reaction time was dened when the temperature inside the reactor reached the chosen temperature. The hydrogenation reactions were performed at
temperatures of 393.2–473.2 K and residence times were varied between 120 and 360 min. During the course of the reaction, mixing was achieved through an internal 4-blade impeller operating at 1200 rpm. Preliminary experiments showed that this stirring speed was sufficient to avoid external mass transfer limitation, thus ensuring the reaction operates in the kinetic regime. Aer the predetermined reaction time, the reactor was
rapidly cooled down to room temperature and the residual gases were discharged. The reaction mixtures containing liquid and solid fractions were centrifuged at 3000 rpm for 15 min and then vacuum-ltered to obtain a clear solution.
HPLC analysis of the product mixture from hydrothermal reaction
The aqueous phase containing various water-soluble reaction products from hydrothermal liquefaction of DSB was analyzed using a Jasco chromatographic separation module consisting of a model PU-2089 quaternary low pressure gradient pump, a model RI-2031 refractive index detector and a model LC-NetII/ ADC hardware interface system. All solution samples were
ltered through a 0.22mm PVDF syringelter prior to injection in the HPLC. The analysis of monomeric sugars including glucose, fructose, xylose, galactose and arabinose was con-ducted with an Aminex HPX-87P sugar column (Bio-Rad, 300
7.8 mm) using degassed HPLC-grade water isocraticallyowing at a rate of 0.60 ml min 1. The column was operated at 358.2 K
and detection of effluent sugars was performed by using a RI-2031 detector. For the analysis of simple organic acids (i.e., formic, acetic and levulinic acids) and furan derivatives (i.e., 5-HMF and furfural), the separation of compounds was achieved with a Bio-Rad Aminex HPX-87H column (3007.8 mm) using isocratic elution of sulfuric acid aqueous solution (5 mM) as the mobile phase at a ow rate of 0.60 ml min 1. The RI-2031 detector was used to identify the compounds and the column oven was set to 328.2 K. The concentrations of each compound in the product mixture were determined using the calibration curves obtained from the injection of solutions of authentic samples with known concentrations.
Gas chromatography analysis of the reaction products containing GVL
The reaction products containing GVL were quantitatively analyzed by using a Shimadzu GC-2014 gas chromatograph equipped with a Phenomenex Zebron™ ZB-Wax capillary column (30 m length0.32 mm i.d., 0.25mmlm thickness) and aame ionization detector (FID). The carrier gas was ultra-high purity (UHP) grade helium (99.99%) with a constantow rate of 1.0 ml min 1. The injection volume was 1.0ml in splitless mode. The following temperature program was used in the analysis: an isothermal step at 60C (held for 3 min), which was
ramped at a rate of 10C min 1to 230C and held for 5 min.
The injector and detector temperatures were kept at 250 and 300 C, respectively. The identication of reaction products
concentration range of the samples were used to construct the calibration curves for quantifying the concentrations of the compounds of interest.
Results and discussion
The characteristics of SB and DSB samples include elemental and proximate compositions and their lignocellulose contents are presented in Table 1. In order to examine the thermal stability of biomass precursor, TGA was conducted under nitrogen environment by raising the temperature gradually from ambient to an upper limit of 1073.2 K, where it is safely assumed that all the elemental oxygen and hydrogen are liber-ated to gaseous compounds, thus leaving only elemental carbon. TGA result indicates that SB is a potential feedstock for energy and chemical production due to high cellulose (35.4%) and hemicellulose (24.7%) contents, which are the main sour-ces of fermentable sugars. From TGA curves shown in Fig. 1, it is clearly seen that SB sample undergoes a gradual thermal decomposition process with a signicant weight loss happening at temperatures between 260 and 360C. The weight loss of
about 60% corresponds to the rapid breakdown of hemi-cellulose and hemi-cellulose fractions with the DTG peak tempera-tures at 295 and 352C, respectively. The degradation of lignin
might also happen over this temperature range, which is primarily caused by the breakdown of chemical bonds with low activation energy.31 A minor weight loss about 5% occurring
between 400 and 500C is attributed to the lignin degradation
reaction involving the breakdown of more stable bonds. The temperature regions where depolymerization of hemicellulose and the random cleavage of the glycosidic linkages in cellulose structure occur are in good agreement with the studies of Yang
et al.,31 Garcia-Perez et al.32 and Cao and Aita.33 At high
temperatures between 500 and 800C, the weight loss signal
was not very evident, approaching a value for the charcoal yield of 15.7%. The cellulose, hemicellulose and lignin contents (on a dry basis) of SB sample obtained from TGA method are in good agreement with the values determined from“wood-industry”
methods and the established protocols of National Renewable Energy Laboratory (NREL). The thermogravimetric curve of DSB sample shows a similar characteristic to that of SB sample with higher onset of degradation temperatures for hemicellulose and cellulose at 306 and 364C, respectively. This indicated that
the treated biomass exhibited higher thermal stability due to the lignin and hemicellulose removal. Maximum rates of weight loss occur between 270 and 380 C for delignied biomass.
Again, the amount of weight loss was insignicant at high temperatures between 500 and 800C, yielding residual carbon
of 17.2%. The individual monosaccharides include glucose, xylose, galactose and arabinose present in the hydrolysate solution obtained from dilute acid hydrolysis (5% HCl under reux at 96C for 2 h) of SB and DSB samples were quantied
with a chromatographic procedure of du Toitet al.34and the
monomeric sugar yields, in the unit of mg g 1 dry biomass,
were given as follows: glucose (387.4) for SB and (564.2) for DSB, xylose (245.5) for SB and (188.2) for DSB, galactose (2.8) for SB and (2.1) for DSB and arabinose (31.4) for SB and (22.8) for DSB. In this respect, the concentrations of the polymeric sugars corresponding to its monosaccharide units (Table 1) are calculated according to NREL conversion formula.
Lignin can act as a physical barrier, encapsulating and conning cellulose and this complex three-dimensional aromatic polymer architecture is highly recalcitrant toward enzymatic, chemical and biological degradation. Therefore, pretreatment strategy to promote efficient hydrolysis is an essential step in the lignocellulosic biomass-processing bio-reneries to reduce the inherent lignocellulosic cell wall recal-citrance for cost-effective downstream processing. Since the biomass feedstock contains a quite high portion of lignin (21.8%), delignication pretreatment with NaOH solution is employed to effectively remove lignin from the biomass, at the expense of parts of the structural carbohydrates are decom-posed. Aer delignication, the lignin content signicantly
decreased from 21.8% in the native biomass to 10.3% in the treated biomass. In line with this, the concentrations of poly-meric hemicellulose sugars including xylan, galactan and ara-binan in the treated biomass were 165.6, 1.9 and 20.2 mg g 1 dry biomass, respectively, indicating that alkaline deligni ca-tion brought hemicellulose dissoluca-tion. On the other hand, most of the glucan portion was preserved during delignication pretreatment, which could be ascribed to the robust crystalline structure and low reactivity of cellulose with alkali. For comparison purposes, the alkaline delignication conditions of various lignocellulosic biomass resources are listed in Table 2. From this table, it can be shown that delignication efficiency varies greatly with process conditions and types of the biomass feedstocks. In general, alkali pretreatment is more effective for removing a substantial portion of lignin from hardwood biomass and agriculture waste products. Moreover, the delignication efficiency under conditions described in this study (52.8%) compares well with other studies performed at higher temperatures (e.g., 368.2, 394.2 and 433.2 K) and shorter residence time (e.g., 1, 1.5 and 3 h) in the absence of stirring. The main chemical mechanism by which the lignin polymer degrades in alkaline and alkaline-oxidative environments has
been mechanistically studied and is through the cleavage of hydrolysablea- andb-aryl ether bonds in lignin and glycosidic bonds in polysaccharides. Meanwhile, hemicellulose dissolu-tion and cellulose swelling are a consequence of hydrogen bond weakening. The post-pretreatment biomass washing step by warm or hot distilled water aims to remove the alkali residues, soluble phenolics and other degradation products formed during lignin depolymerization. In this regard, the concentration of alkali metal ion remained with the washed biomass was very low or absent aer repeated washing step. The pretreatment liquor
from delignication step containing dissolved lignin, lignin-derived soluble phenolics, acetic acid, hemicellulose-lignin-derived poly/oligosaccharides, proteic compounds and other extractives can be reclaimed for further applications such as production of bioethanol or biohydrogen.
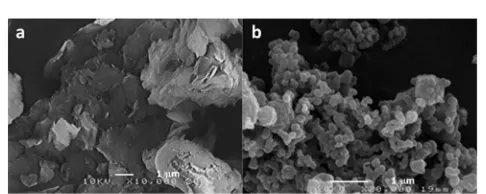
Alkaline delignication pretreatment had a notable effect on the biomass morphology. Images obtained by SEM show some visible changes associated with the biomass wall disruption aer delignication. The rod-like morphology of native biomass (SB) was easily recognizable in Fig. 2(a) and the untreated SB had a relatively smooth and intact surface. Delignication pretreatment by NaOH resulted in the disrupted surface struc-ture due to the breakdown of lignin as shown in Fig. 2(b) and therefore the surface of delignied biomass (DSB) appears rougher when compared to the native biomass. Moreover, the structure of DSB biomass was opened up as a result of lignin removal, indicating the more available or exposed surface area of cellulose for hydrolysis. Fig. 2(c) depicts the morphological features of DSB biomass wall aer sub-CW treatment. The
surface structure of sub-CW treated DSB biomass changed signicantly when compared with DSB sample, showing a sponge-like structure. The small pores/cavities formed on the wall of sub-CW treated DSB sample might be the result of release of hemicellulose or cellulose decomposition products from the interior of the biomass particle. Fig. 2(d) shows the aggregates of irregularly-shaped, non-uniform solid particles obtained from hydrothermal conversion of DSB sample. The
size distribution of the solid aggregates ranged from tens of microns to submicron. The electron micrograph clearly reveals that spherical particles were not likely formed in the hydro-thermal processing at low temperatures. Titirici and group42
obtained sphere-shaped and monodisperse hydrothermal carbons derived from pure glucose at 533.2 K while the overall morphology of hydrothermal carbons derived from cellulose and rye straw (a model of lignocellulosic biomass) was not as homogeneous as from pure glucose, with some structural components of the precursor material still remained intact and arranged together with spherical carbon particles. The elemental composition analysis was conducted by an INCA energy dispersive X-ray microanalysis system integrated with the hardware of the SEM and result showed that the solid
Table 2 Summary of alkaline delignification conditions of various lignocellulosic biomass resources
Lignocellulosic resources
Delignication conditions
Delignication efficiency (%) Alkali
Solid–liquid ratio (w/v)
Temperature (K)
Residence
time Stirring speed (rpm)
Sugarcane bagasse–Aitaet al.33 NH4OH 1 : 20 433.2 1 h NA 14
Corn stalk–Yuet al.35 NaOH 1 : 15 333.2 1.5 h NA 60
Corn stover–Kim and Holtzapple36a Ca(OH)
2 1 : 2 328.2 4 weeks NA 87.5
Sorghum–Salviet al.37a NH4OH 2 : 1 433.2 1 h NA 44
Cotton stalk–Silversteinet al.38 NaOH 1 : 10 394.2 1.5 h NA 65.6
Switchgrass–Gupta and Lee39 NaOH 1 : 10 358.2 24 h NA 76.1
NH4OH 1 : 10 393.2 24 h NA 67.8
Mixed hardwood chips–Yuet al.40b GL 1 : 4 433.2 Not available NA 28.8
Rice straw–Chenget al.41c NaOH 5 : 1 328.2 3 h NA 23.1
Ca(OH)2 10 : 1 368.2 3 h NA 24.4
Sugarcane bagasse–this study NaOH 1 : 10 Room 24 h 500 52.8
aThe loading ratios of alkali to raw biomass are given on a mass basis.bGL (green liquor) is an alkaline solution prepared by mixing sodium carbonate and sodium sulde with a suldity of 25%.cThe loading ratio is expressed as g H
2O g 1oven-dried rice straw with an alkali loading
of 4 wt% for NaOH and 10 wt% for Ca(OH)2.
aggregates were comprised of elemental carbon (64.8 at%) and oxygen (35.2 at%).
The morphological features of the catalysts are depicted in Fig. 3. From SEM images, it can be seen that UB catalyst is aluminosilicate clay with a layered structure and smooth surface. The specic surface area of UB catalyst calculated from the BET method was 61.8 m2g 1and its total pore volume was 8.310 2cm3g 1. Nitrogen adsorption–desorption isotherms revealed a classical combination of micro/mesoporous struc-tures in the catalyst particle. Aer chemical modication by
sulfuric acid, some evident changes in the platelet morphology of UB catalyst were observed. Generally speaking, an acid treatment results in the replacement of exchangeable cations that are between the layers (i.e., Na+, K+or Ca2+) with H+ions of
the acid and depending on the treatment conditions, partial delamination of Al-octahedral and Si-tetrahedral layers, fol-lowed by subsequent dissolution of structural cations (typical examples are Fe2+/3+, Mg2+or Al3+in the Al-octahedral layer and Al3+or Si4+in the Si-tetrahedral layer).43The small di
fference in CEC between UB (58.3) and AAB (57.5) samples suggests that the structural cations in the Al-octahedral and Si-tetrahedral layers are marginally affected by dilute acid attack. The surface acidity (or catalytic acid sites) of the bentonite, as determined by a simple acid–base titration method,44 increased dramatically
from 30.7 (UB) to 118.2 meq. 100 g 1clay aer treatment by 2 N
sulfuric acid. Results of nitrogen adsorption–desorption measurements for AAB catalyst show an increase in the BET specic surface area and total pore volume. The BET specic surface area and total pore volume of AAB catalyst are 122.4 m2 g 1 and 0.12 cm3 g 1, which is
2- and 1.5-fold higher compared to those values of UB catalyst. The scanning electron micrograph of 1% Pt@TiO2in Fig. 3(b) shows that the
catalyst is spherical-like irregular particles with average diam-eter sizes are in the submicromdiam-eter range (150–200 nm). The BET specic surface area of 1% Pt@TiO2was lower compared to
bare TiO2(48.4vs.51.3 m2g 1), likely due to the deposition of ne Pt particles on the surface of the support that might block pores of TiO2.
The wide angle XRD patterns of AAB and 1% Pt@TiO2
lysts are shown in Fig. 4. From the XRD spectrum of AAB cata-lyst, the montmorillonite (2q ¼ 6.7, 20.2, 21.8, 35.1 and
61.8) and quartz (2q¼ 26.8, 50.4and 68.3) are the major
phases with other minor reections corresponding to mineral impurities of crystobalite, calcite, K-feldspar, mica and/or illite
phases. The reection at 2q ¼ 6.7 is correlated to the basal
spacing (001) of montmorillonite, corresponding to a value of 1.32 nm. Compared to UB catalyst, the position of the (001) basal reection in AAB catalyst remains essentially unchanged (2q ¼6.8, 1.30 nm), showing the minor effect of dilute acid
treatment on the lattice structure of clay. As it can be seen from Fig. 4(b), the bare TiO2exhibits reections at 2qangles of 25.5,
37.2, 38.0, 48.1, 54.4, 55.2, 62.7 and 68.9 in which all
these reection peaks can be well indexed to the (101), (103), (004), (200), (105), (211), (204) and (116) crystal planes of TiO2
with anatase phase according to JCPDS database card no. 21-1272. The diffraction lines for (111), (200) and (220) of Pt cubic phases were located at about 2qangles of 39.8, 46.4and 67.5
(JCPDS database card no. 04-0802). Result showed that the diffraction pattern of 1% Pt@TiO2was essentially the same as
that of diffraction pattern from bare anatase TiO2. Similar
observations have been noted by Zhanget al.30and Moonsiri et al.45in their studies. The absence of di
ffraction signals from metallic Pt species could be attributed to the small size and highly distributed Pt particles supported on TiO2. Zhang and
co-workers30observed that Pt particles were highly dispersed on
TiO2support into a size smaller than 1 nm from high-resolution
transmission electron microscope (HRTEM) image. Hence, we believe that in case of fresh 1% Pt@TiO2catalyst, the average Pt
particle sizes are around 1 nm (or even smaller) since the catalyst preparation in our study was adopted from Zhanget al.
procedure. The high dispersion of nano-sized Pt particles on anatase TiO2support could be very important for high activity
and selectivity of this catalyst in the hydrogenation of LA. In the hydrothermal reaction with the aim of producing building block chemicals for clean liquid fuels, the cellulose and hemicellulose components of biomass were hydrolyzed to six andve carbon sugar monomers, followed by dehydration reactions of these monomeric sugars to produce 5-HMF and furfural in water under subcritical condition. Given the fact that sub-CW possesses the catalytic role of an acid or base and has been widely used as an alternative medium for the conversion of lignocellulosic biomass into platform chemicals, Table 3 pres-ents the conversion yields of cellulose and hemicellulose components of DSB biomass into a variety of reaction products including sugars, 5-HMF, furfural and organic acids in the absence or presence of solid acid catalysts. From this table, it is easily noticed that the performance of non-catalyzed, mildly sub-CW treatment for cellulose hydrolysis is not so impressive with glucose yield ranged between 32.74 and 54.18 mg g 1dry
biomass (3.27–5.42 wt%) in the temperature range of 393.2–
473.2 K for 60 min reaction. The incomplete and slow conver-sion rate of cellulose into glucose under non-catalyzed, mildly sub-CW treatment might be due to the fact that hydrolysis reaction was limited at the surface region without cellulose swelling and dissolution compared to the reaction taking place in high-density regions (near-critical and supercritical water)46
as well as insufficiently high temperature to disrupt the robust structure of cellulose. Hemicellulose-derived monosaccharides were also present in the reaction product mixture, accounting for 3.3–4.1 wt% yields. The quantities of 5-HMF and LA were barely detectable in the reaction product mixture, affording
yield less than 0.2 wt%. In pure sub-CW medium, the dehy-dration of glucose into 5-HMF is non-selective,47 leading to
formation of multiple side-products and insoluble carbona-ceous residue ‘humin’. The reaction mixture aer sub-CW treatment also turned into dark brown, which could be ascribed to the formation of soluble and insoluble polymeric side-products. These polymeric side-products were not charac-terized in this study due to several analytical issues. The pres-ence of furfural was detected in the reaction product mixture and a maximum yield of 0.95 mg g 1was achieved at 453.2 K. The furfural yield for non-catalyzed, mildly sub-CW treatment in this study compares well with results in the literature for a one-stage process where hydrolysis and dehydration reactions occur simultaneously within the same reactor.
In the absence of catalysis, the hydrothermal degradation rate of cellulose to glucose is not signicant. It was later revealed by Kuster48that the enolization rate of glucose, a
rate-determining step for 5-HMF formation, is slow in water and intermediate 5-HMF is more likely to undergo a series of unwanted side reactions such as condensation, rehydration,
fragmentation and cross-polymerization reactions involving sugars, water molecules and various reactive intermediates. The use of heterogeneous solid acid catalysts for enhanced cellulose conversion and also selective and high-yielding production of 5-HMF and LA has been coming up to a promising direction of research. In this regard, clays and clay minerals can catalyze chemical reactionsviaBronsted and/or Lewis acid sites on their surfaces although native or natural clays generally show low or almost no catalytic activity prior to acid or cation exchange treatments. As expected, the cellulose conversion catalyzed with UB solid slightly enhanced compared with blank reaction (no catalyst) and the glucose yield reached only 89.41 mg g 1dry biomass for 60 min reaction at 453.2 K. Low catalytic activity of untreated bentonite might lead to speculation that the solid acid catalyst is not active enough for promoting hydrolysis of cellulose, possibly attributed to: (1) the surface of solid acid catalyst cannot readily adsorb or attach to cellulose andb-1,4 glucan in water or (2) the absence of freely available, strong Bronsted acid sites for decomposing hydrogen bonds and hydrolyzingb-1,4 glycosidic bonds in cellulose. Under the same
Fig. 4 XRD patterns of AAB (a) and bare TiO2and 1% Pt@TiO2catalysts (b).
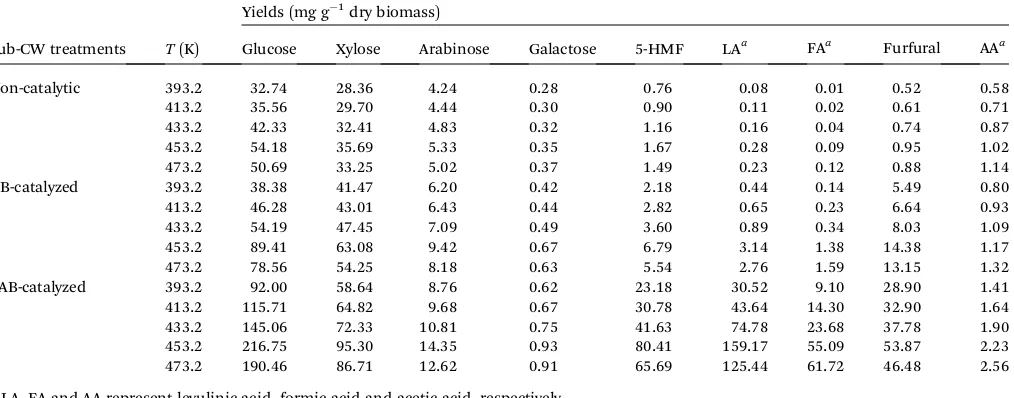
Table 3 Non-catalytic and catalytic results of sub-CW treatment of DSB biomass in the presence of 2% (w/v) UB or AAB clay-based catalysts at various temperatures for reaction time of 60 min
Sub-CW treatments T(K)
Yields (mg g 1dry biomass)
Glucose Xylose Arabinose Galactose 5-HMF LAa FAa Furfural AAa
Non-catalytic 393.2 32.74 28.36 4.24 0.28 0.76 0.08 0.01 0.52 0.58
413.2 35.56 29.70 4.44 0.30 0.90 0.11 0.02 0.61 0.71
433.2 42.33 32.41 4.83 0.32 1.16 0.16 0.04 0.74 0.87
453.2 54.18 35.69 5.33 0.35 1.67 0.28 0.09 0.95 1.02
473.2 50.69 33.25 5.02 0.37 1.49 0.23 0.12 0.88 1.14
UB-catalyzed 393.2 38.38 41.47 6.20 0.42 2.18 0.44 0.14 5.49 0.80
413.2 46.28 43.01 6.43 0.44 2.82 0.65 0.23 6.64 0.93
433.2 54.19 47.45 7.09 0.49 3.60 0.89 0.34 8.03 1.09
453.2 89.41 63.08 9.42 0.67 6.79 3.14 1.38 14.38 1.17
473.2 78.56 54.25 8.18 0.63 5.54 2.76 1.59 13.15 1.32
AAB-catalyzed 393.2 92.00 58.64 8.76 0.62 23.18 30.52 9.10 28.90 1.41
413.2 115.71 64.82 9.68 0.67 30.78 43.64 14.30 32.90 1.64
433.2 145.06 72.33 10.81 0.75 41.63 74.78 23.68 37.78 1.90
453.2 216.75 95.30 14.35 0.93 80.41 159.17 55.09 53.87 2.23 473.2 190.46 86.71 12.62 0.91 65.69 125.44 61.72 46.48 2.56
reaction condition, 5-HMF and LA with the corresponding yields of 6.79 and 3.14 mg g 1 dry biomass were produced. Based on the results obtained, it could be inferred that the product distribution was affected by addition of UB catalyst while minor improvement on the cellulose conversion in water was observed compared to blank reaction. Moreover, the yield values of 5-HMF and LA are higher than those obtained from blank reaction, showing that water, in the presence of acid catalyst, is a favorable medium for promoting rehydration of 5-HMF to LA. Very recently, Li and his team49demonstrated that
the decomposition of 5-HMF to LA was the preferred reaction pathway in water and an unexpectedly high LA yield could be obtained in the presence of Amberlyst™70 as the solid acid catalyst. Under our experimental conditions, fructose was present at trace level in the reaction product mixture either due to limited extent of glucose isomerization to fructose or once formed, fructose was rapidly dehydrated to 5-HMF.50 The
temperature variation experiments for UB-catalyzed hydro-thermal treatment showed an upward trend of cellulose depolymerization rate with temperature. The actual yields of glucose, 5-HMF and LA increased when the reaction tempera-ture was raised from 393.2 to 453.2 K and a decrease in yield was noted at 473.2 K. Such results imply that an increase in temperature not only improves the extent of cellulose depoly-merization, but also enhances the rate of side reactions.
The actual yields of pentoses increased to the range of 47.67–
72.50 mg g 1dry biomass, indicating that UB catalyst was active
for hemicellulose conversion. Over the temperature range studied,ca.0.55–1.44 wt% furfural yields were achieved with UB catalyst having a Si/Al molar ratio of 5.3. A similar increasing trend in pentoses and furfural yields from hemicellulose conversion over synthetic zeolites (HBeta, HMOR and HUSY) and K10 montmorillonite catalysts has been demonstrated as well.51The increase in furfural yield implies that the Bronsted
acid sites located at the external surface of the Si-tetrahedral layer (one may refer to the terminal silanol groups, Si–OH2+)
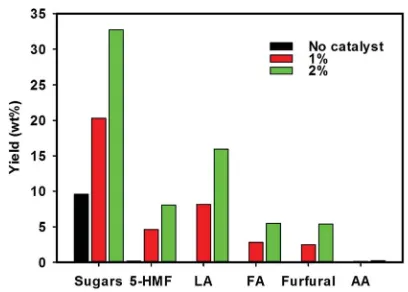
are particularly active in catalyzing the dehydration of xylose to furfural. The effects of catalyst loading on the yields of sugars, 5-HMF, furfural and LA were investigated by varying the catalyst amounts from 0 to 2% (w/v) for 60 min reaction at 473.2 K. Experimental results depicted in Fig. 5 show that higher yields of LA and furfural could be obtained by increasing the catalyst loading from 1 to 2%, due to a higher number of catalytic acid sites are available for reaction. Further increase in the catalyst loading may or may not adversely affect the formation of LA and furfural and optimization of the catalyst loading is beyond the scope of this study.
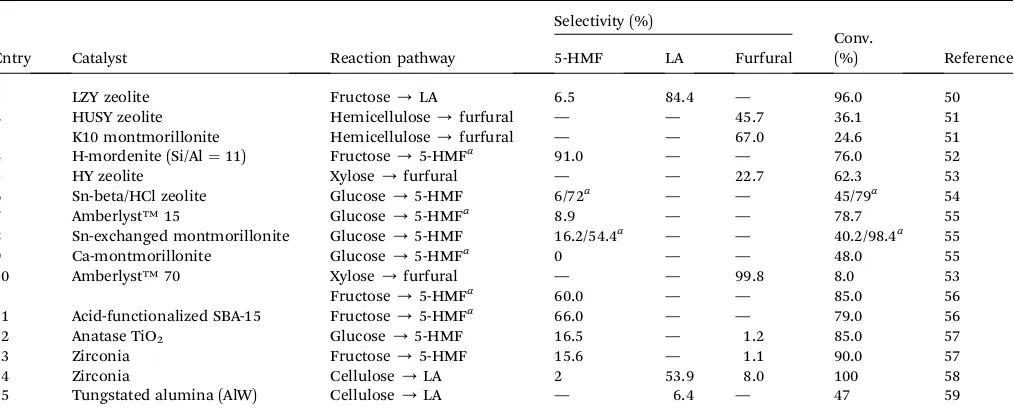
Table 4 summarizes comparison of hexoses (e.g., glucose and fructose), xylose and other carbonaceous feedstocks (cellulose and hemicellulose) conversion into 5-HMF, LA and furfural over solid acid catalysts having only Bronsted acid sites or rationally designed by varying the Bronsted-to-Lewis ([B]/[L]) acid site ratios such as H-mordenite, ion-exchange polymeric resins (Amberlyst™15 and Amberlyst™70), Sn-exchanged montmo-rillonite, acid-functionalized mesoporous SBA-15, K10 mont-morillonite and metal oxides catalysts (TiO2and ZrO2). In this
table, it can be seen that most studies used commercial sources
of high purity sugars or microcrystalline cellulose (MCC, Avicel®) as model compounds to produce 5-HMF or furfural as end products. For this case, the product selectivity term is dened as the mol% yield of targeted product divided by mol% of reactant consumed or mathematically described by: selec-tivity,S(%)¼product yield (mol%)/conv. (mol%). Using simple carbon sources such as glucose, xylose or other mono/ disaccharides, it is reasonable to achieve moderate to very high selectivity toward targeted product due to simpler and better control in reaction within one reactor. Following this statement, the determination of product selectivity term by the above mathematical expression for direct conversion pathways such as from glucose or fructose into 5-HMF, from MCC into LA or from xylose or hemicellulose into furfural is deemed to be valid. On the other hand, there still exists conicting denitions for the product yield and selectivity terms in the study utilizing real lignocellulosic biomass. In such typical cases, the conver-sion of lignocellulosic biomass into platform chemicals involves a complex multi-step route. Another potential issue to consider is the determination of initial amount (moles) of biomass reactant fed into the reactor may not be possible unless a thorough characterization study (e.g., gel permeation chro-matography or cross-polarization magic angle spinning 13
C-NMR spectroscopy) is performed to interpret the molecular mass of biomass. Thus, the product selectivity term for hydro-thermal conversion step is not evaluated in this paper due to a set of main and side reactions are involved during the indirect conversion of DSB biomass to LA and several reaction products remained unidentied by HPLC analysis, which may over-estimate true selectivity values. Another reason was due to the instrumentation issues for conducting a thorough character-ization of biomass feedstock in this study.
On the contrary, the cellulose conversion to glucose and rehydration of 5-HMF to LA was quite signicant with AAB as a solid acid catalyst (Si/Al molar ratio¼ 6.8). AAB catalyst also possesses dual Bronsted and Lewis acidity similar to the untreated bentonite; however the number of Bronsted acid sites appears to be higher than the Lewis acid sites aer H2SO4
treatment. In this regard, the presence of Bronsted acid sites
located at the external surface of the Si-tetrahedral layer and in the interlayer region can serve as the catalytic acid sites for hydrolysis of cellulose to glucose and rehydration of 5-HMF to LA. The Bronsted acid sites in the acid-activated clay might also coordinate with hydroxyl groups bonded with Al3+cations in the
Al-octahedral layer based on FTIR spectroscopic study of Tyagi and his group.60The selective hydrolysis of cellulose to glucose
over various solid acid catalysts include a robust sulfonated activated carbon (AC-SO3H) catalyst at 423.2 K has been
con-ducted by Onda and co-workers.44Further, they found that the
AC-SO3H catalyst displayed signicant catalytic activity and a
remarkably high selectivity toward glucose production, which was attributed to high hydrothermal stability, strong acidic SO3H groups and the hydrophobic graphene planes of the
catalyst. Tong and co-workers61conducted catalytic hydrolysis
of cellulose to reducing sugar in water over acid-activated montmorillonite catalysts and their study showed that the higher concentrations of the Bronsted acid sites in the inter-layer region contributed to greater conversion of cellulose. Since AAB possesses a micro-mesoporous structure with slit-shaped pores of 3–4 nm in diameter, it can be argued that the internal diffusion limitation may not be signicant. The molecular dimensions of monomeric sugars and their degra-dation products are found to be similar to pore sizes of micro-porous materials (0.4–0.9 nm),62thus the 3 to 4 nm-sized pores
are large enough for monomeric sugars, furans (5-HMF and furfural) and simple organic acids (LA) to diffuse in and out of the catalyst particle. Once monomeric sugars or intermediate oligomers (e.g., dimers, trimers or tetramers) are formed within pores, these molecules can enter narrow channels in the cata-lyst particles and interact with internal acid sites to give furans and LA. The Lewis acidity associated with the clay edge sites, although less prominent than the Bronsted acid sites, might
also take part in the catalytic reaction. The Lewis acid sites on clays can also be generated due to octet vacancies that occur as a result of structural metal cations (e.g., Mg2+ or Al3+) being carried away during acid activation. However, the extent of catalysis by the Lewis acid sites toward the rates of cellulose and hemicellulose depolymerization remains unknown in our experiments. The polymerization reactions leading to formation of soluble and insoluble polymeric side-products did occur in the sub-CW treatment catalyzed by AAB solid, but to a lesser extent compared to blank and UB-catalyzed sub-CW treatments. It is anticipated that the catalyst mesoporosity might enhance diffusion of furan and LA products away from the active sites where hydronium-catalyzed side and secondary reactions could occur. In consequence, higher LA yield was obtained in the AAB-catalyzed sub-CW treatment as shown in Table 3. The yield of LA ranged between 30.52 and 159.17 mg g 1 dry biomass in the AAB-catalyzed sub-CW treatment, representing a signicant increase in yield over the range of values obtained from UB-catalyzed sub-CW treatment. Therefore, an aqueous solution containing LA (15.92 wt%) obtained from AAB-catalyzed sub-CW treatment at 453.2 K and 2% catalyst loading was further used in the catalytic hydrogenation process to produce GVL.
Saturated lactone (GVL) can be synthesized from an aqueous solution containing LA by catalytic hydrogenation reaction. For this reaction, it is well recognized that supported catalysts featuring noble metals such as platinum and ruthenium in nano-sizes and highly dispersed form are the most active and product selective toward GVL. In the catalytic hydrogenation of LA to GVL, the reaction pathways can be distinguished into two main routes, depending on the order in which dehydration and hydrogenation occur:63(i) acid-catalyzed dehydration of LA into
angelica lactones (ALs,aorbisomers) as intermediate followed by hydrogenation of ALs to GVL (i.e., dehydration–
Table 4 Conversion and selectivity in the aqueous-phase dehydration reaction of hexoses, xylose and other carbonaceous sources into 5-HMF, LA and furfural catalyzed by various solid acid catalysts
Entry Catalyst Reaction pathway
Selectivity (%)
Conv.
(%) Reference 5-HMF LA Furfural
1 LZY zeolite Fructose/LA 6.5 84.4 — 96.0 50
2 HUSY zeolite Hemicellulose/furfural — — 45.7 36.1 51
3 K10 montmorillonite Hemicellulose/furfural — — 67.0 24.6 51
4 H-mordenite (Si/Al¼11) Fructose/5-HMFa 91.0 — — 76.0 52
5 HY zeolite Xylose/furfural — — 22.7 62.3 53
6 Sn-beta/HCl zeolite Glucose/5-HMF 6/72a — — 45/79a 54
7 Amberlyst™15 Glucose/5-HMFa 8.9 — — 78.7 55
8 Sn-exchanged montmorillonite Glucose/5-HMF 16.2/54.4a — — 40.2/98.4a 55
9 Ca-montmorillonite Glucose/5-HMFa 0 — — 48.0 55
10 Amberlyst™70 Xylose/furfural — — 99.8 8.0 53
Fructose/5-HMFa 60.0 — — 85.0 56
11 Acid-functionalized SBA-15 Fructose/5-HMFa 66.0 — — 79.0 56
12 Anatase TiO2 Glucose/5-HMF 16.5 — 1.2 85.0 57
13 Zirconia Fructose/5-HMF 15.6 — 1.1 90.0 57
14 Zirconia Cellulose/LA 2 53.9 8.0 100 58
15 Tungstated alumina (AlW) Cellulose/LA — 6.4 — 47 59
aDehydration reactions were carried out in biphasic systems such as in water/methyl isobutyl ketone (Entry 4), H
2O/THF with 0.35 g salt per g H2O
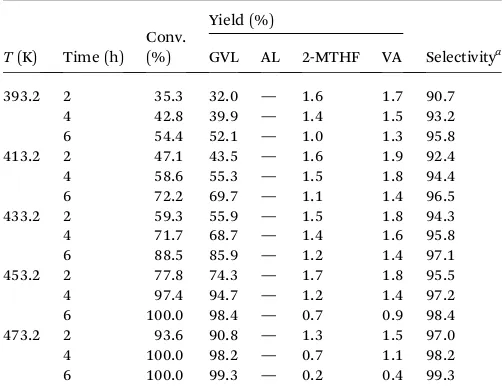
hydrogenation route) or (ii) direct synthesis through 4-hydroxy-pentanoic acid (4-HPA) which subsequently undergoes highly favorable acid-catalyzed intramolecular esterication (ring closure) tove member ring GVL (i.e., hydrogenation– dehydra-tion route). Results for the effects of reaction time and temper-ature on the conversion and GVL selectivity in Pt@TiO2
-catalyzed hydrogenation of LA are shown in Table 5. In this table, it can be seen that the conversion of LA increased with the extension of reaction time, from 59.3% (120 min) to 88.5% (360 min) at 433.2 K. The same promoting effect was noticed for temperature, in which higher LA conversion was achieved by conducting the reaction at higher temperatures. The best cata-lytic activity shown by 1% Pt@TiO2 catalyst was observed at
473.2 K for 360 min reaction, corresponding to 99.3% GVL yield (99.3% selectivity at 100% conversion). The selectivity of 1% Pt@TiO2 catalyst toward GVL in this work was considerably
higher than that reported by Upare and co-workers64 for 5%
Pt@C catalyst (30% selectivity at 100% conversion). The diff er-ence in hydrogenation activity between Pt@C and Pt@TiO2
catalysts might be attributed to the nature of the support material in which TiO2 support could adsorb and activate the
carbonyl group of LA and consequently enhance the catalytic activity several times with respect to conventional Pt supported on carbon that does not perform such activation.65 Another
explanation proposed in the literature for high GVL selectivity over titania-supported catalysts is the absence of strong acid sites that are responsible for formation of GVL decomposition products, for example, 2-methyl tetrahydrofuran (2-MTHF), valeric acid (VA) or 1,4-pentanediol (PD).66An excellent
perfor-mance of 1% Pt@TiO2catalyst in the hydrogenation of LA was
noticed in the study of Lange and his group,67yielding >90%
conversion and >95% GVL selectivity for reaction at 473.2 K. A more recent study conducted by Ruppertet al.66also showed
high GVL selectivity (81.8–97.6 mol%, 343.2 K) for the hydro-genation of LA in water over anatase or anatase/rutile mixed-phase TiO2-supported platinum catalysts. Under our reaction
conditions, the resulting byproducts from Pt@TiO2-catalyzed
hydrogenation of LA were 2-MTHF and VA, both formed with 0.6 and 4.2% selectivity at the upper and lower temperature limits for 360 min reaction. ALs was untraceable in the reaction product mixture, suggesting that this species was rapidly transformed into GVL under H2 atmosphere and Pt@TiO2
catalyst. Due to the fact that GVL is the dominant product, it seems that the role of TiO2support in the reaction pathway is
limited to its interaction with platinum metal (adhesion and dispersion properties) and inuencing the hydrogenation active sites on its surface. In order to investigate the role of AAB as a heterogeneous acid co-catalyst, the catalytic performance between 1% Pt@TiO2and 1% Pt@TiO2combined with AAB
co-catalyst was compared in terms of conversion and GVL selec-tivity. When it comes to the selectivity, in the case of 1% Pt@TiO2 catalyst, the primary product was GVL with >90%
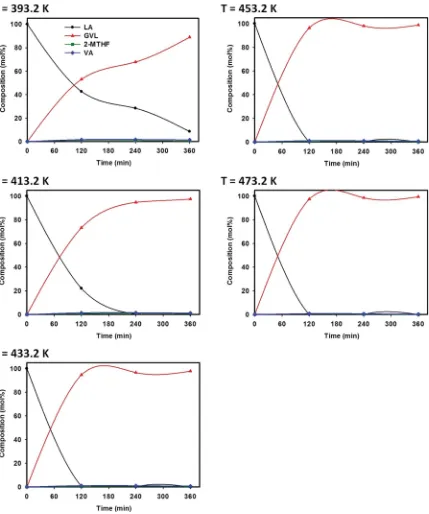
selectivity. Fig. 6 shows the compositions of reaction products obtained from catalytic hydrogenation of LA with 1% Pt@TiO2
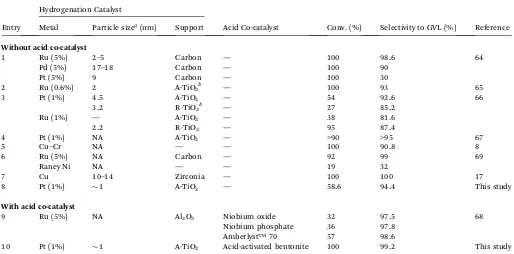
in combination with AAB co-catalyst. The results reveal that a similar product distribution consisting mainly of GVL (>92% selectivity) was obtained and only very few amounts of byprod-ucts such as 2-MTHF and VA were detected. Full conversion of LA could be achieved at 413.2 K aer 240 min reaction by utilizing combined catalyst system. Hence, AAB was demonstrated to be an effective acid co-catalyst, which contributed a remarkable positive effect on the catalytic performance. A similarnding has been reported by the group of Galletti et al.68for commercial
ruthenium supported catalysts in combination with different heterogeneous acid co-catalysts include Amberlyst resins and niobium phosphate or oxide. Further studies on the rational design and optimization of the acid co-catalyst dosage and reaction tests under industrial viable conditions are still being carried out by our research group (Table 6).
The catalyst stability and its possible reuse are both crucial issues with respect to economic and green chemistry consid-erations. Moreover, catalyst reuse considerably reduces both production costs and chemical waste, which is another critical issue of sustainability and environmental impact. The combined 1% Pt@TiO2and AAB co-catalyst was recovered from
the decanted reaction mixture and reusedve times. In detail procedure, a fresh charge of reactant was introduced into the reactor containing spent catalyst from therst reaction test and the subsequent catalytic run was continued. The recyclability results of the spent catalyst are shown in Fig. 7. It is clearly shown that there is a gradual decrease in the catalytic activity (conversion) and GVL selectivity aerve consecutive catalytic runs, reaching a value of 87.4% conversion and 86.3% selec-tivity. This indicates that deactivation of the catalyst occurs during the subsequent reaction cycles, presumably due to coke formation from the polymerization of ALs over acidic AAB co-catalyst surface. The coke formation renders the co-catalyst less active, due to a decrease in the number of active surface sites available for hydrogenation. We also examined the extent of Pt metal leaching by performing inductively coupled plasma-mass
Table 5 Effects of reaction time and temperature on the conversion and product yields in the catalytic hydrogenation of LA with 1% Pt@TiO2catalyst
spectrometry (ICP-MS) analysis in the liquid phase aer 240
min reaction. The loss of the metal phase to the liquid phase was found to be very limited under applied reaction conditions. Hence, lower catalytic activity (LA conversion) and selectivity to GVL in the consecutive catalytic hydrogenation cycles points at deactivation of the spent catalyst by coking. In this regard, the spent catalyst aer the h catalytic run was subjected to calcination at 723.2 K under a stream of pure oxygen for 180 min in order to remove as much carbon residue deposited on
the catalyst surface as possible. By performing calcination at this temperature, the phase transformation of TiO2support, for
example from anatase to rutile phase and the sintering or collapse of the 2 : 1 layer lattice structure of AAB clay do not occur and this appears to result in comparable catalytic performance of the calcined sample to that of fresh catalyst. The severe deformation of the layer lattice structures of clays and clay minerals was observed upon calcination at high tempera-tures (i.e., 973.2–1473.2 K).70
We also examined hydrogenation of furfural to furfuryl alcohol, an important industrial chemical intermediate and possible formation of reaction side-products such as tetrahy-drofurfuryl alcohol (THFA) and 2-methylfuran (2-MF) over 1% Pt@TiO2and 1% Pt@TiO2in combination with AAB co-catalyst.
The resultant 1% Pt@TiO2and combined 1% Pt@TiO2and AAB
co-catalyst both display good catalytic performance with actual yields of furfuryl alcohol of 33.3% (65.7% selectivity at 50.7% conversion) in the case of 1% Pt@TiO2 and 45.4% (68.4%
selectivity at 66.4% conversion) in the case of 1% Pt@TiO2with
AAB co-catalyst for 240 min reaction at 413.2 K. The favorable formation of furfuryl alcohol from hydrogenation of furfural in water has been recently reported by Li and his group49in the
presence of Pd@C and Amberlyst™70 dual catalysts. Details of the effects of reaction time and temperature on the conversion and selectivity toward furfuryl alcohol in the hydrogenation of furfural over 1% Pt@TiO2and 1% Pt@TiO2in combination with
AAB co-catalyst are not given because our study focused on the production of GVL as desirable end product.
Conclusions
We demonstrate herein a green approach for production of GVL from sugarcane bagasse involving arst step for hydrothermal conversion of biomass to LA and a second step for catalytic hydrogenation of LA to GVL; both steps worked in a green solvent such as water. The temperature variation experiments in the hydrothermal conversion step showed an upward trend of cellulose and hemicellulose conversion with reaction tempera-ture; however LA yields did not follow the same trend. A very low amount of LA was detected in the reaction product mixture from non-catalyzed hydrothermal reaction, which was attributed to incomplete, slow and non-selective conversion of cellulose in pure sub-CW medium. It has been demonstrated that the presence of heterogeneous solid acid catalyst having strong Bronsted and Lewis acidity such as acid-activated bentonite increases not only the hydrothermal degradation rates of cellulose and hemicellulose into monosaccharides, but also favors the formation of furan ring-opening products such as LA.
Table 6 Comparison of the performance of various heterogeneous solid catalysts with or without co-catalysts in the hydrogenation of LA to GVL
Entry
Hydrogenation Catalyst
Acid Co-catalyst Conv. (%) Selectivity to GVL (%) Reference Metal Particle sizea(nm) Support
Without acid co-catalyst
1 Ru (5%) 2–5 Carbon — 100 98.6 64
Pd (5%) 17–18 Carbon — 100 90
Pt (5%) 9 Carbon — 100 30
2 Ru (0.6%) 2 A-TiO2b — 100 93 65
3 Pt (1%) 4.5 A-TiO2 — 54 92.6 66
3.2 R-TiO2b — 27 85.2
Ru (1%) — A-TiO2 — 38 81.6
2.2 R-TiO2 — 95 87.4
4 Pt (1%) NA A-TiO2 — >90 >95 67
5 Cu–Cr NA — — 100 90.8 8
6 Ru (5%) NA Carbon — 92 99 69
Raney Ni NA — — 19 32
7 Cu 10–14 Zirconia — 100 100 17
8 Pt (1%) 1 A-TiO2 — 58.6 94.4 This study
With acid co-catalyst
9 Ru (5%) NA Al2O3 Niobium oxide 32 97.5 68
Niobium phosphate 36 97.8
Amberlyst™70 57 98.6
10 Pt (1%) 1 A-TiO2 Acid-activated bentonite 100 99.2 This study
aThe metal particle sizes dispersed on the support materials were determined by using TEM/HRTEM, H
2chemisorption or XRD techniques (NA¼
not available).bA-TiO
2: anatase TiO2and R-TiO2: rutile TiO2(Entry 3: the R-TiO2support for Pt was a mixed phase of 20% rutile and 80% anatase).
The TiO2-supported platinum metal (Pt@TiO2) in combination
with acid-activated bentonite as a co-catalyst was utilized in the catalytic hydrogenation of LA to GVL under moderate temper-atures. It was found that the presence of acid-activated bentonite co-catalyst could improve the reaction rate while maintaining high selectivity toward GVL, thus enabling the adoption of even milder conditions to perform the reaction. Recyclability study showed that the spent 1% Pt@TiO2
combined with AAB co-catalyst could retain its catalytic performance up to ve consecutive hydrogenation cycles. Catalyst poisoning was primarily caused by coke deposition on the active catalyst sites, presumably from the polymerization of ALs over solid AAB surface.
Acknowledgements
J. N. Putro would like to express her sincere appreciation to the department of chemical engineering, National Taiwan Univer-sity of Science and Technology (NTUST) for providing all the research facilities under the undergraduate internship program. The partial nancial support from the Directorate General of Higher Education (DIKTI) through Undergraduate Student Research Grant Programs is also gratefully acknowledged.
References
1 R. E. H. Sims, W. Mabee, J. N. Saddler and M. Taylor,
Bioresour. Technol., 2010,101, 1570–1580.
2 G. W. Huber, S. Iborra and A. Corma,Chem. Rev., 2006,106, 4044–4098.
3 S. Liu, L. P. Abrahamson and G. M. Scott,Biomass Bioenergy, 2012,39, 1–4.
4 H. Schwaiger, A. Tuerk, N. Pena, J. Sijm, A. Arrasto and C. Kettner,Biomass Bioenergy, 2012,38, 102–108.
5 J. Wang, J. Xi and Y. Wang,Green Chem., 2015,17, 737–751. 6 S. W. Fitzpatrick, Production of levulinic acid from carbohydrate-containing materials, US Pat., 5608105, Bione Incorporated, March 04 1997.
7 S. S. Toor, L. Rosendahl and A. Rudolf, Energy, 2011, 36,
12 M. Selva, M. Gottardo and A. Perosa,ACS Sustainable Chem. Eng., 2013,1, 180–189.
13 S. G. Wettstein, J. Q. Bond, D. M. Alonso, H. N. Pham, A. K. Datye and J. A. Dumesic, Appl. Catal., B, 2012,117–
118, 321–329.
14 O. A. Abdelrahman, A. Heyden and J. Q. Bond,ACS Catal., 2014,4, 1171–1181.
15 K. Yan and A. Chen,Fuel, 2014,115, 101–108.
16 W. R. H. Wright and R. Palkovits, ChemSusChem, 2012,5, 1657–1667.
17 A. M. Hengne and C. V. Rode,Green Chem., 2012,14, 1064–
1072.
18 X. L. Du, Q. Y. Bi, Y. M. Liu, Y. Cao and K. N. Fan,
ChemSusChem, 2011,4, 1838–1843.
19 F. M. A. Geilen, B. Engendahl, M. Holscher, J. Klankermayer and W. Leitner,J. Am. Chem. Soc., 2011,133, 14349–14358.
24 A. Stradi, M. Molnar, M. Ovari, G. Dibo, F. U. Richter and L. T. Mika,Green Chem., 2013,15, 1857–1862.
25 M. Chalid, H. J. Heeres and A. A. Broekhuis,J. Appl. Polym. Sci., 2012,123, 3556–3564.
26 L. Hu, G. Zhao, W. Hao, X. Tang, Y. Sun, L. Lin and S. Liu,
RSC Adv., 2012,2, 11184–11206.
27 G. Novodarszki, N. Retfalvi, G. Dibo, P. Mizsey, E. Csefalvay and L. T. Mika,RSC Adv., 2014,4, 2081–2088.
28 G. R. Akien, L. Qi and I. T. Horvath,Chem. Commun., 2012,
48, 5850–5852.
29 F. E. Soetaredjo, A. Ayucitra, S. Ismadji and A. L. Maukar,
Appl. Clay Sci., 2011,53, 341–346. 34 P. J. du Toit, S. P. Olivier and P. L. van Biljon,Biotechnol.
Bioeng., 1984,26, 1071–1078.
35 H. Yu, W. Du, J. Zhang, F. Ma, X. Zhang and W. Zhong,
Bioresour. Technol., 2010,101, 6728–6734.
36 S. Kim and M. T. Holtzapple,Bioresour. Technol., 2005,96, 1994–2006.
37 D. A. Salvi, G. M. Aita, D. Robert and V. Bazan,Appl. Biochem. Biotechnol., 2010,161, 67–74.
38 R. A. Silverstein, Y. Chen, R. R. Sharma-Shivappa, M. D. Boyette and J. Osborne,Bioresour. Technol., 2007,98, 3000–3011.
39 R. Gupta and Y. Y. Lee,Bioresour. Technol., 2010,101, 8185–
8191.
40 Z. Yu, H. Jameel, H. M. Chang and S. Park, Bioresour. Technol., 2011,102, 9083–9089.
41 Y. S. Cheng, Y. Zheng, C. W. Yu, T. M. Dooley, B. M. Jenkins and J. S. VanderGheynst, Appl. Biochem. Biotechnol., 2010,
162, 1768–1784.
42 C. Falco, N. Baccile and M. M. Titirici,Green Chem., 2011,13, 3273–3281.
43 D. Doulia, C. Leodopoulos, K. Gimouhopoulos and F. Rigas,
J. Colloid Interface Sci., 2009,340, 131–141.
45 M. Moonsiri, P. Rangsunvigit, S. Chavadej and E. Gulari,
Chem. Eng. J., 2004,97, 241–248.
46 Y. Yu, X. Lou and H. Wu,Energy Fuels, 2008,22, 46–60. 47 J. N. Chheda, Y. Roman-Leshkov and J. A. Dumesic,Green
Chem., 2007,9, 342–350.
48 B. F. M. Kuster,Starch-Starke, 1990,42, 314–321.
49 X. Hu, R. J. M. Westerhof, L. Wu, D. Dong and C. Z. Li,Green Chem., 2015,17, 219–224.
50 J. Jow, G. L. Rorrer, M. C. Hawley and D. T. A. Lamport,
Biomass, 1987,14, 185–194.
51 P. L. Dhepe and R. Sahu,Green Chem., 2010,12, 2153–2156. 52 C. Moreau, R. Durand, S. Razigade, J. Duhamet, P. Faugeras, P. Rivalier, P. Ros and G. Avignon,Appl. Catal., A, 1996,145, 211–224.
53 R. Weingarten, G. A. Tompsett, W. C. Conner Jr and G. W. Huber,J. Catal., 2011,279, 174–182.
54 E. Nikolla, Y. Roman-Leshkov, M. Moliner and M. E. Davis,
ACS Catal., 2011,1, 408–410.
55 J. Wang, J. Ren, X. Liu, J. Xi, Q. Xia, Y. Zu, G. Lu and Y. Wang,
Green Chem., 2012,14, 2506–2512.
56 A. J. Crisci, M. H. Tucker, M. Y. Lee, S. G. Jang, J. A. Dumesic and S. L. Scott,ACS Catal., 2011,1, 719–728.
57 M. Watanabe, Y. Aizawa, T. Iida, T. M. Aida, C. Levy, K. Sue and H. Inomata,Carbohydr. Res., 2005,340, 1925–1930. 58 S. S. Joshi, A. D. Zodge, K. V. Pandare and B. D. Kulkarni,Ind.
Eng. Chem. Res., 2014,53, 18796–18805.
59 F. Chambon, F. Rataboul, C. Pinel, A. Cabiac, E. Guillon and N. Essayem,Appl. Catal., B, 2011,105, 171–181.
60 B. Tyagi, C. D. Chudasama and R. V. Jasra,Spectrochim. Acta, Part A, 2006,64, 273–278.
61 D. S. Tong, X. Xia, X. P. Luo, L. M. Wu, C. X. Lin, W. H. Yu, C. H. Zhou and Z. K. Zhong,Appl. Clay Sci., 2013,74, 147–
153.
62 J. S. Kruger, V. Nikolakis and D. G. Vlachos, Curr. Opin. Chem. Eng., 2012,1, 312–320.
63 J. C. Serrano-Ruiz, R. M. West and J. A. Dumesic,Annu. Rev. Chem. Biomol. Eng., 2010,1, 79–100.
64 P. P. Upare, J. M. Lee, D. W. Hwang, S. B. Halligudi, Y. K. Hwang and J. S. Chang,J. Ind. Eng. Chem., 2011,17, 287–292.
65 A. Primo, P. Concepcion and A. Corma, Chem. Commun., 2011,47, 3613–3615.
66 A. M. Ruppert, J. Grams, M. Jedrzejczyk, J. Matras-Michalska, N. Keller, K. Ostojska and P. Sautet, ChemSusChem, 2015, DOI: 10.1002/cssc.201403332.
67 J. P. Lange, R. Price, P. M. Ayoub, J. Louis, L. Petrus, L. Clarke and H. Gosselink, Angew. Chem., Int. Ed., 2010,49, 4479–
4483.
68 A. M. R. Galletti, C. Antonetti, V. De Luise and M. Martinelli,
Green Chem., 2012,14, 688–694.
69 Z. P. Yan, L. Lin and S. Liu,Energy Fuels, 2009,23, 3853–
3858.