DAFTAR PUSTAKA
1. Cotton, F.Albert., Wilkinson,G., (1989), Kimia Anorganik Dasar, Penerbit Universitas Indonesia, Jakarta, 477-482
2. Mehtar,S., Wiid I., Todorov,S.D.,(2008),The Antimicrobial Activity of Copper and Copper Alloys Against Nonsomical Pathogens and Mycobacterium Tubercolosis Isolated from Helthcare Facilities in the Western Cap: an in vitro study, J. Hosp. Infect 68(1),45-51
3. Lee,W.,Li,S,E.,Lee,C.H.,Eds.,(2001), A chelating resin containing 1-(2-thioazolylazo)-2-naphtol as the functional group; synthesis and sorption behaviour for trace metal ions, Microchemical Journal, 70,195-203
4. Memon Q.S.,Bhanger,I.M.,Hasany,S.M.,Eds.,(2007).,The Efficacy of Nitrosonaphtol Functionalized XAD-16 Resin For The Preconcentration/ Sorption of Ni(II) and Cu(II) Ions,Elsevier Talanta,72,1738-1745
5. Burguera,J.L.,(1989), Flow Injection Atomic Spectrometry, Marcel Dekker,Inc, New York, 1-6
6. Cortina,N.M.,(1997), Kinetic Studies on Heavy Metal Ion Removal by Impregnated Resin Containing di-(2,4,4,-Trimethylpenyl) Phosphinic Acid, 167-183
7. Ensafi,Ali.A; Kayamian,Taghi,Karbasi,Eds.,(2003),On Line Preconcentration System for Lead (II) Determination in Wast Water by Atomic Absorption Spectrometry Using Active Carbon Loaded with Pyrogallol Red, Analytical Science, 19, 952-956
8. Dr.B.Saha,M.D.G.,and Mr.R.J.Gill Bailey,the Removal of Chromium (VI) Ion From Aqueous Solutions Using Solvent Impregnated Resin
11. Akerkar,V.G.,Karalkar,N.B.,Sharma,R.K.,Eds.,(1998),Synthesis and properties of new chelating resin with a spacer containing α-Nitroso-β-Naphtol as the functional group, Elsevier Science B.V., 46, 1461-1467
12. Fang,Z.L.,(1993),Flow Injection Separation and Preconcentration,VCH Publishers,Inc.,New York,10,169-215
13. Adamson,Arthur.W.,Alice P.,(1997), Physical Chemistry of Surfaces,6th edition,John wiley and Sons,New York
LAMPIRAN A
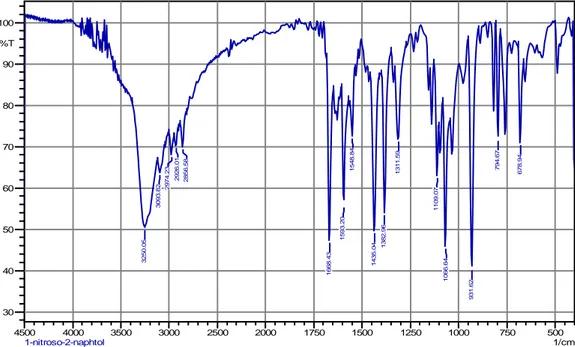
Hasil FTIR NITROSONAPHTOL
500 750 1000 1250 1500 1750 2000 2500 3000 3500 4000 4500 1/cm 30 40 50 60 70 80 90 100 %T 3250. 05 3093. 82 2974 .23 2 926. 01 2856. 58 1668. 43 1593. 20 1548. 84 1435. 04 1382 .96 1311. 59 110 9. 07 1066. 6 4 931. 62 794. 67 678. 94 1-nitroso-2-naphtol
Gambar A.1 Spektrum FTIR Nitrosonaphtol
ν
(cm
-1)
%T
794,67 71,998 931,62 40,702 1066,64 45,884 1109,07 62,983 1311,59 71,824 1382,96 54,055 1435,04 49,701 1548,84 72,503 1593,20 55,929 1668,43 47,406 2856,58 69,926 2926,01 70,173 2974,23 68,112 3093,82 63,667 3250,05 50,445LAMPIRAN B
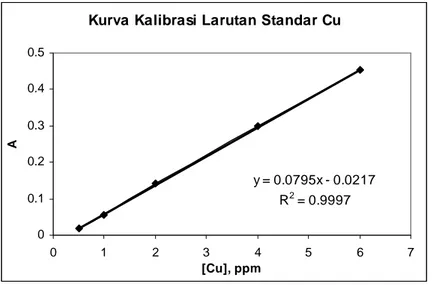
Pembuatan Kurva Kalibrasi Larutan Standar Cu
2+[Cu],ppm A1 A2 A3 A 0,5 0,0174 0,0163 0,0171 0,0170 1 0,0528 0,0552 0,0561 0,0547 2 0,1405 0,1417 0,1403 0,1409 4 0,2961 0,2993 0,3035 0,2996 6 0,4558 0,4523 0,4490 0,4524
Tabel B.1 Korelasi konsentrasi larutan standar cu terhadap absorban
Kurva Kalibrasi Larutan Standar Cu
y = 0.0795x - 0.0217 R2 = 0.9997 0 0.1 0.2 0.3 0.4 0.5 0 1 2 3 4 5 6 7 [Cu], ppm A
Gambar B.1 Kurva kalibrasi Larutan Standar
Persamaan garis
y
=
0
,
0795
x
−
0
,
0127
selanjutnya dipakai dalam perhitungan untuk
LAMPIRAN C
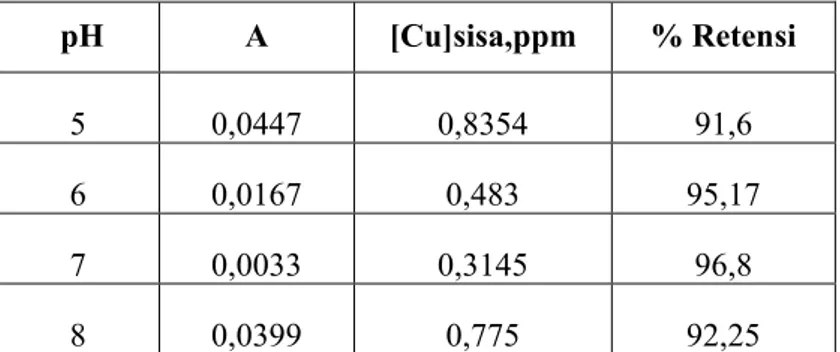
Penentuan pH optimum
pH A [Cu]sisa,ppm % Retensi 5 0,0447 0,8354 91,6 6 0,0167 0,483 95,17 7 0,0033 0,3145 96,8 8 0,0399 0,775 92,25Tabel C.1 Pengaruh pH terhadap retensi ion logam Cu2+
pH optimum terbentuknya kompleks dengan ion logam Cu2+t pH 7
0127
,
0
x
0795
,
0
y
=
−
awal sisa awal sisa[Cu]
]
Cu
[
[Cu]
Retensi
%
ppm
0,3145
[Cu]
3145
,
0
0217
,
0
07948
,
0
0033
,
0
−
=
=
=
−
=
x
x
96,8%
%
100
10
0,3145
-10
=
=
x
LAMPIRAN D
Pengaruh Waktu Kontak
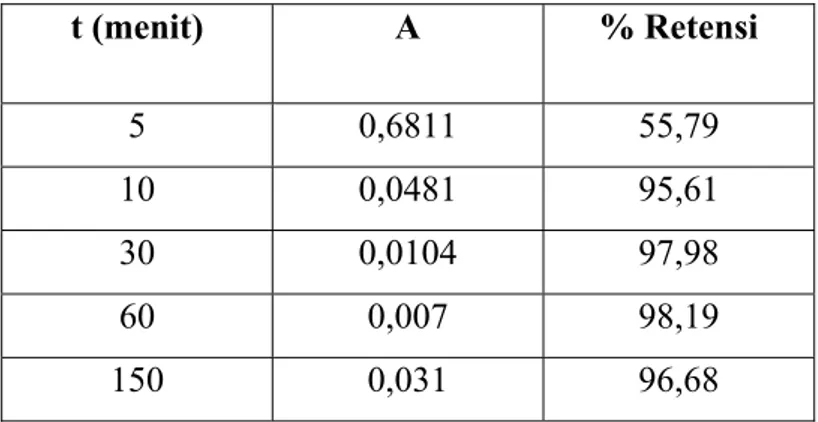
Tabel D.1 Pengaruh waktu kontak terhadap retensi ion Cu2+
t (menit)
A
% Retensi
5 0,6811
55,79
10 0,0481
95,61
30 0,0104
97,98
60 0,007
98,19
150 0,031 96,68
Dengan waktu kontak 60 menit memberikan absorbansi sebesar 0,007
awal sisa awal sisa
[Cu]
]
Cu
[
[Cu]
Retensi
%
ppm
0,361
[Cu]
361
,
0
0217
,
0
07948
,
0
007
,
0
−
=
=
=
−
=
x
x
%
98,19
%
100
10
0,361
-10
=
=
x
LAMPIRAN E
Penentuan Kapasitas Retensi
Tabel E.1 Pengaruh konsentrasi Cu2+ terhadap kapasitas retensi
[Cu],
ppm
[Cu]sisa,ppm
mg Cu teretensi
mg Cu teretensi/ g resin
2 0,3107 0,00338
0,337
4 0,5208 0,06958
0,6958
6 0,8025 0,1039
1,039
8 2,605 0,1078
1,078
0,0421
A
ppm
6
[Cu]
=
→
=
mg
0,12
L
0,02
L
mg
6
ppm
6
=
x
=
0217
,
0
07948
,
0
0421
,
0
=
x
−
8025
,
0
=
x
mg 0,0161 L 0,02 L mg 0,8025 ppm 0,8025 ppm 0,8025 [Cu]sisa = = = xmg
0,0161
-mg
0,12
terserap
yang
Cu
mg
2+=
=
0,1039
mg
resin g terserap yang Cu mg penyerapan Kapasitas 2+ =resin
g
/
Cu
mg
1,039
g
0,1
mg
0,1039
=
2+=
LAMPIRAN F
Perhitungan Presisi Pengukuran
F.1.
Pengaruh konsentrasi eluen
Tabel F.1 Tabel korelasi [HNO3] terhadap tinggi puncak
[eluen],M
Tinggi puncak (AU)
0,5 121,39
1 105,34
2 133,14
3 122,2
Pengaruh konsentrasi larutan asam nitrat
0 20 40 60 80 100 120 140 160 1 2 3 4 [asam ],M Ti ng gi p un c a k
F.2.
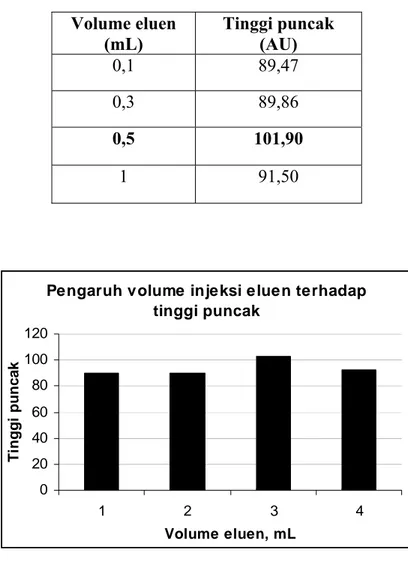
Pengaruh volume eluen
Tabel F.2 Kurva korelasi antara volume HNO3 terhadap tinggi puncak
Volume eluen
(mL)
Tinggi puncak
(AU)
0,1 89,47
0,3 89,86
0,5 101,90
1 91,50
Pengaruh volume injeksi eluen terhadap tinggi puncak 0 20 40 60 80 100 120 1 2 3 4 Volume eluen, mL Ti nggi punc a k
F.3. Kebolehulangan
Tabel F.3 Kebolehulangan pengukuran
Puncak Xi Xi-
![Tabel E.1 Pengaruh konsentrasi Cu 2+ terhadap kapasitas retensi [Cu],](https://thumb-ap.123doks.com/thumbv2/123dok/2581493.2236879/8.892.193.771.283.454/tabel-e-pengaruh-konsentrasi-cu-kapasitas-retensi-cu.webp)
![Tabel F.1 Tabel korelasi [HNO 3 ] terhadap tinggi puncak [eluen],M Tinggi puncak (AU)](https://thumb-ap.123doks.com/thumbv2/123dok/2581493.2236879/9.892.296.657.309.812/tabel-tabel-korelasi-terhadap-tinggi-puncak-tinggi-puncak.webp)