Application of Theory of Constraint Supply
Chain Replenishment System in Fast Moving
Consumer Goods Company
Margaretha1, Dyah Budiastuti 2, Taufik Roni Sahroni3
1,3
Master in Industrial Engineering
Binus Graduate Programs, Bina Nusantara University Jl KH Syahdan 9, Jakarta 11480, Indonesia
2
Doctor of Research in Management Binus Graduate Programs, Bina Nusantara University
Jl KH Syahdan 9, Jakarta 11480, Indonesia 1
[email protected]; [email protected] ; 3[email protected]
Abstract— Today’s market competitiveness has reached its peak since the rapid growth of industrial and technology development. The market dominance aims to fulfill the consumer supply and demand, by giving excellent service, such as stabilizing the finished goods inventory level in the right time and quantity. This study was conducted in one of the Fast Moving Consumer Goods (FMCG) Company in Indonesia which has several problems in supplying their product to market. Actual market condition and demand become the main factor why the company is unable fulfilling the right product to its consumer, despite the Production Planning and Inventory Control (PPIC) segment has made the right production target based on the Purchase Order and Selling Target from Distributors Company. Thus, further development by combining supply chain management system with several theory of constraints is required to manage the material inventory and finished goods, which meet the consumer needs such as integrated master production schedule, market demand condition, finished goods inventory, and material replenishment by suppliers.
Keywords— Supply chain management, Theory of
Constraint, Forecasting, Inventory, Fast Moving
Consumer Goods (FCMG)
1.
Introduction
Today, the technology and resources growths rapidly, the competition to grab the market domination becomes more intense, especially to win the customer interest. Every manufactures company required to have more value added for their products in order to compete with others. A
lot of strategies are launched to increase the service level satisfactory, yet the most important one is to manage the availability of product item in the market at the right time yet and in the right quantity. This study represents one of the Fast Moving Consumer Goods (FMCG) Company in Indonesia, which produce short shelf life or highly perishable goods and typically sold in large quantities.
Those products have short shelf life and also short inventory life-cycle, thus moving fast since from production phase into customer’s hand. Thus, both raw-material and finished goods inventory optimization become major role in providing market demand in the right time and quantity.
The company produces brand X-products who become as one of the market leader in oral care products in Indonesia. However, Company still have several problems in providing sufficient amount of product in the market, which could eventually change their national market leader position unless the situation is managed. This situation is basically related to the production planning that considers market demand, proper distribution to specific area, and also the availability of raw-material from suppliers. The key to stabilizing these specific situations, are by maintaining the principal of Supply Chain Management properly conducted within the company’s system.
The company consists in three major parts: plant, logistic distribution centre (warehouse), and retailers. The plant is responsible for raw materials ______________________________________________________________
International Journal of Supply Chain Management
IJSCM, ISSN: 2050-7399 (Online), 2051-3771 (Print)
purchase and production, and finished goods are to be stored in logistic distribution centre (LDC) and then they are delivered to retailers.
Figure 1. The Network Graph of Supply Chain of company
In optimizing the supply chain, the first thing to note is that consumers can buy the products they want, and protect consumers can not buy a product because the stock is not available. However, not middle of the competitive market, product demand cycle can not be understood easily, and companies need to avoid a large inventory for causing loss and damage to the product. Figure 2 shows two difficulties and conflicts of supply chain management and inventory management.
Figure 2. The Conflict Graph of SCM [8]
Generally in the face of the conflict on the supply chain, it is an ability to enhance the response capability of supply chain via a technology aiming at strengthening the market forecast and speed of information feedback, for example, to push the original plant prediction forward into the management mode of retailer/sale point, and then change it into the retailer prediction, and again to move to the management mode of plant cargo through rapid information response [8].
Therefore, the TOC has proposed the following solutions accordingly [8] :
1. The inventory should be placed within the source of supply chain (namely the plant). Therefore do not deliver the products to the downstream companies right away by the time they are finished; and distribution warehouses should not deliver the products to the downstream companies as soon as products from upstream companies arrived.
2. Each sale point only needs to store enough inventory needed for such replenishment period. For example, if it takes three days for replenishment and according to the previous sales record, the maximum demand for replenishing how much it has sold.
4. To monitor the sudden abnormal condition via the Buffer Management (BM) mechanism in Production Planning and Inventory Control (PPIC) section creates the production schedule based on the Purchase Order (PO) and Distributor Sales Target, by checking their beginning inventory level. However, the inventory replenishment do not cover each specific Distribution Centre (DC) areas in Indonesia, since the company are currently not integrating their inventory level from bottom level. This condition could eventually lead to unneeded production of finished goods which results in unequal distribution pattern, such as abundant amount of goods and/or even shortage of products in specific areas.
company will be able to get the insigh demand precisely along with their re replenish the appropriate products in the
2.
Literature Review
Supply Chain Management is a strateg operations management because it enco many related functions. Who buys t from the supplier, how to transport services, and how to distribute these services in a timely and most cost effect lot of organizational strategic planning.
The purpose of the Supply Chain is to right amount of the right products acco right place and at the right time with the and operating costs to a minimum. [9] Supply Chain performs well if [9]: 1. Products are available when custom
buy (high availability)
2. Stock sold to customers immediate by the sales department (high inven
Supply Chain Management was formed the flow of information, products a across the network of consumers, ente supply chain partners. [9] The detai chain process is depicted in Figure 3.
Figure 3. Supply Chain Process
Some of the common problems encou number of organizations in the su among others:
1. Too many sales are lost
2. Too many products are not availabl 3. Too many products in stock that do 4. High amount of working capital tie
stock too long
5. The slow response time to changes consumer end demand events. Forecasting demand is forec products or services of a company. is also referred to as a sales forecast production, capacity and scheduli becomes an input for financial plan and human resources [4].
Planning is a fundamental activity o Forecasting forms the basis of p planning for sales and marketing, planning or manpower planning, extremely important [1]. There are forecasting methods that is [2]:
1. Causal Models are foreca develops a model of causatio demands predicted by other va considered influential. Let Y phenomenon to forecast and X variables that to be related to Y model is one in which the fo some function of these variables Y = f (X1, X2, .., Xn) [2]
2. Time Series Method is ofte methods, as they require no in than the past values of the predicted. In time series anal isolate the patterns that arise mo include the following [2]: 1. Trend. Trend refers to the tend
series to exhibit a stable patter decline.
2. Seasonality. A seasonal patte repeats at fixed intervals. 3. Cycles. Cyclic variation i
seasonality, except that the l magnitude of the cycle may var 4. Randomness. A pure random s
which there is no recognizable data.
Figure 4 Time Series Pat
The procedure for identifying seasonal adjustment can be com
seasonality adjusted forecast. The Deseasonalized trend equation is:
Y’ = a + bt
b = ∑∑ (∑ ) (∑ ) (∑ )
a = ∑ – b ∑
Where:
Y’ is the estimated trend for product sales for period t.
a is the intercept of the trend line at time 0
b is the slope of the trend line
Winter’s method is a type of triple exponential smoothing, and this has the important advantage of being easy to update as new data become available.
This assumes a model of the form:
Dt = (µ +Gt) ct + ɛt,
Where:
Dtis the estimated trend for product sales for period t.
µ is base signal or intercept at time 0
G is trend or slope component
c is multiplicative seasonal component
ɛ is error term Assumptions:
• The season is exactly N periods
• Seasonal factors are the same each period and ∑ =
Three exponential smoothing equations are used each period to update estimate of:
• Deseasonalized series • Seasonal factors • Trend
The equations may have different smoothing constant, which we will label α, β, and
1. The series. The current level of the deseasonalized series, St, is given by
St = α (Dt / ct-N) + (1-α) (St-1 + Gt-1)
2. The Trend
Gt = β [St – St-1] + (1-β)Gt-1
3. The Seasonal factors
Ct = (Dt/St) +(1- ) ct-N
And, Forecast made in period t for any future period t +
Ft,t+ = St – Gt) ct + -N
A seasonal series is one that has a pattern that repeats every N period for some value of N.
This is a simple method of computing seasonal factors for a time series with seasonal variation and no trend. The method is a follows:
1. Compute the sample mean of all the data 2. Divide each observation by the sample
mean. This gives seasonal factors for each period of observed data.
3. Average the factors for like periods within each season. That is, average all the factors corresponding to the first period of a season, and so on. The resulting averages are the N seasonal factors.
Define the forecast error in period t, et, as the difference between the forecast value for that period and the actual demand for that period. [2]
et = Ft - Dt [2]
Let e1, e2, …, en be the forecast errors observed over n periods. Two common measures of forecast accuracy during these n periods are the mean absolute deviation (MAD) and the mean squared error (MSE), given by the following formulas:
Although, the MAD and the MSE are the two most common measures of forecast accuracy, other measures are used as well. One that is not dependent on the magnitude of the values of demand is known as the mean absolute percentage error (MAPE) and is given by the formula:
Availability of product/ goods is one of the measurements in inventory system, since users could not asses certain service level if the product is out of stock. Thus, it becomes one of the primary indicators to indicate the quality of service level. [7].
Master Production Schedule (MPS) is essential in maintaining customer service levels (CSL) and stabilizing production planning in a Material Requirements Planning (MRP) [10]. The MPS specifies the timing and size of production quantities for each product. [11]. However, there is a gap of research in implementing theory of constraint for fast moving consumer goods companies in Indonesia. Therefore, this research proposes the implementation of theory of constrain supply chain replenishment system in fast moving consumer goods companies.
3.
MethodologyThe main method for this research is utilizing Theory of Constraint (TOC), that focused into certain elements which is measured to increase the output number; especially by maximizing productivity and minimizes cost such as, holding cost and capital. This research begin by conducting deep forecasting analysis for six months forward, in order to get the insight of upcoming sales plan and calculating the required resources such as man power, and material.
Then the daily production plan could be integrated between Master Production Schedule, Finished Goods Inventory and Market Demand. This integrated MPS could determine the exact number of required production output until the required material amount from suppliers. The company can decide to give the access of information to supplier, so the required material and stock on hand are well-known by the supplier. The simulation of this research is using Microsoft Excel, in order to provide a user-friendly interface and comprehension.
Data collection process is gathered department of production, planning and inventory control at the Company directly, and also by conducting observation or interview for several indirect resources; those include customer order, lead time, and production capacity.
4. Results and Discussion
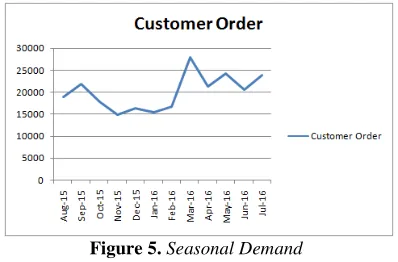
The period of sales data plotting is gathered from August 2015 until July 2016. This reflects on seasonal pattern that occur repetitive every six periods.
Figure 5.Seasonal Demand
There are three different methods to compare in order to find the best seasonal forecasting results: a. Time Series Decomposition (TSD)
b. Winter’s Method c. Stationary Series
The forecast uses six months forward from August 2016 until January 2017, then determining the error margin. Calculating the percentage of error margin will improve the forecasting results based on MAPE (Mean Absolute Percentage Error). The results show each comparison among three calculated methods as shown in Table 1.
Table 1. Comparison of MAPE Calculation (%)
TSD Winter Stationary
8.99 1.56 17.53
Based on the calculated results above, the winter’s Method shows the smallest percentage of error among the other. Thus winter’s method is chosen to calculate the forecast results from period of August 2016 – January 2017 in Table 2.
Table 2 Forecast Data (A)
No. Period Forecast
1 Aug-16 19,150
2 Sep-16 31,773
3 Oct-16 24,112
4 Nov-16 27,386
5 Dec-16 23,230
Since XYZ Company is categorized as Fast Moving Consumer Goods (FMCG) Company, safety stock level is determined by “level of service” calculation:
Variance = ∑ ( )
σ = √
Safety stock = D + (σ x K)
Where:
σ : Standard Deviation
D : Customer Order
K : k-value obtained by normal distribution z-table, which shows service level value (99%)
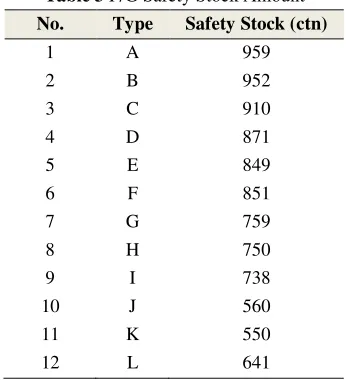
Table 3 list the calculation of safety stock in each product items.
Table 3 F/G Safety Stock Amount
No. Type Safety Stock (ctn)
1 A 959
2 B 952
3 C 910
4 D 871
5 E 849
6 F 851
7 G 759
8 H 750
9 I 738
10 J 560
11 K 550
12 L 641
Total product that could be stacked vertically in one pallet is a hundred and twenty cardboards. Table 4 shows the pallet dimension of finished goods.
Table 4. Product in Pallet Dimension
Pallet Dimension Pallet Size (m2) Length Width Height
110 90 10 99
By considering the capacity of storage and warehouse space below:
• Warehouse Space = P x L
= 49m x 46m = 2.250 m2
• Storage capacity
= 1353 pallet x 120 cardboard
= 162.360 cardboard
The number of cardboards capable to be stored is obtained to calculate the remaining costs, which consist of:
1. Storage Cost
= (Warehouse rent for a year/ required space) x Product in pallet dimension
= (IDR350.000.000/year / 2.250 m2) x 99 m2
= IDR15.400.000/year/pallet
= IDR 128.333/year/cardboard
2. Product Insurance
= Insurance Fee/year x Product Price
= 2% x IDR 80.000
= IDR 1.600 / year
3. Warehouse Maintenance
= (Manpower Salary/month x 12 months) + Handling Cost
= (IDR 3.500.000 x 12) + (2 x IDR 1.200.000)
= IDR 44.400.000 / year
4. Product Handling Cost
= (Warehouse handling cost/year / warehouse space) x Product space dimension
= (IDR 44.400.000 / 2.250) x 3 m2
= IDR 59.200 / year
5. Water & Electricity
= (Average water & electricity cost/month x 12 months / warehouse space) x Product space dimension
= IDR 32.000/ year
6. Tax
= Tax Fee / Warehouse space x Product Dimension
= IDR 6.500.000 / 2.250 x 3 m2
= IDR 8.600 / year
Total Holding Cost
= IDR 128.333 + IDR 1.600 + IDR 59.200 + IDR 32.000 + IDR 8.666
= IDR 229.799 /year/pallet
= IDR 19.149/year/cardboard
= IDR 638/day/cardboard
Theory of constraint performs important role in Supply Chain Replenishment concept, however there is a situation in the Company where PPIC team does not have a clear guidance about the sequence of item to be produced. Thus, several products which are manufactured were unfortunately not suitable with market demand, or even out of stock from the list.
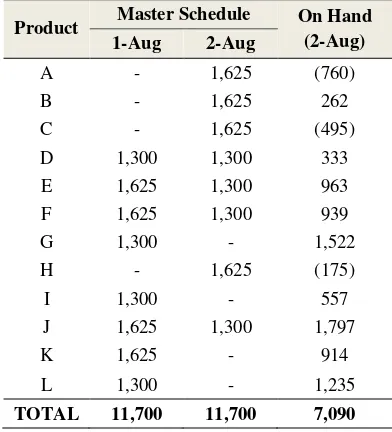
Table 5 lists of production schedule, including the complete production item in XYZ Company for period of 1st – 2nd August 2016.
Table 5 Schedule and On Hand Inventory Pre Implementation (August 2016)
Product Master Schedule On Hand (2-Aug) 1-Aug 2-Aug
A - 1,625 (760)
B - 1,625 262
C - 1,625 (495)
D 1,300 1,300 333
E 1,625 1,300 963
F 1,625 1,300 939
G 1,300 - 1,522
H - 1,625 (175)
I 1,300 - 557
J 1,625 1,300 1,797
K 1,625 - 914
L 1,300 - 1,235
TOTAL 11,700 11,700 7,090
This paragraph refers to results of MPS calculation along six periods onwards. The results will be informed to supplier in order to prepare for their capacity of production, material, man power, etc. Afterwards, the calculation of master production schedule could utilize Theory of Constraint Replenishment System. By integrating Master Production Schedule and Theory of Constraint Supply Chain Replenishment System could eventually overcome the unfilled production, as well as avoiding profit loss, by implementing it as guidance for PPIC segment to determine the production requirement and schedule. This MPS System will integrate each stock in Logistic Distribution Center, where the product stock will be updated align with the number of inbound production results or outbound delivery quantity; the results could be found on Table 6.
Table 6
Date Stock Un-fulfillment Before After Before After
1 1,741 1,741 - -
2 7,443 7,090 1,430 -
Total 9,184 8,831 1,430 -
Holding Cost : Rp 638,-
Un-fulfilment Cost : Rp 25.000,-
Before:
Total Cost Before
= (9.184 x 638) + (1.430 x 25.000)
= 5,859,392 + 35,750,000
= 41,409,392
After:
Total Cost After
= (8.831 x 638) + (0 x 25.000)
= 5,634,178
5. Conclusion
eliminated by utilizing integrated Master Production Schedule (MPS) aligned with market demand and safety stock. The current condition using existing MPS in the company will hold an amount of IDR 41,409,392 million because of additional holding cost of IDR 638/ cardboard for inventory and also out of stock loss around IDR 25,000/ cardboard.
By using the Theory of Constraint Supply Chain Replenishment System concept eventually eliminate the out of stock loss, while reduce holding cost around to be IDR 5,634,178. As a result, by applying the theory of constraint has reduced the holding cost significantly. The contribution of this research is to introduce the theory of constraint could be implemented in Fast Moving Consumer Goods (FMCG) Company in Indonesia due to reducing the holding cost significantly.
References
[1] S.N. Cary, “Production & Operations Management”, Tata McGraw Hill, 4th Edition, 2009
[2] N. Steven, “Production and Operations Analysis”, McGraw Hill, 4th Edition, 2001 [3] Sipper, D., and Bulfin, R. L. Jr., “Production:
Planning, Control, amd Integration”, McGraw Hill, New York, 1997
[4] H. Jay, R. Barry., “Operations Management”, Pearson, 9th Edition, 2009
[5] Goldratt, E.M. (1990). What is this thing called the Theory of Constraints?. North River Press, Croton-on-Hudson, NY.
[6] S.T. Zeynep, G.S.Noyan, V. Ozalp (2014), “Theory of Constraints Literature Review”, International Journal Strategic Management Conference, Procedia.
[7] B. N. Senator, (2006), “Sistem Inventori”, ITB. [8] Wu. H.H., Chen, C.P., Tsai, C.H. and Tsai, T.P. (2010). "A Study of Theory of Constraints Supply Chain Replenishment System," International Journal of Academic Research in Accounting, Finance and Management Sciences, Vol.3, No. 3, pp. 82-92.
[9] R.S Russel, B.W. Taylor, Operations Management, Wiley, 2011
[10]Ou Tang, W. Robert. (2005). “Planning and replanning the master production schedule under demand uncertainty”, International Journal of Production Economics, Vol 78, Issue 3, p.p. 323-334.
[11]James A. Hill, William L., Berry and David A. (2003). “Revising The Master Production Schedule in Sequence Dependent Processes”,
APPENDIX 1
APPENDIX 2
Date : 1-Aug-2016
Date : 2-Aug-2016
![Figure 2. The Conflict Graph of SCM [8]](https://thumb-ap.123doks.com/thumbv2/123dok/1295440.2007924/2.612.97.289.100.217/figure-conflict-graph-scm.webp)
![Figure 3. Supply Chain Processess [9]](https://thumb-ap.123doks.com/thumbv2/123dok/1295440.2007924/3.612.96.290.416.552/figure-supply-chain-processess.webp)