Trading carbon
How it works and why it is controversial
Jutta Kill / Saskia Ozinga / Steven Pavett / Richard Wainwright
FERN would like to thank Duncan Brack, Marcello Calazans, Michelle Chan, Rodger O’Connell, Mark Gregory, Justin Kenrick, Larry Lohmann, Yann Louvel, Winnie Overbeek, Payal Parekh, Oscar Reyes, Leendert van der Waal and Harriet Williams for their valuable comments. None of the reviewers can be held accountable for any possible mistakes.
Authors: Jutta Kill, Saskia Ozinga, Steven Pavett and Richard Wainwright Editor: Ed Fenton
Editorial consultant: Kieran Cooke Illustrations: Christopher Mackenzie Designer: Daan van Beek
Printed: Macula, Boskoop, the Netherlands
Photo front page: NASA. Earth’s atmosphere and the setting sun photographed by a crew member on the International Space Station.
ISBN: 978-1-906607-10-4 August 2010
FERN works to achieve greater environmental and social justice, focusing on forests and forest peoples’ rights in the policies and practices of the European Union.
FERN office UK, 1C Fosseway Business Centre, Stratford Road, Moreton in Marsh, GL56 9NQ, UK
FERN office Brussels, Rue d’Edimbourg, 26, 1050 Bruxelles, Belgium
www.fern.org
This guide has been produced with financial support from the JMG Foundation, DG Environment of the European Commission and the CS Mott Foundation.
Contents
Acronyms 5
Introduction 7
Chapter 1 The origins of carbon trading 11
Case study 1 The US sulphur trading scheme 13
Chapter 2 Cap and trade 17
Box 1 Climate change and the cap 18
Chart 1 Value of spare permits held in 2008 by the ten most profiting
companies 22
Box 2 The difficulty of measuring greenhouse gases 24
Table 1 The Kyoto Protocol greenhouse gases 24
Box 3 Upstream versus downstream monitoring 29
Box 4 Permits and credits 31
Box 5 The economic theory behind cap and trade in pictures 32
Case study 2 The Kyoto Protocol 33
Case study 3 Carbon trading in practice – the EU Emissions Trading Scheme 37
The most frequently used arguments in favour of carbon cap and
trade schemes and FERN’s response 43
Chart 2 Carbon price 52
Chapter 3 Offsets 57
Chart 3 CDM projects in the pipeline in percentages per project category 66
Chart 4 Expected offset credits until 2012 in percentages per project category 66
Chart 5 All CDM projects in the pipeline in Brazil, Mexico, India and China
Box 6 Why many NGOs believe forest offset credits must remain excluded
from carbon trading schemes 69
Case study 4 Carbon offset projects 72
FERN’s responses to the most frequently used arguments in favour
of offsets 75
Box 7 Is investment involving technology transfer a defunct strategy? 82
Chapter 4 How the carbon market works 87
Chart 6 The carbon market in a flow chart 93
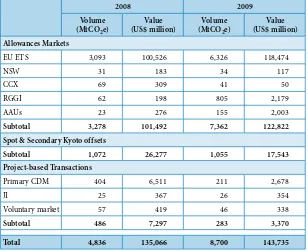
Table 2 The carbon market in figures in 2008 and 2009 96
Case study 5 Short selling and the EU ETS over-allocation 99
Box 8 How to measure the value of the carbon market 100
Chart 7 Value of OTC derivatives 101
Glossary 107
Annexes
Annex 1 Further reading and information 115
Acronyms
AAU Assigned Amount Unit
BERR Business Enterprise and Regulatory Reform CCE Chicago Climate Exchange
CDM Clean Development Mechanism CER certified emissions reduction
CITL Community Independent Transaction Log CMIA Carbon Markets and Investors Association
CO2e carbon dioxide equivalent DNA Designated National Authority DOE Designated Operational Entity
EBITDA Earnings Before Interest, Taxation, Depreciation and Amortisation ECX European Climate Exchange
EPA Environmental Protection Agency ERPA Emissions Reduction Purchase Agreement
ERU Emissions Reduction Unit ESD Effort Sharing Decision
ETS Emissions Trading Scheme EUA European Union Allowance
FoE Friends of the Earth FSA Financial Services Authority GFV gross fair value
GHG greenhouse gas GNV gross nominal value GWP global warming potential
HFC hydrofluorocarbon ICE Intercontinental Exchange
IETA International Emissions Trading Association IPCC Intergovernmental Panel on Climate Change
IPPC International Pollution Prevention and Control Directive ITL International Transfer Log
JI Joint Implementation
NGO non-governmental organisation
OECD Organisation for Economic Cooperation and Development OTC over the counter
PCF Prototype Carbon Fund PDD Project Design Document
RECLAIM Regional Clean Air Incentives Market
REDD Reducing Emissions from Deforestation and Forest Degradation RGGI Regional Greenhouse Gas Initiative
UNEP United Nations Environment Programme
UNFCCC United Nations Framework Convention on Climate Change VER verified emissions reduction
WCI Western Climate Initiative
Introduction
In the drive to tackle climate change, carbon trading has become the policy instrument of choice among governments. It is also a central element of the UNFCCC’s Kyoto Protocol. National or regional carbon trading schemes are now operational in Europe, the USA, New Zealand and elsewhere.
Yet carbon trading remains highly controversial. Some see it as a dangerous distraction and a false solution to the problem of climate change.
Unfortunately the subject is characterised by jargon, abstract concepts, mathematical formulae and technical detail, making it hard for most people to understand its implications and assess its merits or otherwise. This guide attempts to unravel some of this complexity.
To put it simply, carbon trading is the process of buying and selling of quotas that allow the holder of the quota to emit the equivalent of one tonne of CO2. So if a company’s or a country’s emissions are lower than its quota, it can sell its surplus. If it exceeds its limits, on the other hand, it will have to buy additional quota on the market or cut its production.
This report deals with each of the three basic components – cap and trade, carbon offsets and trading transactions – which underpin the trade in carbon quotas.
Chapter 1 explains how the concept of carbon trading came about.
Chapter 2 explains the theory of cap and trade – also sometimes referred to as emissions trading – and looks at how the Kyoto Protocol set in motion the widespread use of carbon trading schemes. It also examines the European Union’s Emissions Trading Scheme (ETS).
Chapter 4 describes the financial aspects of carbon trading. It explains how the carbon market changed as it matured, and how new interest groups and increasingly complex financial arrangements shape the carbon market today. There is a section explaining the key financial terms, and showing how their use has influenced the carbon market. The chapter also explores how complex financial instruments and new actors make prices more volatile, lead to greater speculation in the carbon market, and increasingly delink the development of the carbon market from its original objective of providing an effective cost-management tool for companies required to reduce greenhouse gas emissions.
The glossary explains the key concepts and terms in plain English. Although at FERN we have our own opinion on why carbon trading does nothing to avert climate change, we believe it is important for readers to make up their own minds. At the end of Chapters 2 and 3, therefore, we present some of the arguments used by proponents of carbon trading, followed by counter-arguments. The discussion points we have selected cannot be exhaustive, but we hope we have tackled the main areas. We welcome discussion on other arguments which readers feel should have been included. We hope the guide will be useful both to those who want to understand carbon trading purely as a mechanism, and to those who want to strengthen their arguments against.
Chapter 1
The origins of carbon trading
In the late 1960s an economist at the University of Chicago, Ronald Coase, began promoting the idea of ‘pollution trading’. Coase believed that pollution should be seen as part of the cost of production. He believed that if pollution was priced as part of the process of production, market forces would eventually deter businesses from polluting the environment because it would become less and less cost-effective for them to do so. ‘People don’t pollute because they like polluting,’ said Coase. ‘They do it because it’s a cheaper way of producing something else.’1
Other economists developed this theory. J.H. Dales of the University of Toronto, and Thomas Crocker of the University of Wisconsin, suggested that although prices and pollution levels should largely be controlled by the market, overall pollution limits would have to be set by governments. So pollution trading was seen as a way of making it as cost-effective as possible for businesses to comply with an emissions target set by the state.2
In 1976, the US Environmental Protection Agency (EPA) applied the concept of pollution trading to reduce the level of certain air pollutants. Companies were to be granted permission to build polluting factories in certain regions only if the company guaranteed to reduce pollution by a greater amount elsewhere.3 However, the scheme was not a success.
Pollution levels did not drop: they were just spread over a wider area.4
In 1990, with the passing of the US Clean Air Act Amendments, a
nationwide sulphur dioxide trading system was set up by the US government with the aim of combating the problem of acid rain. Under this system, emissions permits were given out free of charge to the major polluters. The US sulphur trading scheme is often held up as a model for the design
1 Coase RH (1988) The Firm, The Market and the Law. University of Chicago Press, p. 155
2 For additional information on the application of pollution trading schemes, see Lohmann L (2006) Carbon Trading: A Critical Conversation on Climate Change, Privatisation and Power. Development Dialogue 48.
www.thecornerhouse.org.uk/subject/climate
3 Reitze AW (2001) Air Pollution Control Law: Compliance and Enforcement. Environmental Law Institute, pp 79-80. 4 Ibid, p.83
of carbon trading programmes, though many believe that the schemes are not comparable.5 While sulphur emissions fell, they also fell – often faster
and more effectively – in other countries where conventional performance regulation was used.6
7
During the negotiations on the Kyoto Protocol under the UNFCCC, the USA – in addition to objecting to significant cuts in greenhouse gas emissions – insisted on the trading of carbon allocations being a key element of the international climate treaty. And while the USA never ratified the Kyoto Protocol, the
legacy of its negotiating position has made carbon trading the central pillar of international climate policy.
The idea of carbon trading caught on, not just in boardrooms, banks and the higher echelons of government, but also among NGOs. The message was that the market recognises no borders and is infinitely adaptable, able to respond quickly to changing circumstances.
Some pioneers of pollution trading, however, have expressed doubts that carbon trading can have a role reducing greenhouse gas emissions and tackling climate change. Thomas Crocker has declared himself ‘sceptical that cap and trade is the most effective way to go about regulating carbon’.8 Since
there are so many structurally different emissions sources, Crocker does not believe that the problem can be addressed under a single pollution trading scheme, and states that ‘it is not clear … how you would enforce a permit system internationally.’9
5 http://www.youtube.com/user/CarbonFees#play/all
6 The US is a signatory to the Convention on Long-Range Transboundary Air Pollution but never signed its protocol on Further Reduction of Sulphur Emissions (see http://www.unece.org/env/lrtap/fsulf_h1.htm). The protocol was signed in 1994, a year before utilities in the US were subjected to a cap on SO2 emissions. Annex II of the protocol shows the reduction commitments of the individual OECD countries.
7 Reflections on the Kyoto Protocol – looking back to see ahead. International Review of Environmental Strategies 5: 61-70 8 Reitze AW (2001) Air Pollution Control Law: Compliance and Enforcement. Environmental Law Institute
9 Ibid.
See Case study 1 for a comparison
‘It is not an exaggeration to brand the mechanisms of the Kyoto Protocol as “Made in the USA”. ’7
Case study 1
The US sulphur trading scheme
The US Environmental Protection Agency’s (EPA) Acid Rain Program was an initiative to reduce overall atmospheric levels of sulphur dioxide and nitrous oxides, which cause acid rain. It targeted coal-burning power plants, limiting their overall sulphur dioxide emissions and eventually allowing them to buy and sell emission permits.
The allowance system was created as part of the 1990 US Clean Air Act Amendments which set a decreasing cap on sulphur dioxide emissions for each of the following years, aiming to reduce overall emissions to 50 per cent of 1980 levels.
The programme is often hailed as a success, and is cited as a forerunner for carbon trading. People point to statistics which show that sulphur dioxide emissions have dropped by 40 per cent, reaching the programme’s long-term goal ahead of the 2010 statutory deadline; and the EPA estimates that by 2010, the overall cost of complying with the programme will amount to US$ 1-2 billion a year, just a quarter of what was originally predicted.
Yet while emissions decreased across the USA, they decreased more in US states and other countries that had not implemented the sulphur trading scheme. Countries like Germany, which used standard performance legislation to reduce the release of sulphur dioxide, cut emissions much faster than the USA. And in the USA, a large part of the emissions cuts had already occurred before the trading scheme was up and running.
Disagreement over its effectiveness aside, there are clear differences between the sulphur trading scheme and carbon trading:
• The sulphur trading scheme did not allow for offsetting. All carbon trading schemes allow for a considerable amount of emissions reductions to be achieved through the use of offsetting.
• Sulphur trading applied to only one relatively uniform industry, which consisted entirely of electricity producers using high-sulphur coal for energy production. By contrast, today’s carbon trading regimes group together very different industries in very different jurisdictions, and encompass six different greenhouse gases.
• The changes in technology required for sulphur removal were relatively minor compared to those required to tackle climate change. Industries
See Chapter 3
that took part in the sulphur dioxide trading scheme did not stop burning coal, they just switched to low-sulphur coal and emissions scrubbers.
• The sulphur trading scheme was introduced into the Clean Air legislation only once the technology was available to monitor sulphur dioxide emissions with smokestack monitors, and direct, real-time measuring of emissions became possible. CO2 and the other five greenhouse gases are released almost everywhere on the globe by literally thousands of different processes. Direct real time measuring of GHG emissions is either not available or not in use. Therefore these emissions are not measured but calculated using a variety of conversion factors and proxies.
Further information
– Two EPA lawyers explain the differences between the sulphur and carbon trading schemes:
http://www.youtube.com/watch?v=uSNQzSjb38g
– Driesen DM (2003) Markets are not magic. Environmental Forum. Nov/ Dec: 18-27.
– Ellerman D et al. (2003) Emissions Trading in the US: Experience, Lessons and Considerations for Greenhouse Gases. Pew Center on Global Climate Change.
– Driesen DM (1998) Is emissions trading an economic incentive program? Replacing the command and control/economic incentive dichotomy. Washington and Lee Law Review 55.
– US EPA data on the Acid Rain Programme: www.epa.gov/airmarkets/ progress/interactivemapping.html
Chapter 2
Cap and trade
This chapter describes cap and trade schemes. In carbon trading, however, cap and trade is intertwined with carbon offsetting. Offsets are a part of all existing carbon trading schemes. By examining both the theory behind cap and trade, and how cap and trade schemes have so far worked in reality, we highlight where the application in practice has deviated from the theoretical concept. The concluding section assesses the implications of this, and discusses some of the most common arguments in favour of cap and trade. The theory and realities of carbon offsets are described in Chapter 3.
The concept
In a cap and trade scheme, a government or intergovernmental body sets an overall legal limit on emissions (the cap) over a specific period of time, and grants a fixed number of permits to those releasing the emissions. The polluting entity must hold enough permits to cover the emissions it releases. If one polluter does not use all its permits, it can trade them with another entity that has already used up all its permits and needs more to continue emitting without exceeding the legal limit. In the case of carbon trading, the entities that are being capped at present are the large industrial producers of the six greenhouse gases: industrialised countries (in the case of the Kyoto Protocol) or companies (in the case of the EU’s or other regional emissions trading schemes). Each permit in a carbon trading scheme is considered equivalent to one tonne of carbon dioxide equivalent (CO2e). Such permits presuppose that the global warming potential of the other greenhouse gases can be calculated and converted to a multiple of the value that was assigned to carbon dioxide, which is one.
Key components
The cap
In any cap and trade scheme, it is the cap which determines the scheme’s level of ambition, while the trading component is intended to make See Box 2 for
compliance with the cap more cost-effective for the participating entities. In addition to the setting of the cap, the distribution of the permits and the monitoring of compliance all determine whether the ‘cap and trade’ scheme will achieve what it was developed for.
Box 1
Climate change and the cap
Carbon trading is currently the central pillar of international climate change policy. In such cap and trade schemes, it is the level of the cap which determines how many emissions are allowed. It also determines what contribution those countries whose emissions have been capped will make towards the UNFCCC’s stated aim of avoiding dangerous climate change and keeping global warming below 2ºC. The level of the cap within countries or regions determines how much the largest polluting industries contribute to achieving these national or regional emission targets.
The Intergovernmental Panel on Climate Change (IPCC) recommends that greenhouse gas concentrations in the atmosphere peak by 2015 and are then reduced by up to 85 per cent by 2050 to stabilise at 445-490 ppm CO2e. Even then, their estimation is that we will have a small chance of not overshooting 2º of warming.10 Many low-lying island states and countries most vulnerable to climate change are calling for a return as quickly as possible from the current 380 ppm CO2 (430 ppm CO2e) to a maximum concentration of 350 ppm CO2, to limit average temperature rises to 1-1.5ºC. Beyond these levels, climate change will pose a threat to their existence. It is clear that the caps pledged as of January 2010 by industrialised countries in the post-2012 UN climate treaty negotiations are insufficient to bring concentrations to anywhere near the 450ppm mark, let alone the lower levels called for.
Setting the level of the cap
The objective of the UNFCCC (confirmed at the UN climate conference in Copenhagen in December 2009) is to avoid dangerous climate change. While there is still some debate about what the maximum temperature rise can be if this objective is to be achieved, the UN climate conferences have agreed to limit the average global rise to a maximum of 2ºC.11 Current
10 IPPC; Climate change 2007; Synthesis report.
11 http://unfccc.int/resource/docs/2009/cop15/eng/11a01.pdf#page=3
projections suggest that global greenhouse gas emissions would have to peak by 2015 and then sharply decrease. Many analysts argue that to achieve such a drastic turnaround in emissions, governments need to focus on making structural changes to
energy production, power grids and transport systems. Many governments have, however, decided to use carbon trading as the key instrument to halt climate change, often claiming that trading itself will help reduce emissions. This disregards the fact that the reduction is set by the cap, while the trade is only a cost-management tool, which does not itself reduce emissions. Setting a global carbon
cap is complex. It involves governments assessing the costs and risks of not reducing emissions, and weighing these against the costs and risks of implementing the cap, in both the short and long term.
12
The straightforward theoretical approach to setting the cap would be to: 1. decide on the policy objective, e.g. keeping global warming below 2º C
(and capping greenhouse gas concentrations at a maximum of 450 parts per million CO2e) or keeping global warming below 1.5º C (capping them at a much lower level);
2. determine how much can still be emitted before concentrations pass that policy objective.
Yet this is not how greenhouse gas emissions caps were set. In the context of the Kyoto Protocol, the cap was set by industrialised countries collectively allocating themselves permits for 95 per cent of the emissions they had been releasing before any limits were in place. In other words, the setting of the cap was not connected to the policy objective, for which a much lower cap would have to have been set. Case study 3 explains how the cap was set in the case of the EU Emissions Trading Scheme (EU ETS).
Distribution of permits
Once a cap has been set, it must be decided who will be covered, and how to distribute the permits. This is one of the most contentious aspects of any
12 Carbon Market Europe 12 June 2009 www.pointcarbon.com
‘Given that carbon markets, unlike any other, are formed by regulation, the exact detail of the regulatory design will have a profound effect on the success or otherwise of the cap and trade mechanism.’12
programme that limits the release of a polluting substance. It is particularly so when the substance being limited is the key motor of economies, as is the case with fossil fuels, the main source of greenhouse gas emissions.
In cap and trade schemes, two main questions arise: who will be covered by the cap, and how to decide on the number of permits. Two further issues are
whether to provide all permits up front or in instalments, and at what price to issue them.
The decision of who will be covered has far-reaching implications which are not always immediately obvious. Should the scheme cover economic units, or should participants be chosen on the basis of their geographical location? Under the Kyoto Protocol, geographical location was chosen as the deciding factor: but now China and other exporting countries in the global South are arguing that a large proportion of their emissions comes from the manufacture of products that will be consumed in other countries covered by the Kyoto Protocol cap, and that emissions ought to be accounted for by the consumer rather than the producer.
On the question of how to decide how many permits to give, cap and trade theorists such as J.H. Dales based their concepts on the assumption that permits would be auctioned,13 in which case the question of how many
permits to allocate becomes less significant since each entity will bid for the amount of permits it requires at a price determined by the highest bid at auction (presumably with some limit on the maximum amount that could be bought by any one entity). However, all existing carbon cap and trade schemes – including the Kyoto Protocol, the EU ETS and also the US sulphur trading scheme – have initially distributed the permits free of charge. Permits have always been allocated according to the level of emissions in the past (a process referred to as ‘grandfathering’), along with much behind-the-scenes bargaining between the entity requiring the permits and the authority handing them out.14
Under the Kyoto Protocol, targets were developed mainly according to the feasibility criterion. Initial allocations for individual industrialised countries
13 Robert Stavins of Harvard University notes that ‘auction revenue may be used in ways that reduce the costs of the existing tax system or fund other socially beneficial policies. Free allocations to the private sector forego such opportunities’
(http://belfercenter.ksg.harvard.edu/analysis/stavins/?p=108). And economists Peter Cramton and Suzi Kerr (2002) point out that the ‘enormous rents at stake mean that interest groups will continue to seek changes in allocation over time’. (Tradeable carbon permit auctions: how and why to auction not grandfather. Energy Policy 30: 333-45.)
14 There is a substantial volume of academic literature on how ‘rent-seeking’ influences the design and implementation of cap and trade schemes. Rent-seeking is a process by which companies seek to extract ‘uncompensated value from others through manipulation of the economic environment rather than through trade and the production of added wealth’. http://en.wikipedia.org/wiki/Rent_seeking
See also page 34
See also page 11
were based on historic emissions levels in each country, resulting in some countries being granted significantly larger allowances than they required for covering their emissions at the time. This was especially true for Russia and Eastern Europe, where emissions dropped significantly due to the collapse of economic output. Kyoto Protocol allocations ranged from
8 per cent below what a country’s emissions had been in 1990, to allowing countries an increase of up to 10 per cent above 1990 emissions volumes. All permits were allocated to countries at the beginning of the Kyoto Protocol’s first commitment period, 1 January 2008, and countries will have to account for the use of their permits and balance their permit accounts by 31 December 2012. On the question of the price to be paid for each permit, industrialised countries handed them to themselves free of charge.
For the EU ETS, each Member State decided on the contribution that the high-emitting industry sectors in their country should make towards achieving their Kyoto Protocol targets, and the cap was determined accordingly. The proposed allocation was then submitted for approval to the European Commission in the form of national allocation plans (NAPs). The EU ETS is being phased in over a period of three stages. For Phases I (2005-07) and II (2008-12), the Member States themselves allocated the permits to the various entities covered by the EU ETS in their country; in Phase III this process is to be changed, with central allocation by the European Commission.
With regard to payment for the permits, ‘In Phase I and II of the ETS, allowances have largely cost companies nothing as most have been allocated for free’.15 This process of issuance through ‘grandfathering’ has been widely
criticised for allowing the same industries and countries that have been most to blame for increasing greenhouse gas concentrations in the atmosphere to obtain new assets in the form of carbon permits free of charge.16 17 In
the EU ETS, this free allocation resulted in huge windfall profits for some
15 What are the implications of the new EU Emissions Trading Scheme for European companies? Standard & Poor’s Credit Week, 23 Sept. 2009, p. 18.
16 For an analysis of the socio-political consequences of this form of free allocation of carbon permits, see Lohman L (2006) Carbon Trading. Critical Conversation about Climate Change, Power and Privatisation. pp 73-94.
17 For a discussion of how companies that are part of the EU ETS used their permits by selling them to raise cash that was not available, or available only at substantially higher interest rates, during the credit crunch, see Chapter 4.
See Case study 3
‘When a market is created through political action rather than emerging spontaneously from the needs of buyers and sellers, business will seek to influence market design for commercial advantage.’
of Europe’s largest emitters of greenhouse gases. It is estimated that the ten companies benefiting most from free permits will have gained € 3.2 billion in the period 2008-2012. Energy utilities increased electricity prices to cover the potential cost of permits, despite having received them largely for free, and cement and steel manufacturers sold their surplus permits.18
19
Monitoring and verifying compliance with a cap
Once a cap is set, and the available permits have been allocated, the regulatory body responsible for the cap and trade scheme must ensure that the cap is being complied with. This comes down to ensuring that entities with self-interest in continuing to pollute do not find ways to emit more greenhouse gases than they are allowed to, for example by underreporting their emissions.20
Chart 1 Value of spare permits held in 2008 by the ten most profiting companies (millions Euro)
18 Pearson, Anne (2010): The Carbon Rich List. The companies profiting from the EU Emissions Trading Scheme. Sandbag report February 2010.
19 Deutsche Bank Report Global Climate Change Policy Tracker: An Investor’s Assessment, October 2009
20 Drury RT et al. (1999) Pollution trading and environmental injustice: Los Angeles’ failed experiment in air quality policy. Duke Environmental Law and Policy Forum 45.
‘Free allocations of carbon credits tend to create market distortions. Therefore,
allowances should be auctioned to covered entities so that prices are determined on the basis of fundamental supply and demand.’19
Deutsche Bank
ArcelorMittal Lafarge
Corus SSAB - Svenskt Stal Cemex Salzgitter
HeidelbergCement CEZ U.S. Steel (USS) Slovenské elektrárne 202 59 47 45 38 28 25 23 22 19 25 0 50
Source: Pearson, Anne (2010), The Carbon Rich List
The importance of reliable monitoring of emissions has been demonstrated in two pollution trading programmes in the USA. The US sulphur trading scheme was only introduced into the US Clean Air Act once direct and reliable independent monitoring equipment was widely available.21 In
contrast, the RECLAIM programme in Los Angeles22 relied on emission
factors as a proxy for emissions rather than direct, real-time measurement, and the margin of error in reporting emissions was as much as 50-100 per cent, while refineries underreported their tanker emissions by a factor ranging from 10 to 1000.23
24
All existing carbon cap and trade schemes rely on ‘measuring’ by proxy, using conversion factors rather than direct measurement of
the actual emission. While the technology to remove real emissions may theoretically be available for some types of factories today, it is considered too expensive for widespread application across countries and sectors – and it is certainly not being used comprehensively for monitoring the emissions levels against which compliance with the Kyoto Protocol and related schemes will be assessed.
In addition, for the Kyoto Protocol (and from Phase III the EU ETS as well), a trading regime has been established in which six different greenhouse gases – each affecting the climate in different ways, to different degrees and for different time periods – are treated as if they were equivalent. Although scientists try to aggregate all the gases into one category of ‘carbon dioxide equivalent’, it is widely acknowledged that this is fraught with problems.
21 Cole D (2002) Pollution and Property: Comparing Ownership Institutions for Environmental Protection. Cambridge University Press.
22 For more detail on the Regional Clean Air Incentives Market (RECLAIM) in Los Angeles, see Lohman L (2006), Carbon trading, a critical conversation on climate change, privatisation and power, page 85.
23 Drury RT et al. (1999) Pollution trading and environmental injustice: Los Angeles’ failed experiment in air quality policy. Duke Environmental Law and Policy Forum 45.
24 http://blog.finetik.com/2009/05/08/a-new-growth-industry-carbonfraud//
See Box 2
Box 2
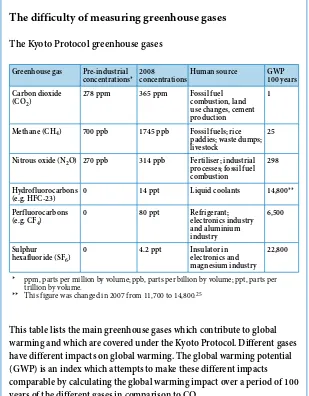
The difficulty of measuring greenhouse gases
[image:24.482.123.432.67.463.2]25
Table 1 The Kyoto Protocol greenhouse gases
Greenhouse gas Pre-industrial
concentrations* 2008 concentrations Human source GWP100 years Carbon dioxide
(CO2)
278 ppm 365 ppm Fossil fuel combustion, land use changes, cement production
1
Methane (CH4) 700 ppb 1745 ppb Fossil fuels; rice paddies; waste dumps; livestock
25
Nitrous oxide (N2O) 270 ppb 314 ppb Fertiliser; industrial processes; fossil fuel combustion
298
Hydrofluorocarbons
(e.g. HFC-23) 0 14 ppt Liquid coolants 14,800** Perfluorocarbons
(e.g. CF4)
0 80 ppt Refrigerant; electronics industry and aluminium industry
6,500
Sulphur hexafluoride (SF6)
0 4.2 ppt Insulator in electronics and magnesium industry
22,800
* ppm, parts per million by volume; ppb, parts per billion by volume; ppt, parts per trillion by volume.
** This figure was changed in 2007 from 11,700 to 14,800.25
This table lists the main greenhouse gases which contribute to global warming and which are covered under the Kyoto Protocol. Different gases have different impacts on global warming. The global warming potential (GWP) is an index which attempts to make these different impacts comparable by calculating the global warming impact over a period of 100 years of the different gases in comparison to CO2.
The six different greenhouse gases each affect the climate in different ways, to different degrees and for different time periods. Yet for the purposes of the accounting system, they have to be treated as if they were equivalent. The Kyoto Protocol, as well as the emissions trading schemes that were triggered by the protocol, assume that it is possible to calculate equivalences between the different gases that are capped.
Scientists have tried to aggregate all the gases into one category of ‘carbon dioxide equivalent’, but it is widely acknowledged that this is fraught with difficulties. The corrections made to the conversion values for HFC-23 highlight the range of error involved in these equivalency calculations. Originally scientists set the carbon dioxide equivalence figure for the greenhouse gas HFC-23 at 11,700, meaning that one tonne of HFC-23 is 11,700 times more damaging to the climate than carbon dioxide. In 2007 the GWP for HFC-23 was revised up to 14,800. The error band of this new estimate is still ± 5000, an indication of how uncertain these equivalence conversions are.26 The practical effects of this oversimplification are
considerable: HFC-23 destruction is the largest single offset credit-earner in the Kyoto Protocol’s CDM, accounting for 67 per cent of the offset credits generated in 2005 and 34 per cent of those generated in 2006.27
Revisions therefore significantly affect the calculated volumes of carbon offsets that a project can sell.
Determining equivalences for the six different GHGs introduces
significant margins of error, which are further exacerbated by inaccuracies in trying to measure emissions. According to one survey, these errors are in the range of ±10-30 per cent.28 Another survey puts uncertainties about
overall greenhouse gas emissions in selected industrialised countries at between 4 and 21 per cent.29 IPCC guidelines on how to calculate
and account for greenhouse gases suggest that uncertainties for carbon dioxide are up to 10 per cent for electricity generation, 10 per cent for industrial processes including cement and fertiliser production, and up to 60 per cent for land use change and forestry. For methane the margins of error are even higher, and for nitrous dioxide they are 50 per cent for industrial processes.30 Given the small reduction commitments in the first
commitment period of the Kyoto Protocol, the cumulative effect of these different sources of error – and uncertainty over the quantity of emissions released – means that the size of the reduction target falls inside the margin of error of the measuring of these different greenhouse gases.
26 MacKenzie D (2009) Making things the same: gases, emissions rights and the politics of carbon markets. Accounting, Organizations and Society 34: 440-55; see also Lohmann L (2009) Toward a different debate in environmental accounting. The cases of carbon and cost-benefit. Accounting, Organizations and Society 34: 499-534.
27 UN RISOE database and World Bank (2007) State and Trends of the Carbon Market 2007. Washington DC. 28 Michael Obersteiner et al. (2002) Quantifying a fully verifiable Kyoto. World Resource Review 14: 542.
29 Monni S (2004) Uncertainties in the Finnish Greenhouse Gas Emissions Inventory. Environmental Science and Policy 7: 87-98.
30 IPCC Guidelines for National Greenhouse Gas Inventories. Reporting Instructions.
Nilsson concluded that given the uncertainties (of GHG emission inventories) in place, most of the so-called Annex I countries of the Kyoto Protocol will not be able to verify their Kyoto target emissions at the country level. This is due to the fact that the reductions of emissions are small during the commitment period and the uncertainties of the net emissions are large.31
32
31 Michael Obersteiner, Matthias Jonas and Sten Nilsson, The Political and Economic Costs of a Fully Verifiable Kyoto Protocol. IIASA Interim Report IR-00-062
32 http://www.europol.europa.eu/index.asp?page=news&news=pr091209.htm
Carousel fraud. The EU ETS was the victim of carousel fraud in 2008 and 2009. This resulted in losses of approximately € 5 billion from the tax revenues of several Member States. It is estimated that in some countries, up to 90 per cent of the whole
market volume was caused by fraudulent activities.32
Monitoring of greenhouse gas emissions is further complicated by the fact that under both the Kyoto Protocol and the EU ETS, the covered entities themselves largely report their own emissions, though there is some independent verification.
Article 14 of the EU ETS Directive requires Member States to ensure that companies covered by the EU ETS scheme monitor and report their greenhouse gas emissions in accordance with guidelines published by the European Commission.33 Monitoring and reporting of an installation’s
emissions is carried out mainly through assessment of fuel purchases and use of emissions factors; continuous monitoring and third-party verification are allowed but rarely used. The guidelines mandate that all self-reported emissions must be verified by an independent third party.
Little is currently known about the effectiveness of these monitoring and verification procedures. Procedures for Kyoto Protocol target
verification will only be tested in full after the end of the first commitment period in 2012. In the case of the EU ETS, however, a report by the Dutch Court of Auditors suggests that staffing shortages and close cooperation between verifiers and auditors make the system less robust than is desirable.
‘By way of preparation for its supervisory activities, the [Dutch Emissions Authority] NEa developed a supervision strategy. We found that the NEa’s organisation of its supervision had departed from this strategy on several points. … In the first trading period (2005-07), for example, all companies had to be visited at least once and in-depth investigations had to be carried out at three-five per cent of the companies each year (i.e. about ten to fifteen companies each year). In-depth investigations had to be carried out at ten per cent of the complex companies every year. Our audit found that the NEa had planned fewer in-depth investigations for 2005 and 2006 than recommended in the supervision strategy. … In 2005 and 2006, the NEa initiated relatively few follow-up actions. In 2005 there had been a total of four, whereas it had carried out a total of 131 visits during that year. On average, three-quarters of the visits had led to agreements being made with the companies.’34
33 For the guidelines and details about monitoring and verification under the EU ETS, see the European Commission website http://ec.europa.eu/environment/climat/emission/mrg_en.htm
Registries
Registries or transaction logs are another part of the monitoring system. While the trading of permits and offset credits takes place directly between entities – over the counter (OTC) or on exchanges – their movement is tracked in these registries or transaction logs. For example, countries have accounts in the UNFCCC registry, and each entity covered by the ETS has an account in a national registry. These are administered at the national level by the Member States and at EU level through the Community Independent Transaction Log (CITL), which records the issuance, transfer, cancellation, retirement and banking of allowances that take place in the national registries. At the dates specified in the legislation, the entities must have enough permits or credits in their registry accounts to cover their emissions. In the case of the Kyoto Protocol, Annex I countries must have fulfilled their first commitment period obligations to reduce GHGs by 2012. Compliance of parties to the Kyoto Protocol with their emission targets will then be determined in 2014, once inventory data for the five-year commitment period 2008-12 has been assessed by the UNFCCC.
Consequences of non-compliance
How far companies or governments will go to comply with the cap depends partly on the severity of the penalties for non-compliance. Different carbon trading schemes have different incentives and penalties, including restrictions on trade, steeper reduction requirements for future commitment periods, and fines. Countries that miss their Kyoto Protocol target will be suspended from selling permits under the emissions trading provisions until the Compliance Committee reinstates their right to trade. There is much disagreement over the mechanism’s effectiveness, however: some see it as a unique contribution to environmental efforts internationally, while others argue that it offers little incentive for compliance.35 With the EU ETS,
meanwhile, the penalty for non-compliance is € 100 per tonne of CO2e, with permits currently priced at around € 15. But considering the financial turnover and size of some of the companies involved in the EU ETS, it seems unlikely that the penalties provide much of a deterrent.
35 Hovi J, Kallbekken S (2004) The Price of Non-Compliance with the Kyoto Protocol. The Remarkable Case of Norway. CICERO Working Paper 2004:07.
See Box 4 for the difference between permits and credits
Box 3
Upstream versus downstream monitoring
Almost all proposals in the international climate policy debate are based on the assumption that in order to tackle climate change, there must be an internationally agreed cap on greenhouse gas emissions.36 Therefore
questions about the setting of the cap, the distribution of allowances and monitoring will be important even where trading is not included (i.e. where there is just a cap, without the trade as a cost-management tool). Some of the problems with monitoring and verification might be avoided with an ‘upstream’ rather than a ‘downstream’ system of monitoring – i.e. measuring the amounts of fossil fuels coming out of the ground rather than the amounts being burned at all the many factories and other fossil-fuel emissions sources spread over a very wide area.37
The trade
The ‘trade’ component of any cap and trade scheme is a cost-management tool. It allows at least some of the entities affected by the cap to achieve their reduction commitment more cheaply. While it will not be possible for the trade component to make up for a cap set at an inappropriate level, the structure of the trading component is important to many participants for economic reasons. Those who advocate that trading is able to trigger structural low-carbon investment incentives point out that the structure of the trading component will determine investment incentives, and will thus influence the kind of energy infrastructure that companies and governments will invest in, as well as how soon the transition to low-carbon economies can take place. The main structural aspects that determine the costs and incentives provided by the ‘trade’ component are (1) how the pollution allowances are distributed, (2) whether the allowances have a use-by date, (3) whether extra allowances can be imported from outside the scheme without breaching the cap, and (4) who is allowed to trade.
The question of how allowances are distributed has already been covered. As to whether permits and offset credits linked to the Kyoto Protocol will be usable beyond 2012, this depends on the continuation of the Kyoto
36 Proposals to ‘cap-and-tax’ or ‘cap-and-dividend’ have been proposed in the USA as alternatives to the prevailing cap and trade model. For more detail see http://www.capanddividend.org and http://www.carbonfees.org/home/
Protocol after the end of its first commitment period in 2012. In the EU ETS, permits did have a use-by date (31 December 2007) during Phase I of the scheme. This meant that surplus permits lost their value on that date and, combined with the over-allocation of permits in the first phase, the price of these permits crashed once it became obvious that more permits had been issued than the entities needed to cover their emissions during Phase I. Permits and offset credits not used during Phase II of the EU ETS, however, can be carried over into Phase III (2013-20), irrespective of whether there is an international climate treaty beyond 2012. Some analysts expect that a large volume of allowances will be carried over into Phase III. Due to a combination of continued over-allocation at the start of Phase II and the economic downturn since 2008, companies may ‘bank’ up to 700 million Phase II surplus permits – equivalent to 14 times the reduction claimed by the EU in 2008. If entities also use their full allowance of offset credit purchases during Phase II, they may be able to carry over an additional 900 million offset credits. In all, this may add up to 40 per cent of the Phase III reduction effort achieved solely through the carry-over of surplus permits and credits from Phase II.38
All existing and planned carbon trading schemes allow for the purchase of extra allowances from outside the scheme. These extra allowances are currently in the form of offset credits. As regards who is allowed to trade, one key difference between permits issued under the Kyoto Protocol and those issued under other carbon trading schemes relates to who is allowed to trade. Under the emissions trading component of the Kyoto Protocol, only those countries that were allocated permits – and thus have compliance targets – are allowed to trade these permits among themselves.39 Carbon trading schemes such as the EU ETS, by contrast, allow trading with entities not covered by the cap, thus allowing brokerages, investment banks etc. to buy and sell permits. How this difference is affecting the evolution and price developments in the carbon market is discussed in Chapter 4.
Annex 2 provides a list of the different types of units – permits and offset credits – that can be traded in the different schemes. Each of these units is defined as equivalent to 1 tonne of carbon dioxide (CO2e).
38 Pearson A, Worthington B (2009) EU ETS S.O.S.: Why the Flagship ‘EU Emissions Trading Policy’ Needs Rescuing. Sandbag, London. p. 4.
39 The case is different with Kyoto Protocol offset credits, which can be traded by others too.
See Chapter 3 and Box 4
Box 4
Permits and credits
Permits are pollution units given to emitters under a cap and trade scheme. They are issued by a relevant authority, usually a governmental body. In the case of carbon permits, they are effectively a licence to emit a certain amount of greenhouse gases. The UNFCCC issues Assigned Amount Units (AAUs), and the EU issues European Union Allowances (EUAs). There is often confusion around the term ‘permit’; some people call them allowances, while others use ‘permit’ to describe both allowances and offset credits (see below). In this guide we make a distinction between permits and credits.
Credits are the units which describe claimed emission reductions generated by carbon offset projects. In the regulated carbon market they are issued by a relevant authority (such as the board of the Kyoto Protocol’s CDM). In the voluntary market they are issued by the offset companies themselves. Under the Kyoto Protocol’s CDM, credits are known as certified emissions reductions (CERs), in the voluntary offset market they are known as verified emissions reductions (VERs).
All existing regulated cap and trade schemes include trading of both permits and offset credits, and they currently command different prices. See Annex 2
Box 5
The economic theory behind cap and trade in pictures
Imagine two companies covered by an emissions cap, each emitting three units of a greenhouse gas.
A government regulation limits greenhouse gas emissions from six units to four, thereby setting an overall cap of four units. Each company is given two permits. Company A finds that it would cost € 5 to reduce its emissions by one unit but company B finds that the equivalent reduction would cost them € 11.
The total cost for both companies would therefore be € 5 + € 11 = € 16. If company A were to reduce its emissions by two units instead of just one, however, and company B does not reduce its emissions at all, the cost would only be € 5 + € 5 = € 10 for the same volume of reduction. By selling a permit to company B for € 10, company A recovers the expenses for making both the emissions reduction it would have had to make to comply with the regulation as well as the cost of the extra reduction made to trade with company B. By buying a permit from company A, company B saves € 1 compared to making its own reductions.
Thus the total cost of reduction under a cap without any trade would be € 16, whereas under a cap and trade scheme the total cost of compliance for the companies involved has been reduced to € 10. Both the trade and non-trade scenarios result in the same reduction of emissions, but the trade version is achieved at a lower short-term cost to the companies.
Case study 2
The Kyoto Protocol
40In the Kyoto Protocol, countries fall into two categories: those with an obligation to comply with an emissions target set under the protocol, and those without. Countries with a target are mainly the industrialised countries41 which have been responsible for the biggest increases in
greenhouse gas emissions into the atmosphere. They are also referred to as ‘Annex 1 countries’, because they are listed in Annex 1 to the Kyoto Protocol. For most industrialised countries the targets require reductions, though some countries (Spain, Iceland and Australia) can increase their emissions under the targets set. The Kyoto Protocol does not include targets for ‘developing’ countries, because of their smaller contribution to the increase in greenhouse gas emissions in the past. Each industrialised country listed in Annex 1 and that has signed the Kyoto Protocol has to report to the UNFCCC Secretariat on its progress towards compliance with the target annually, and at the end of the first commitment period of the Kyoto Protocol (31 December 2012) must submit accounts showing
40 Many books and guides have been written about the Kyoto Protocol. For more detail on how it was negotiated and how its different trading mechanisms work in detail, see the UNFCCC website www.unfccc.int. For a critical analysis of the Kyoto Protocol, see Lohmann L (2006) Carbon Trading. A Critical Conversation about Climate Change, Privatisation and Power, www.thecornerhouse.org.uk/subject/climate
that the country’s emissions are in balance with the permits and offset credits in its Kyoto Protocol account.
One of the possible policies and measures for achieving these targets – and the one that has received most attention – is the option for countries covered by the Kyoto Protocol cap to trade surplus allocations among themselves. Article 17 of the Kyoto Protocol defines the rules for this type of emissions trading. This option is complemented by a provision to further increase emissions beyond the cap, while claiming to stay within it, in the form of carbon offsets, generated mainly through the Clean Development Mechanism (CDM). This is looked at in more detail in Chapter 3.
To stay within the emissions limits negotiated under the Kyoto Protocol, many industrialised countries assigned emissions targets to large emitters within their countries, such as power plants and other energy-intensive industries. Non-trading policies and measures were put forward to encourage emissions reductions in other sectors. These measures are often a mixture of regulations to incentivise innovation, best available technology use and energy efficiency, together with financial incentives and regulations to establish carbon trading for high-emitting industries.
42
Notably, emissions from aviation and shipping were excluded from national Kyoto Protocol targets, because of disagreement over how these should be allocated. The allocation question highlights the importance of the decision on who is covered by the cap. If, as in the Kyoto Protocol, inclusion under the
cap is decided on a geographic basis, and a company with a limit moves production to a country without a target (e.g. China or Brazil) and then ships the goods back, it can still claim to have reduced its emissions. This process of moving emissions to an area where they are not accounted for is often referred to as ‘carbon leakage’. Because the Kyoto Protocol sets out
42 http://www.guardian.co.uk/environment/2009/oct/01/carbon-emissions-david-mackay
‘Our energy footprint has decreased over the last few decades and that’s largely because we’ve exported our industry.’ ‘The UK’s true energy footprint is twice as big as on paper.’42
43
to control production of greenhouse gases rather than the consumption of emission-intensive goods, there is no mechanism to prevent such leakage. China argues, for instance, that even though it is now the world’s largest emitter of greenhouse gases, a quarter of its emissions are the result of production for nations with targets under the Kyoto Protocol. The inclusion of carbon sinks in emissions
accounting under the Kyoto Protocol, in the form of carbon absorbed from the atmosphere and stored in trees and soils and other biomass, has also been controversial due to the lack of permanence of such storage and technicians’ ability (or inability) to measure such stocks accurately. There is further controversy over the choice of base year (1990), which for former USSR countries resulted in the allocation of permits far in excess of their actual emissions, which dropped dramatically after 1990 due to the rapid decline of their industrial activity.
In the Kyoto Protocol, permits allocated to industrialised countries with emissions targets are called Assigned Amount Units (AAUs). Trading of AAUs is allowed between countries that have been issued them under the Kyoto Protocol. Other entities cannot trade these AAUs,44 but
consultancies are often involved in brokering such AAU trading between countries. This is in contrast to the EU ETS and other regional emissions trading schemes in which brokers, investment banks and other financial actors can buy and sell permits even though they are not directly covered by the target. Trading of AAUs is an important yet controversial source of permits for countries which find it difficult to meet their reduction targets.
Other units can be traded under the Kyoto Protocol: CDM offset credits and Joint Implementation (JI) offset credits. In the CDM, these offset
43 Quoted by Fred Pearce in ‘Smokescreen exposed’, New Scientist, 26 Aug. 2000
44 An exception is New Zealand where entities covered in the domestic scheme receive AAUs from the government.
See Annex 2
See Chapter 4
‘The scientific uncertainties in measuring carbon movements into and out of ecosystems are just too great. … By opening up the whole of the biosphere to actions under the Kyoto Protocol, governments have made it completely unverifiable.’43
credits are generated in countries without a cap on emissions; in the JI mechanism, they are generated by offset projects within a capped country. CDM offsets thus allow countries with a Kyoto target to emit beyond their cap as long as they pay a project in an uncapped country to reduce ‘extra’ emissions. Chapter 3 discusses why it is not straightforward to establish what an ‘extra’ reduction is, how these offsets differ from permits, and why this matters for carbon trading schemes that treat both as if they were the same.
Other carbon trading schemes
While the USA never ratified the Kyoto Protocol – even though the agreement was heavily influenced by its insistence on the inclusion of carbon trading – various regional carbon trading schemes have recently been developed in the USA, including the Regional Greenhouse Gas Initiative (RGGI) in the north-eastern states, and the Western Climate Initiative (WCI), which links a number of western US states and Canadian provinces with a cap and trade scheme in California. Among the options discussed since 2009 for national US climate legislation are proposals for a cap and trade scheme. This would be much like the EU ETS but would allow even more carbon offsets and possibly only include utility companies. It would also have a ‘safety valve’ that would allow additional offset credits in the scheme if carbon permit prices rose above a predetermined price,45 effectively setting a ceiling on the price of
carbon. This is of concern to many because the price limit is significantly lower than what is widely seen as necessary for a transition to a low carbon economy.46 National carbon trading schemes are also in operation
or being discussed in Japan, Australia and New Zealand, in relation to their Kyoto Protocol targets. In Brazil and China, discussions about establishing national or regional carbon trading schemes similar to the EU ETS have also begun.
45 The exact carbon permit price which will trigger the ‘safety valve’ is yet to be determined along with many other details as the proposals are at early stages of the legislative process. The value discussed is around $ 20.
46 IPCC Working Group III, Chapter 3: Issues related to mitigation in the long-term context. p. 205.
See Annex 2 for a full list of tradeable units
Case study 3
Carbon trading in practice – the EU Emissions Trading
Scheme
47Under the Kyoto Protocol, the fifteen countries which were Member States of the EU when the protocol was agreed (EU-15) are committed to reducing their collective greenhouse gas emissions in the period 2008-12 to eight per cent below 1990 levels, the reference year of the Kyoto Protocol. This collective commitment has been translated into differentiated national emissions targets for each EU-15 Member State. In 2009, the EU committed to a reduction target of 20 per cent below 1990 levels by 2020. One of the main policies setting out how the EU intends to meet its 2020 target is the EU Emissions Trading Scheme ( EU ETS).48
The EU ETS was launched on 1 January 2005. It includes elements from carbon dioxide emissions trading schemes which originated in the UK and in Denmark and which merged into the EU-wide scheme in early 2005.49 The EU ETS sets targets for emissions from energy-intensive
industrial sectors such as the energy, cement, pulp and paper industries,50
and it consists of three phases.
Phase I ran from January 2005 till the end of 2007. During this period
the only controlled gas was CO2. The objective of Phase I was a tentative one-two per cent reduction, although there was considerable uncertainty about the level of emissions actually being released by the industries covered by the EU ETS. Each Member State was given control of the allocation of their permits after it had drawn up a national allocation plan (NAP), which had to show that the Member State was setting the overall EU ETS cap in line with its Kyoto Protocol reduction target. Permits were generally given to the participating emitters at no charge. The number of permits issued was based on previous emissions levels, ‘a practice called grandfathering’. It was believed that subsequent trading of permits would establish the correct price. Member States were allowed to sell a maximum of five per cent of permits by auction, but only Denmark chose to exercise this option to the full.
47 For more detail on the ETS, the sectors covered, the changes adopted between different phases etc., see among others ‘When the cap does not fit – cap and trade and the failure of the EU Emissions Trading Scheme.’ In: Gilbertson T., Reyes O. (2009) Carbon Trading – How it Works and Why it Fails. DHF Critical Currents 7, 31-51.
48 http://ec.europa.eu/environment/climat/emission/index_en.htm 49 Gilbertson and Reyes (2009) op. cit., p. 28 ff.
The problem with grandfathering was that domestic industries in each Member State lobbied their governments for the maximum allocations possible, which led to an over-allocation of permits: more permits were given out than the industries actually required. As a result, at the end of Phase I, total emissions from within the industry sectors covered by the EU ETS had increased by 1.9 per cent.51
Another effect of over-allocation was that when, in April 2006, it became clear that companies participating in the EU ETS had been granted significantly more permits than they needed to cover their 2005 emissions, the price of permits collapsed. With permits losing their validity at the end of Phase I (i.e. no carry-over or ‘banking’ was allowed between Phase I and II), their price in the carbon market dropped from a high of around € 30 to just € 1. Not all participants were equally successful at bargaining for a generous allocation or equally well equipped for trading; hospitals and universities did less well than energy companies whose core business is trading and which knew how to play this new asset market. As a consequence, by 2012 the estimated 230 million surplus EUA permits, worth up to € 3 billion at a price of € 13 per tonne,52 will have
resulted in significant financial gains for some of the largest polluters. For example, power generators that had successfully overestimated their permit requirements received record windfall profits because they passed on hypothetical costs for permit purchases to their customers.
Phase II coincides exactly with the first commitment period of the Kyoto
Protocol (January 2008 to December 2012). Again the only controlled gas is CO2 (although France, the Netherlands and now Norway53 have opted to include NO2), and again permits were allocated by Member States in NAPs. 2005 was set as the base year against which emissions changes are measured. Business-as-usual emissions for 2005 were set at 2177 MtCO2. The object of Phase II is to reduce emissions by 4.3 per cent to 2083 MtCO2 per annum.
Under the legislation for Phase II, a greater quantity of permit auctioning was envisaged – up to ten per cent – but this was left to the discretion of the Member States. The result is that only Germany (nine per cent)
51 http://www.internationalprofs.org/iesc/index.php?option=com_content&view=article&id=118:eu-ets&catid=908:eu-ets&Itemid=88
52 http://www.sandbag.org.uk/files/sandbag.org.uk/carbon_fat_cats_march2010.pdf
53 While not part of the European Union, Norway uses the EU ETS to regulate emissions from its high-emitting industry sectors.
and the UK (seven per cent) have declared an intention to auction anything like this quantity, with most making no commitment to do so. From Phase II, the ‘Linking Directive’ – which links the EU ETS with the Kyoto Protocol’s flexible mechanisms – allows companies to start using CDM or JI credits (see Chapter 3) up to a limit of 11 per cent of a Member State’s total allowance.5455 This will
effectively allow emissions within the EU ETS to increase during Phase II.56 The price of EU ETS
permits in Phase II has fluctuated almost as dramatically as in Phase I, falling from over € 30
to less than € 10. This time the fall has been attributed to the reduction in industrial activity following the global ‘credit crunch’ of 2008-09. In September 2009 the EU ETS permit price was around € 14-15. This greater resilience in price, despite the fact that permits were once again over-allocated, is due to the fact that this time permits can be banked through to the next phase. Many expect that power companies, which in Phase II continued to receive their permits free of charge, will gain windfall profits between € 23 and € 71 billion during Phase II because of the continuation of the practice of passing on non-existent costs for permit purchases to the consumer.57
54 The ETS directive extends the rights to use these credits for the third trading period and allows a limited additional quantity to be used in such a way that the overall use of credits is limited to 50% of the EU-wide reductions over the period 2008-20. For existing installations this will represent a total level of access of approximately 1.6 billion credits over the period 2008-20. In practice, this means that existing operators will be able to use credits up to a minimum of 11% of their allocation during the period 2008-12. http://europa.eu/rapid/pressReleasesAction.do?reference=MEMO/08/796&for mat=HTML&aged=0&language=EN&guiLanguage=en
55 See http://sandbag.org.uk/carbondata/cers for an interactive map of the CDM offset projects companies covered by the EU ETS bought offset credits from to cover part of their 2009 emissions.
56 For a description of the impact of the Linking Directive on the EU ETS see the UK National Audit Office report on the ETS, p58 59 available at http://www.nao.org.uk//idoc.ashx?docId=BA234E01-C494-4AB4-898B-812A0FE1C4F5&version=-1
57 WWF (2008) EU ETS Phase II – The potential and scale of windfall profits in the power sector. March 2008. http://assets.panda.org/downloads/point_carbon_wwf_windfall_profits_mar08_final_report_I.pdf and National Audit Office (2009) European Union Emissions Trading Scheme. NAO London. March 2009.
The EU operations of ArcelorMittal, the world’s largest steel company, are covered by the EU ETS. The company’s operations have received significantly more permits than they needed to cover their operations. The company is likely to have made over € 2 billion in profits from trading EU ETS permits between 2005 and 2008, with over € 500 million of the profits accrued in 2008 alone.
Chapter 4 gives more detail on how, during the financial credit crisis of 2008-09, some companies used their EU ETS allowances to raise cash that was otherwise hard to obtain due to the unavailability of bank credits and lack of liquidity in the banking sector – giving them a significant business advantage not available to businesses outside the EU ETS, such as the renewable energy industry.
Phase III will run from January 2013 until the end of 2020. The final
emissions target has been set at 1720 MtCO2e, 14 per cent below 2005 levels (and equivalent to 21 per cent below 1990 levels, but see the qualifications below regarding the use of offset credits). The legislation for Phase III makes modifications to the existing rules of the EU ETS and introduces some new ones: