BUILDING ROOF BOUNDARY EXTRACTION FROM LiDAR AND IMAGE DATA
BASED ON MARKOV RANDOM FIELD
A. P. Dal Poz a, *, V. J. M. Fernandes b
a
Dept. of Cartography, São Paulo State University, R. Roberto Simonsen, 305, Presidente Prudente, Brazil - [email protected] b
Ph.D. student, São Paulo State University, R. Roberto Simonsen, 305, Presidente Prudente, Brazil - [email protected]
KEY WORDS: Markov Random Field, LiDAR, Aerial images, Building roof boundary
ABSTRACT:
In this paper a method for automatic extraction of building roof boundaries is proposed, which combines LiDAR data and high-resolution aerial images. The proposed method is based on three steps. In the first step aboveground objects are extracted from LiDAR data. Initially a filtering algorithm is used to process the original LiDAR data for getting ground and non-ground points. Then, a region-growing procedure and the convex hull algorithm are sequentially used to extract polylines that represent aboveground objects from the non-ground point cloud. The second step consists in extracting corresponding LiDAR-derived aboveground objects from a high-resolution aerial image. In order to avoid searching for the interest objects over the whole image, the LiDAR-derived aboveground objects’ polylines are photogrammetrically projected onto the image space and rectangular bounding boxes (sub-images) that enclose projected polylines are generated. Each sub-image is processed for extracting the polyline that represents the interest aboveground object within the selected sub-image. Last step consists in identifying polylines that represent building roof boundaries. We use the Markov Random Field (MRF) model for modelling building roof characteristics and spatial configurations. Polylines that represent building roof boundaries are found by optimizing the resulting MRF energy function using the Genetic Algorithm. Experimental results are presented and discussed in this paper.
* Corresponding author
1. INTRODUCTION
Building extraction methods are important in the context of capturing and updating spatial data for applications that involve urban areas. However, automated building roof extraction has remained a challenging task, mainly due to the varying building roof configurations, the varying neighbourhood contexts, and noise in the input data. High-resolution images are rich in semantic information and in fine geometric details, but they can be affected by illumination differences and occlusions. However, the Light Detection and Ranging (LiDAR) system directly provides three-dimensional point clouds with high confidence height information, which is the most useful data for detecting aboveground objects. However, LiDAR data are poor in semantic information and, due to the inherent subsampling process, are also poor in fine geometric details. Due to the complementary characteristics of these two data sources, it is expected that objects, such as buildings, can be extracted with more accuracy, completeness, and reliability than by using a single data source.
In view of the complementary characteristics of the LiDAR and image data, the combination of both data sources is a promising strategy for extracting high-quality building roof boundaries. In Chen and Zhao (2012) LiDAR data are used to generate a normalized Digital Surface Model (nDSM), from which candidates are obtained to represent buildings. Image information is used to help the vegetation filtering. In Awrangjeb et al. (2013) information from LIDAR data and multispectral imagery are used for detecting and extracting straight lines. LiDAR points are further classified into ground and non-ground points and, those from the non-ground points' set are checked for proximity to long straight lines. LiDAR points that satisfy this criterion are used for modelling the roof planes and reconstructing the whole building roof. Li et al.
(2013) also explores the complementary advantages of LiDAR data and optical imagery. This method is fully data-driven and the main steps are: points of each roof patch are detected from LiDAR point cloud; initial building edges are extracted from optical imagery using a modified Canny detector; building boundaries are extracted by combining the previous derived roof patches and edges. Zhou and Zhou (2014) proposed a seamless fusion between LiDAR and aerial imagery using aspect graphs, which utilize house features like geometry, structures, and shapes. A method for building and tree detection from LiDAR data and aerial images is presented in Zarea and Mohammadzadeh (2016), which combines several image analysis tools, like the support vector machine, mathematical morphology, and k-means cluster algorithm.
A theory that has been gaining ground in feature extraction, such as in the extraction of buildings, is the probabilistic theory of Markov Random Field (MRF) (Krishnamachari and Chellappa, 1996; Katartzis and Sahli, 2008; Ferraioli, 2010; Galvanin and Dal Poz, 2012; Fernandes and Dal Poz, 2016). The great advantage of using the MRF model is that this formalism easily allows the characterization of contextual information. Specifically, the analysis of complex urban scenes can be facilitated if neighbourhood information is incorporated into the scene modelling. In this context, this paper proposes a method for the automatic extraction of building roof boundaries that integrates LiDAR data and high-resolution aerial images, which is based on an MRF-based energy function. This energy function is developed on the basis of assumptions that roofs are rectilinear (i.e., with roof sides intersecting at right angles) and spatially distributed in a block or grid pattern. This paper is organized as follows: Section 2 describes the proposed method; Section 3 presents the experimental results; and the main conclusions and future perspectives are presented in Section 4.
2. PROPOSED METHOD FOR EXTRACTION OF BUILDING ROOF BOUNDARIES
The proposed method is based on the following three steps: extraction of polylines delimiting aboveground objects (e. g., vegetation and buildings) from LiDAR data; extraction of polylines delimiting the same aboveground objects (extracted from LiDAR data) from a high-resolution aerial image; and recognition of the building roof boundaries by a Markov Random Field (MRF) analysis of the aboveground objects previously extracted from the LiDAR and image data.
2.1 Extraction of aboveground object boundaries from LiDAR and image data
Our procedures for extracting aboveground objects from LiDAR and image data use standard algorithms (like the region growing segmentation algorithm, the convex hull boundary extraction algorithm, and the watershed segmentation method). As such, only general procedures are presented below.
The extraction of aboveground objects from LiDAR data is accomplished as follows. First, the original LiDAR point cloud is submitted to a filtering algorithm for getting ground and non-ground points. These two sets of points allow the generation of a Digital Surface Model (MDS) and a Digital Terrain Model (MDT). Second, an nDSM is computed by subtracting the MDT from the MDS. Third, taking into account that building roof points are found above certain height above the ground (e.g., 2.5 m), points below a height threshold are eliminated from the nDSM. Fourth, the region-growing algorithm is applied to remaining points to group points into segments based on the proximity criterion. Next, the convex hull algorithm is used for computing polylines that represent boundaries of segments (aboveground objects) previously derived. Last, polylines that are below a minimum area threshold (ta) are discarded.
Next step consists in extracting corresponding LiDAR-derived aboveground objects from a high-resolution aerial image. In order to avoid searching for the interest objects over the whole image, the LiDAR-derived aboveground objects’ polylines are photogrammetrically projected onto the image space and rectangular bounding boxes that enclose projected polylines are generated. A segmentation scheme is applied to each sub-image that is delimited by a rectangular bounding box. One basic difficult in segmenting a building roof in a high-resolution aerial image is the difference in illumination among roof faces with different orientations. In order to mitigate this problem and facilitate the roof segmentation into a unique segment, first the RGB input image is transformed into the YUV colour system. Second, U and V components are used to generate a two-dimensional histogram, which is further smoothed by the mean to reduce the noise. The smoothed histogram is now segmented by the watershed method for separating relevant regions inside a selected sub-image. Finally, taking into account that the interest object (i. e., the building roof) is the largest inside the selected sub-image, the polyline with largest area is selected to be a candidate to represent a building roof boundary for this sub-image.
2.2 Identification of building roof polylines
The MRF model has the advantage of characterizing the contextual knowledge by modeling the spatial relationships between the primitives (e.g., segments of lines, polylines etc.) that represent real world objects.
Let X= {X1, X2, …, Xn} be a family of random variables that are defined over the set of n primitives R= {R1, R2, ..., Rn}, where each Xi corresponds to Ri. According to the Hammersley– Clifford theorem (Kopparapu and Desai, 2001), an MRF can be characterized by the Gibbs distribution, i.e.,
The energy function U(x) can be formulated to model geometric and contextual information of building roofs. An energy function with these characteristics has been formulated with the basis of polylines that represent aboveground objects extracted from the LiDAR and image data. It is worthy anticipating that the energy function U(x) is formulated by using the LiDAR-derived polylines projected onto the image-space, instead of original polylines extracted from LiDAR data. The energy function is defined so that each aboveground object is associated with a random variable (xi), which takes binary values: 1 (one) if the aboveground object is a building roof; or 0 (zero) otherwise. This rule results in an n-dimensional random vector, where n is the number of aboveground objects extracted from the LiDAR/image data. This random vector is the unknown that is determined in an optimization process.
The energy function U(x) is formulated with the basis of three energy terms, which are based on the following properties: the rectangularity; the spatial relationship; and the relative orientation.
In the first energy term (U1(x)), which is based on the rectangularity attribute, the basic idea is to favor aboveground objects with rectilinear geometry, i.e., objects delimited by straight-line segments that intersect at approximately right angles. The rectangularity attribute is defined as the angle between the main and secondary direction of the polyline that represent an object boundary. This angle is exactly 90o for a perfect rectilinear polyline. The rectangularity is computed for each polyline extracted from the image and for the corresponding projected polyline. As roof polylines extracted from the high-resolution image are geometrically better than the corresponding projected (LiDAR-derived) polylines, we model this prior knowledge in the rectangularity energy term (Equation 2) by using a higher weight for the rectangularity computed for the former polylines (those extracted from the image).
(2)
Where: and ; is the absolute
value operator; and are angles between the main and secondary directions of the polyline extracted from the image and the corresponding projected polyline, respectively; and and are weights assigned to rectangularities computed for the polyline extracted from the image and for the projected polyline, respectively ( ).
The spatial energy term (Equation 3) should favour building roofs that are spatially arranged so that their main or secondary directions are parallel or perpendicular to one another.
(3)
Where: and ; is the angle between the main directions of ith and jth aboveground objects extracted from the image; is the angle between main directions of corresponding project aboveground objects (i. e., the ith and jth aboveground objects); and and are weights associated to the spatial orientation term for aboveground objects extracted from the image ( ) and for corresponding projected aboveground objects ( ), respectively. Therefore, the spatial relationships within the two sets of polyline (extracted from the image and corresponding ones projected onto the image) are balanced together according to the spatial relationship energy term (Equation 3). Due to the same reason already discussed, it is necessary to assign a higher value for the weight , such that .
The relative orientation energy term (Equation 4) is computed in function of angles between the main directions of the polylines extracted from the image and the corresponding projected polylines. Thus, polylines that represent rectilinear roofs should be benefited, because the main directions of pair of polylines extracted from the image and corresponding projected ones must be similar. This is not expected to happen when dealing with natural objects such as vegetation.
(4)
Where: ; is the main direction of the polyline extracted from the image and that represent the ith aboveground object; is the main direction of the project polyline and that represent the same (ith) aboveground object. In case both polylines, extracted from the image and corresponding projected one, are perfectly rectilinear and, in addition, the image is ideally oriented, the main direction of these polylines are parallel. The opposite tends to occur with natural objects, like vegetation.
Finally, the energy equation is formulated as follows,
U(x)= + + (5)
Where: are positive constants, such that .
The optimal configuration x is obtained by minimizing the energy function U(x); i.e., x= argmin(U(x)). We employed the Genetic Algorithm (GA). After randomly selecting an initial population (i.e., an initial solution for x), the GA algorithm proceeds by employing the selection (which equates to survival of the fittest), crossover (which represents the coupling between individuals), and mutation (which introduces random modifications) operators, which introduce random modifications. The GA optimization converges when the fittest individual (x) is good enough according to the fitness measurement (i.e., U(x)). For more details on the GA theory, please refer to the relevant literature, such as Goldberg (1989).
3. EXPERIMENTAL RESULTS
The proposed method has been experimentally evaluated based on test areas of different complexities and two of these experiments are presented in this section. The first experiment is relatively simple because the scene is basically composed of few isolated buildings. The second experiment is based on a test
area with relatively close buildings, which may put some difficult to separate them, mainly when using LiDAR data.
The data set used in our experiments consisted of: 10-cm high-resolution aerial image, along with interior and exterior orientation parameters; and LiDAR point cloud with density of approximately 8 points/m2. This data set was acquired from the urban area of Presidente Prudente-SP, Brazil, and was kindly provided by Engemap Geoinformation - Assis-SP, Brazil.
The values of most important parameters and thresholds used in the experiments were:
• Minimum area threshold (ta): 20 m 2
;
• Weights and used in the energy terms and : 0.7 and 0.3, respectively;
• Weights used in the energy function U(x): = 0.4 and = 0.3;
• Probability of crossover and mutation of the GA method: 0.7 and 0.01, respectively;
• Size of the population generated by the GA method and number of iterations: 15 and 40, respectively.
Most of the thresholds and parameters were determined by trial and error, but they were kept unchanged in both experiments.
(a)
(b)
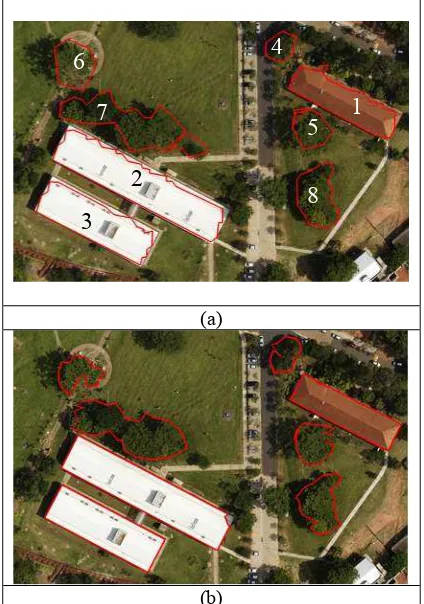
Figure 1. Test 1. (a) LiDAR-derived aboveground polylines projected onto the image; and (b) Polylines extracted from the image
The first test aims at verifying the performance of the proposed method in the extraction of building roof boundaries in a relative simple configuration, in which buildings are clearly separated in the image. As can be seen in Figure 1, the test area contains three buildings, all of them with simple rectilinear roofs.
1
2
3
4
5
6
7
8
Figure 1(a) shows the LiDAR-derived aboveground polylines projected onto the aerial image. Now on we refer to these polylines as projected polylines. Eight polylines were extracted from the LiDAR data, three of which represent the three buildings that are present in the test area (polylines 1, 2, and 3); other polylines refer to high vegetation (polylines 4, 5, 6, 7 and 8). It is important to emphasize that these polylines have already undergone the minimum area filtering. Figure 1(b) shows the polylines extracted from the aerial image, which are supposed to totally or partially represent the same aboveground objects extracted from the LiDAR data. As expected, the building roof polylines are geometrically much better, as they are more regular and accurate when compared to corresponding projected polylines.
(a)
(b)
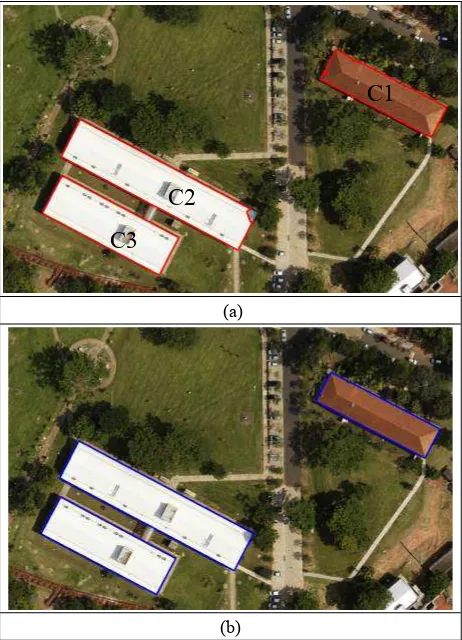
Figure 2. Test 1. (a) Building roof polylines identified by the GA algorithm; (b) Reference building roof boundaries
Figure 2(a) shows the result of the GA optimization of the proposed MRF-based energy function. The obtained result is corrected, without occurrence of false positives/negatives. Despite the low complexity of the scene, the shape and the configuration of the buildings match very well the properties (the rectangularity modelled by the Equation 2, the spatial relationship modelled by Equation 3, and the relative orientation modelled by Equation 4) modelled in the energy function (Equation 5). The opposite occurs with vegetation areas, which naturally present irregular shapes and, as a consequence, their corresponding polylines extracted from the LiDAR and image data may be very different in geometry. Thus, vegetation polylines can be easily discarded because they do not contribute to the minimum of the energy function U(x).
In order to quantitatively assess the obtained results, the indexes of completeness and correctness were estimated, taking into account the extracted building roof polylines (Figure 2(a)) and
the corresponding reference polylines (Figure 2(b)). The average completeness and correctness for this experiments were 99,19% and 99,94%, respectively. The lowest values for the completeness (98,28%) and the correctness (98,28%) were obtained for building roof boundaries C2 and C1, respectively. The building roof boundary C3 got the optimal correctness value (100%).
(a)
(b)
Figure 3. Test 2. (a) LiDAR-derived aboveground polylines projected onto the image; and (b) Polylines extracted from the image
The second experiment is based on a test area that presents some difficulties for the proposed method. The three topmost buildings in Figure 3(a,b) show main roofs connected to adjacent narrow roofs with very different materials. As a result, it is expected that the segmentation of those roofs in whole segments is a tough task.
The LiDAR-derived aboveground polylines projected onto the aerial image are shown in Figure 3(a). This means that eight aboveground objects were extracted from the LiDAR data, four of which represent building roofs (polylines 1-4, Figure 3(a)) and the remaining objects represent high vegetation segments (polylines 5-8, Figure 3(a)). The nDSM segmentation method
C1
C2
C3
1
2
3
4
5
6
7
8
fails in segmenting the two topmost buildings (see polyline 4 in Figure 3(a)), resulting in one segment for both buildings. This failure occurs due to several reasons, as e.g.: both buildings are too near; and the adjacent regions (blue ellipse in Figure 3(a)) of both building roofs have similar heights; and insufficient LiDAR point cloud quality.
Figure 3(b) shows the polylines extracted from the aerial image, which in principle correspond to the same aboveground objects extracted from the LiDAR data. As expected, the building roof polylines extracted from the image is geometrically better then the corresponding projected polylines. However, some problems can be observed in the polylines extracted from the image. First, although the segmentation method correctly segments the two topmost building roofs within the sub-image that contains the projected polyline 4 (Figure 3(a)), the maximum area criterion adopted to select the final polyline within this sub-image maintains only one polyline. This failure highlights that it is necessary that the aboveground objects must be separated, at least coarsely, by the LiDAR segmentation method to avoid the occurrence of false negatives. Another kind of segmentation problem occurs with buildings composed by roof parts with very different contrast (as e.g. see the two topmost buildings).
(a)
(b)
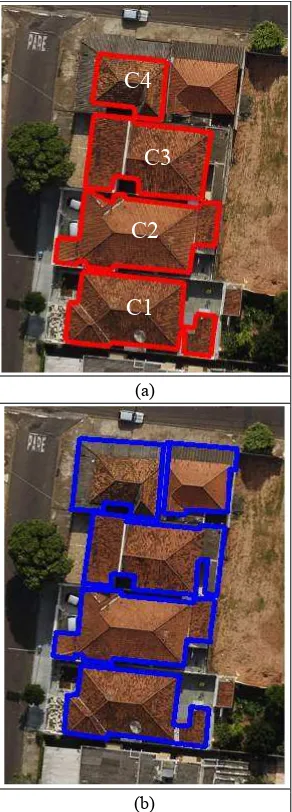
Figure 4. Test 2. (a) Building roof polylines identified by the GA algorithm; (b) Reference building roof boundaries
The result of the GA optimization of the proposed MRF-based energy function is shown in Figure 4(a). The optimization process identified all building roof polylines that were previously extracted from the image, i.e. the extraction failure (false negative) was due to the segmentation problem already discussed beforehand. In addition, no false positive was verified. On the other word, the optimization process was well succeeded. The reasons are the same ones discussed for the first experiment – all building roofs are rectilinear and their main directions are parallel to one another.
The completeness and correctness parameters were computed for each identified building roof polylines (Figure 4(a)) by using the corresponding reference building roof polyline (Figure 4(b)). The completeness and correctness values were 90,46% and 99,32% in average, respectively. The lowest value for the completeness parameter was obtained for the building roof C4 (75,04%), because the roof faces connected to the main roof were not extracted. The completeness value for the building roof C3 (about 90%) was also relatively low. Building roof C1 and C2 almost got the optimal completeness value of 100%. The correctness values were above 95% for all building roofs.
4. CONCLUSIONS AND FUTURE WORK
In this paper, a method for the automatic extraction of building roof boundaries with the integration of LiDAR data and aerial image was presented and evaluated. Polylines extracted from LiDAR data that represent aboveground objects are projected onto the image to delimit regions (sub-images) where polylines representing the same aboveground objects are extracted. The process of identifying polylines that represent building roof boundaries is performed through the GA optimization method of the MRF-based energy function, which models relevant properties of building roof boundaries.
The proposed method was preliminarily evaluated based on two experiments of different complexities. Although the delimitation of regions in the image enabled in many cases the accurate and reliable extraction of aboveground object boundaries previously extracted from the LiDAR data, some types of segmentation failures of the LiDAR data caused the incorrect segmentation of the selected sub-image. An example of such problem occurred in Test 2 with the building boundary C4, where two adjacent roofs in the LiDAR data were segmented into a single region and in the corresponding sub-image the segmentation process separated both roof buildings into two regions; consequently, one out of two building roof boundaries was discarded by the maximum area heuristic. On the other hand, texture and illumination variations on the roof surfaces were well modelled through the proposed image segmentation procedure. The energy function, constructed from the assumptions that building roofs are rectilinear and spatially distributed in regular urban squares, responded optimally to the two selected tests.
An important direction for future work is the refinement of the proposed LiDAR and image data segmentation procedures, although other important factors can influence the segmentation results, like the LiDAR point cloud quality. Another possibility for future work would be the application of reconstruction methods aiming at the regularization of the extracted building roof polylines. Finally, the use of true orthophoto could be an excellent option for the application of the method in complex urban areas, where viewpoint-dependent obstructions are common.
C1
C2
C3
C4
ACKNOWLEDGEMENTS
This work was supported by FAPESP (São Paulo State Foundation for Scientific Research, Brazil), grant numbers 2013/13138-0 and 2012/22332-2, and CNPq (National Council for Scientific and Technological Development, Brazil), grant number 306842/2013-0.
REFERENCES
Awrangjeb, M.; Zhang, C. Fraser, C. S., 2013. Automatic extraction of building roofs using LIDAR data and multispectral imagery. ISPRS Journal of Photogrammetry and Remote Sensing, 83, pp. 1–18.
Chen, L.; Zhao, S., 2012. Building detection in an urban area using LiDAR data and quickbird imagery. International Journal of Remote Sensing, 33(15), pp. 5135–5148.
Fernandes, V. J. M.; Dal Poz, A. P., 2016.A Markov-Random-Field Approach for Extracting Straight-Line Segments of Roofs From high-resolution aerial images. IEEE Journal of Selected Topics in Applied Earth Observations and Remote Sensing, 9(12), pp. 5493 – 5505.
Ferraioli, G., 2010. Multichannel InSAR Building Edge Detection. IEEE Transaction on Geosciences and Remote Sensing, 48(3), pp. 1224–1231.
Galvanin, E. A. S.; Dal Poz, A. P., 2012. Extraction of building roof countors from Lidar using a Markov-Random-Field-Based approach.IEEE Transactions Geocience and Remote Sensing, 50, pp. 981-987.
Goldberg, D. E., 1989. Genetic Algorithms in search, optimization, and machine learning. Alabama: Addison-Wesley publishing company.
Katartzis, A.; H. Sahli, H., 2008. A Stochastic Framework for the Identification of Building Rooftops using a single Remote Sensing Image. IEEE Transactions Geocience and Remote Sensing, 46, pp. 259-271.
Kopparapu, S. K.; Desai, U. B., 2001. Bayesian approach to image interpretation. The Springer International Series in Engineering and Computer Science.
Krishnamachari, S.; Chellappa, R., 1996. Delineating buildings by grouping lines with MRFs. IEEE Transaction on Image Processing, 5(1), pp. 164-168.
Li, Y.; Wu, H.; An, R.; Xu, H.; He, Q.; Xu, J., 2013. An improved building boundary extraction algorithm based on fusion of optical imagery and LIDAR data. Optik, 124, pp. 5357– 5362.
Zarea, A.; Mohammadzadeh, A. 2016. A Novel Building and Tree Detection Method From LiDAR Data and Aerial Images. IEEE Journal of Selected Topics in Applied Earth Observations and Remote Sensing, 9(5), pp. 1864-1875.
Zhou, G.; Zhou, X., 2014. Seamless Fusion of LiDAR and Aerial Imagery for Building Extraction. IEEE Transactions on Geoscience and Remote Sensing, 52(11), pp. 7393-7407.