Table of Contents
Introduction
Chapter 1: The Big Data Business Opportunity
The Business Transformation Imperative
The Big Data Business Model Maturity Index
Big Data Business Model Maturity Observations
Summary
Chapter 2: Big Data History Lesson
Consumer Package Goods and Retail Industry Pre-1988
Lessons Learned and Applicability to Today's Big Data Movement
Summary
Chapter 3: Business Impact of Big Data
Big Data Impacts: The Questions Business Users Can Answer
Managing Using the Right Metrics
Data Monetization Opportunities
Summary
Chapter 4: Organizational Impact of Big Data
Data Analytics Lifecycle
Data Scientist Roles and Responsibilities
New Organizational Roles
Liberating Organizational Creativity
Summary
Chapter 5: Understanding Decision Theory
Business Intelligence Challenge
Big Data User Interface Ramifications
The Human Challenge of Decision Making
Summary
Chapter 6: Creating the Big Data Strategy
The Big Data Strategy Document
Starbucks Big Data Strategy Document Example
San Francisco Giants Big Data Strategy Document Example
Summary
Chapter 7: Understanding Your Value Creation Process
Understanding the Big Data Value Creation Drivers
Michael Porter's Valuation Creation Models
Summary
Chapter 8: Big Data User Experience Ramifications
The Unintelligent User Experience
Understanding the Key Decisions to Build a Relevant User
Experience
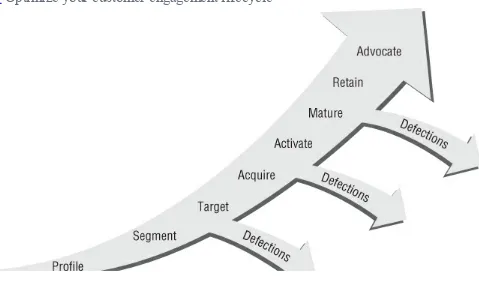
Using Big Data Analytics to Improve Customer Engagement
Uncovering and Leveraging Customer Insights
Big Data Can Power a New Customer Experience
Summary
Chapter 9: Identifying Big Data Use Cases
The Big Data Envisioning Process
The Prioritization Process
Using User Experience Mockups to Fuel the Envisioning Process
Summary
The Solution Engineering Process
Solution Engineering Tomorrow's Business Solutions
Reading an Annual Report
Summary
Chapter 11: Big Data Architectural Ramifications
Big Data: Time for a New Data Architecture
Introducing Big Data Technologies
Bringing Big Data into the Traditional Data Warehouse World
Summary
Chapter 12: Launching Your Big Data Journey
Explosive Data Growth Drives Business Opportunities
Traditional Technologies and Approaches Are Insufficient
The Big Data Business Model Maturity Index
Driving Business and IT Stakeholder Collaboration
Operationalizing Big Data Insights
Big Data Powers the Value Creation Process
Summary
Chapter 13: Call to Action
Identify Your Organization's Key Business Initiatives
Start with Business and IT Stakeholder Collaboration
Formalize Your Envisioning Process
Leverage Mockups to Fuel the Creative Process
Understand Your Technology and Architectural Options
Build off Your Existing Internal Business Processes
Uncover New Monetization Opportunities
Introduction
Big data is today's technology hot topic. Such technology hot topics come around every four to five years and become the “must have” technologies that will lead organizations to the promised land—the “silver bullet” that solves all of our technology deficiencies and woes. Organizations fight through the confusion and hyperbole that radiate from vendors and analysts alike to grasp what the technology can and cannot do. In some cases, they successfully integrate the technology into the organization's technology landscape—technologies such as relational databases, Enterprise Resource Planning (ERP), client-server architectures, Customer Relationship Management (CRM), data warehousing, e-commerce, Business Intelligence (BI), and open source software.
However, big data feels different, maybe because at its heart big data is not about technology as much as it's about business transformation—transforming the organization from a retrospective, batch, data constrained, monitor the business environment into a predictive, real-time, data hungry, optimize the business environment. Big data isn't about business parity or deploying the same technologies in order to be like everyone else. Instead, big data is about leveraging the unique and actionable insights gleaned about your customers, products, and operations to rewire your value creation processes, optimize your key business initiatives, and uncover new monetization opportunities. Big data is about making money, and that's what this book addresses—how to leverage those unique and actionable insights about your customers, products, and operations to make money.
This book approaches the big data business opportunities from a pragmatic, hands-on perspective. There aren't a lot of theories here, but instead lots of practical advice, techniques, methodologies, downloadable worksheets, and many examples I've gained over the years from working with some of the world's leading organizations. As you work your way through this book, you will do and learn the following:
Educate your organization on a common definition of big data and leverage the Big Data
Business Model Maturity Index to communicate to your organization the specific business areas where big data can deliver meaningful business value (Chapter 1).
Review a history lesson about a previous big data event and determine what parts of it you can apply to your current and future big data opportunities (Chapter 2).
Learn a process for leveraging your existing business processes to identify the “right” metrics against which to focus your big data initiative in order to drive business success (Chapter 3). Examine some recommendations and learnings for creating a highly efficient and effective
organizational structure to support your big data initiative, including the integration of new roles —like the data science and user experience teams, and new Chief Data Office and Chief
Analytics Officer roles—into your existing data and analysis organizations (Chapter 4). Review some common human decision making traps and deficiencies, contemplate the ramifications of the “death of why,” and understand how to deliver actionable insights that counter these human decision-making flaws (Chapter 5).
Learn a methodology for breaking down, or functionally “decomposing,” your organization's business strategy and key business initiatives into its key business value drivers, critical success factors, and the supporting data, analysis, and technology requirements (Chapter 6).
real-time data access, and predictive analytics—against value creation models such as Michael Porter's Five Forces Analysis and Value Chain Analysis to envision where and how big data can optimize your organization's key business processes and uncover new monetization opportunities (Chapter 7).
Understand how the customer and product insights gleaned from new sources of customer behavioral and product usage data, coupled with advanced analytics, can power a more compelling, relevant, and profitable customer experience (Chapter 8).
Learn an envisioning methodology—the Vision Workshop—that drives collaboration between business and IT stakeholders to envision what's possible with big data, uncover examples of how big data can impact key business processes, and ensure agreement on the big data desired end-state and critical success factors (Chapter 9).
Learn a process for pulling together all of the techniques, methodologies, tools, and worksheets around a process for identifying, architecting, and delivering big data-enabled business solutions and applications (Chapter 10).
Review key big data technologies (Hadoop, MapReduce, Hive, etc.) and analytic developments (R, Mahout, MADlib, etc.) that are enabling new data management and advanced analytics approaches, and explore the impact these technologies could have on your existing data warehouse and business intelligence environments (Chapter 11).
Summarize the big data best practices, approaches, and value creation techniques into the Big Data Storymap—a single image that encapsulates the key points and approaches for delivering on the promise of big data to optimize your value creation processes and uncover new monetization opportunities (Chapter 12).
Conclude by reviewing a series of “calls to action” that will guide you and your organization on your big data journey—from education and awareness, to the identification of where and how to start your big data journey, and through the development and deployment of big data-enabled business solutions and applications (Chapter 13).
We will also provide materials for download on www.wiley.com/go/bigdataforbusiness, including the different envisioning worksheets, the Big Data Storymap, and a training
presentation that corresponds with the materials discussed in this book.
The beauty of being in the data and analytics business is that we are only a new technology innovation away from our next big data experience. First, there was point-of-sale, call detail, and credit card data that provided an earlier big data opportunity for consumer packaged goods, retail, financial services, and telecommunications companies. Then web click data powered the online commerce and digital media industries. Now social media, mobile apps, and sensor-based data are fueling today's current big data craze in all industries—both consumer and business-to-business. And there's always more to come! Data from newer technologies, such as wearable computing, facial recognition, DNA mapping, and virtual reality, will unleash yet another round of big data-driven value creation opportunities.
Chapter 1
The Big Data Business Opportunity
Every now and then, new sources of data emerge that hold the potential to transform how organizations drive, or derive, business value. In the 1980s, we saw point-of-sale (POS) scanner data change the balance of power between consumer package goods (CPG) manufacturers like Procter & Gamble, Unilever, Frito Lay, and Kraft—and retailers like Walmart, Tesco, and Vons. The advent of detailed sources of data about product sales, soon coupled with customer loyalty data, provided retailers with unique insights about product sales, customer buying patterns, and overall market trends that previously were not available to any player in the CPG-to-retail value chain. The new data sources literally changed the business models of many companies.
Then in the late 1990s, web clicks became the new knowledge currency, enabling online merchants to gain significant competitive advantage over their brick-and-mortar counterparts. The detailed insights buried in the web logs gave online merchants new insights into product sales and customer purchase behaviors, and gave online retailers the ability to manipulate the user experience to influence (through capabilities like recommendation engines) customers' purchase choices and the contents of their electronic shopping carts. Again, companies had to change their business models to survive.
Today, we are in the midst of yet another data-driven business revolution. New sources of social media, mobile, and sensor or machine-generated data hold the potential to rewire an organization's value creation processes. Social media data provide insights into customer interests, passions, affiliations, and associations that can be used to optimize your customer engagement processes (from customer acquisition, activation, maturation, up-sell/cross-sell, retention, through advocacy development). Machine or sensor-generated data provide real-time data feeds at the most granular level of detail that enable predictive maintenance, product performance recommendations, and network optimization. In addition, mobile devices enable location-based insights and drive real-time customer engagement that allow brick-and-mortar retailers to compete directly with online retailers in providing an improved, more engaging customer shopping experience.
The massive volumes (terabytes to petabytes), diversity, and complexity of the data are straining the capabilities of existing technology stacks. Traditional data warehouse and business intelligence architectures were not designed to handle petabytes of structured and unstructured data in real-time. This has resulted in the following challenges to both IT and business organizations:
Rigid business intelligence, data warehouse, and data management architectures are impeding the business from identifying and exploiting fleeting, short-lived business opportunities.
Retrospective reporting using aggregated data in batches can't leverage new analytic capabilities to develop predictive recommendations that guide business decisions.
Data aggregation and sampling destroys valuable nuances in the data that are key to uncovering new customer, product, operational, and market insights.
This blitz of new data has necessitated and driven technology innovation, much of it being powered by open source initiatives at digital media companies like Google (Big Table), Yahoo! (Hadoop), and Facebook (Hive and HBase), as well as universities (like Stanford, UC Irvine, and MIT). All of these big data developments hold the potential to paralyze businesses if they wait until the technology dust settles before moving forward. For those that wait, only bad things can happen:
Competitors innovate more quickly and are able to realize compelling cost structure advantages. Profits and margins degenerate because competitors are able to identify, capture, and retain the most valuable customers.
Market share declines result from not being able to get the right products to market at the right time for the right customers.
Missed business opportunities occur because competitors have real-time listening devices rolling up real-time customer sentiment, product performance problems, and immediately-available monetization opportunities.
The time to move is now, because the risks of not moving can be devastating.
The Business Transformation Imperative
The big data movement is fueling a business transformation. Companies that are embracing big data as business transformational are moving from a retrospective, rearview mirror view of the business that uses partial slices of aggregated or sampled data in batch to monitor the business to a forward-looking, predictive view of operations that leverages all available data—including structured and unstructured data that may sit outside the four walls of the organization—in real-time to optimize business performance (see Table 1.1).
Table 1.1 Big Data Is About Business Transformation Today's Decision Making Big Data Decision Making
“Rearview Mirror” hindsight “Forward looking” recommendations Less than 10% of available data Exploit all data from diverse sources Batch, incomplete, disjointed Real time, correlated, governed Business Monitoring Business Optimization
Think of this as the advent of the real-time, predictive enterprise!
data that they can leverage throughout the organization's value creation processes.
Walmart Case Study
Data can transform both companies and industries. Walmart is famous for their use of data to transform their business model.
The cornerstone of his [Sam Walton's] company's success ultimately lay in selling goods at the lowest possible price, something he was able to do by pushing aside the middlemen and directly haggling with manufacturers to bring costs down. The idea to “buy it low, stack it high, and sell it cheap” became a sustainable business model largely because Walton, at the behest of David Glass, his eventual successor, heavily invested in software that could track consumer behavior in real time from the bar codes read at Walmart's checkout counters.
He shared the real-time data with suppliers to create partnerships that allowed Walmart to exert significant pressure on manufacturers to improve their productivity and become ever more efficient. As Walmart's influence grew, so did its power to nearly dictate the price, volume, delivery, packaging, and quality of many of its suppliers' products. The upshot: Walton flipped the supplier-retailer relationship upside down.1
Walmart up-ended the balance of power in the CPG-to-retailer value chain. Before they had access to detailed POS scanner data, the CPG manufacturers (such as Procter & Gamble, Unilever, Kimberley Clark, and General Mills,) dictated to the retailers how much product they would be allowed to sell, at what prices, and using what promotions. But with access to customer insights that could be gleaned from POS data, the retailers were now in a position where they knew more about their customers' behaviors—what products they bought, what prices they were willing to pay, what promotions worked the most effectively, and what products they tended to buy in the same market basket. Add to this information the advent of the customer loyalty card, and the retailers knew in detail what products at what prices under what promotions appealed to which customers. Soon, the retailers were dictating terms to the CPG manufacturers—how much product they wanted to sell (demand-based forecasting), at what prices (yield and price optimization), and what promotions they wanted (promotional effectiveness). Some of these retailers even went one step further and figured out how to monetize their POS data by selling it back to the CPG manufacturers. For example, Walmart provides a data service to their CPG manufacturer partners, called Retail Link, which provides sales and inventory data on the manufacturer's products sold through Walmart.
Across almost all organizations, we are seeing multitudes of examples where data coupled with advanced analytics can transform key organizational business processes, such as:
Procurement: Identify which suppliers are most cost-effective in delivering products on-time and without damages.
Product Development: Uncover product usage insights to speed product development processes and improve new product launch effectiveness.
Manufacturing: Flag machinery and process variances that might be indicators of quality problems.
Marketing: Identify which marketing promotions and campaigns are most effective in driving customer traffic, engagement, and sales, or use attribution analysis to optimize marketing mixes given marketing goals, customer behaviors, and channel behaviors.
Pricing and Yield Management: Optimize prices for “perishable” goods such as groceries, airline seats, concert tickets and fashion merchandise.
Merchandising: Optimize merchandise markdown based on current buying patterns, inventory levels, and product interest insights gleaned from social media data.
Sales: Optimize sales resource assignments, product mix, commissions modeling, and account assignments.
Store Operations: Optimize inventory levels given predicted buying patterns coupled with local demographic, weather, and events data.
Human Resources: Identify the characteristics and behaviors of your most successful and effective employees.
The Big Data Business Model Maturity Index
Customers often ask me:
How far can big data take us from a business perspective? What could the ultimate endpoint look like?
How do I compare to others with respect to my organization's adoption of big data as a business enabler?
How far can I push big data to power—or even transform—my value creation processes?
To help address these types of questions, I've created the Big Data Business Model Maturity Index. This index provides a benchmark against which organizations can measure themselves as they look at what big data-enabled opportunities may lay ahead. Organizations can use this index to:
Get an idea of where they stand with respect to exploiting big data and advanced analytics to power their value creation processes and business models (their current state).
Identify where they want to be in the future (their desired state).
Organizations are moving at different paces with respect to how they are adopting big data and advanced analytics to create competitive advantages for themselves. Some organizations are moving very cautiously because they are unclear where and how to start, and which of the bevy of new technology innovations they need to deploy in order to start their big data journeys. Others are moving at a more aggressive pace to integrate big data and advanced analytics into their existing business processes in order to improve their organizational decision-making capabilities.
However, a select few are looking well beyond just improving their existing business processes with big data. These organizations are aggressively looking to identify and exploit new data monetization opportunities. That is, they are seeking out business opportunities where they can either sell their data (coupled with analytic insights) to others, integrate advanced analytics into their products to create “intelligent” products, or leverage the insights from big data to transform their customer relationships and customer experience.
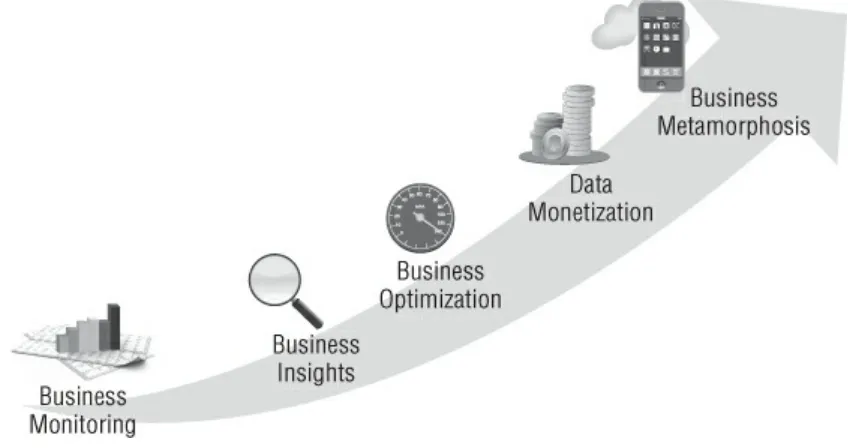
on how far you can push the big data opportunity within your organization.
Figure 1.1 Big Data Business Model Maturity Index
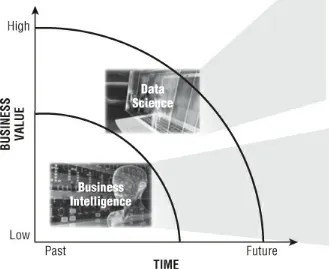
Business Monitoring
In the Business Monitoring phase, you deploy Business Intelligence (BI) and traditional data warehouse capabilities to monitor, or report on, on-going business performance. Sometimes called
business performance management, business monitoring uses basic analytics to flag under- or over-performing areas of the business, and automates sending alerts with pertinent information to concerned parties whenever such a situation occurs. The Business Monitoring phase leverages the following basic analytics to identify areas of the business requiring more investigation:
Trending, such as time series, moving averages, or seasonality
Comparisons to previous periods (weeks, months, etc.), events, or campaigns (for example, a back-to-school campaign)
Benchmarks against previous periods, previous campaigns, and industry benchmarks
Indices such as brand development, customer satisfaction, product performance, and financials Shares, such as market share, share of voice, and share of wallet
The Business Monitoring phase is a great starting point for your big data journey as you have already gone through the process—via your data warehousing and BI investments—of identifying your key business processes and capturing the KPIs, dimensions, metrics, reports, and dashboards that support those key business processes.
Business Insights
uncover material and relevant insights that are buried in the detailed data. The application can then make specific, actionable recommendations, calling out an observation on a particular area of the business where specific actions can be taken to improve business performance. One client called this phase the “Tell me what I need to know” phase. Examples include:
In marketing, uncovering observations that certain in-flight campaign activities or marketing treatments are more effective than others, coupled with specific recommendations as to how much marketing spend to shift to the more effective activities.
In manufacturing, uncovering observations that certain production machines are operating outside of the bounds of their control charts (for example, upper limits or lower limits), coupled with a prioritized maintenance schedule with replacement part recommendations for each problem machine.
In customer support, uncovering observations that certain gold card members' purchase and engagement activities have dropped below a certain threshold of normal activity, with a recommendation to e-mail them a discount coupon.
The following steps will transition your organization from the business monitoring to the business insights stage.
1. Invest the time to understand how users are using existing reports and dashboards to identify problems and opportunities. Check for situations where users are printing reports and making notes to the side of the reports. Find situations where users are downloading the reports into Excel or Access and capture what these users are doing with the data once they have it downloaded. Understanding what your users are doing with the existing reports and downloads is “gold” in identifying the areas where advanced analytics and real-time data can impact the business.
2. Understand how downstream constituents—those users that are the consumers of the analysis being done in Step 1—are using and making decisions based on the analysis. Ask, “What are these constituents doing with the results of the analysis? What actions are they trying to take? What decisions are they trying to make given the results of the analysis?”
3. Launch a prototype or pilot project that provides the opportunity to integrate detailed transactional data and new unstructured data sources with real-time data feeds and predictive analytics to automatically uncover potential problems and opportunities buried in the data (Insights), and generate actionable recommendations.
Business Optimization
The Business Optimization phase is the level of business maturity where organizations use embedded analytics to automatically optimize parts of their business operations. To many organizations, this is the Holy Grail where they can turn over certain parts of their business operations to analytic-powered applications that automatically optimize the selected business activities. Business optimization examples include:
Marketing spend allocation based on in-flight campaign or promotion performance
with local demographic, weather, and events data
Product pricing based on current buying patterns, inventory levels, and product interest insights gleaned from social media data
Algorithmic trading in financial services
The following steps will transition your organization from the Business Insights phase to the Business Optimization phase:
1. The Business Insights phase resulted in a list of areas where you are already developing and delivering recommendations. Use this as the starting point in assembling the list of areas that are candidates for optimization. Evaluate these business insights recommendations based on the business or financial impact, feasibility of success, and their relative recommendation performance or effectiveness.
2. For each of the optimization candidates, identify the supporting business questions and decision-making process (the analytic process). You will also need to identify the required data sources and timing/latency of data feeds (depending on decision-making frequency and latency), the analytic modeling requirements, and the operational system and user experience requirements.
3. Finally, conduct “Proof of Value” or develop a prototype of your top optimization candidates to verify the business case, the financials (return on investment—ROI), and analytics performance.
You should also consider the creation of a formal analytics governance process that enables human subject matter experts to audit and evaluate the effectiveness and relevance of the resulting optimization models on a regular basis. As any good data scientist will tell you, the minute you build your analytic model it is obsolete due to changes in the real-world environment around it.
Data Monetization
The Data Monetization phase is where organizations are looking to leverage big data for net new revenue opportunities. While not an exhaustive list, this includes initiatives related to:
Packaging customer, product, and marketing insights for sale to other organizations Integrating analytics directly into their products to create “intelligent” products
Leveraging actionable insights and personalized recommendations based on customer behaviors and tendencies to upscale their customer relationships and dramatically rethink their “customer experience”
An example of the first type of initiative could be a smartphone app where data and insights about customer behaviors, product performance, and market trends are sold to marketers and manufacturers. For example, MapMyRun (www.MapMyRun.com) could package the customer usage insights from their smartphone application with audience and product insights for sale to sports apparel manufacturers, sporting goods retailers, insurance companies, and healthcare providers.
An example of the second type of initiative could be companies that leverage new big data sources (sensor data or user click/selection behaviors) with advanced analytics to create “intelligent” products, such as:
Televisions and DVRs that learn what types of shows and movies you like and use the data to search across the different cable channels to find and automatically record similar shows for you. Ovens that learn how you like certain foods cooked and uses the data to cook them in that manner automatically, and also include recommendations for other foods and cooking methods that others like you enjoy.
An example of the third type of initiative could be companies that leverage actionable insights and recommendations to “up-level” their customer relationships and dramatically rethink their customer's experience, such as:
Small, medium business (SMB) merchant dashboards from online marketplaces that compare current and in-bound inventory levels with customer buying patterns to make merchandising and pricing recommendations
Investor dashboards that assess investment goals, current income levels, and current financial portfolios to make specific asset allocation recommendations
The following steps will be useful in helping transition to the Data Monetization phase.
1. Identify your target customers and their desired solutions. Focus on identifying solutions that improve customers' business performance and help them make money. As part of that process, you will need to detail out the personas of the economic decision-makers. Invest time shadowing these decision-makers to understand what decisions they are trying to make, how frequently, and in what situations. Spend the time to gather details of what they are trying to accomplish, versus focusing on trying to understand what they are doing.
2. Inventory your current data assets. Capture what data you currently have. Also, identify what data you could have with a little more effort. This will require you to look at how the source data is being captured, to explore additional instrumentation strategies to capture even more data, and explore external sources of data that, when combined with your internal data, yields new insights on your customers, products, operations, and markets.
3. Determine the analytics, data enrichment, and data transformation processes necessary to transform your data assets into your targeted customers' desired solutions. This should include identifying:
The business questions and business decisions that your targeted personas are trying to ask and answer
The advanced analytics (algorithms, models), data augmentation, transformation, and enrichment processes necessary to create solutions that address your targeted persona's business questions and business decisions
Your targeted persona's user experience requirements, including their existing work environments and how you can leverage new mobile and data visualization capabilities to improve that user experience
Business Metamorphosis
example:
Energy companies moving into the home energy optimization business by recommending when to replace appliances (based on predictive maintenance) and even recommending which brands to buy based on the performance of different appliances compared to customer usage patterns, local weather, and environmental conditions, such as local water conditions and energy costs.
Farm equipment manufacturers transforming into farming optimization businesses by
understanding crop performance given weather and soil conditions, and making seed, fertilizer, pesticide, and irrigation recommendations.
Retailers moving into the shopping optimization business by recommending specific products given a customer's current buying patterns compared with others like them, including
recommendations for products that may not even reside within their stores.
Airlines moving into the “Travel Delight” business of not only offering discounts on air travel based on customers' travel behaviors and preferences, but also proactively finding and
recommending deals on hotels, rental cars, limos, sporting or musical events, and local sites, shows, and shopping in the areas that they are visiting.
In order to make the move into the Business Metamorphosis phase, organizations need to think about moving away from a product-centric business model to a more platform- or ecosystem-centric business model.
Let's drill into this phase by starting with a history lesson. The North American video game console market was in a massive recession in 1985. Revenues that had peaked at $3.2 billion in 1983, fell to $100 million by 1985—a drop of almost 97 percent. The crash almost destroyed the then-fledgling industry and led to the bankruptcy of several companies, including Atari. Many business analysts doubted the long-term viability of the video game console industry.
There were several reasons for the crash. First, the hardware manufacturers had lost exclusive control of their platforms' supply of games, and consequently lost the ability to ensure that the toy stores were never overstocked with products. But the main culprit was the saturation of the market with low-quality games. Poor quality games, such as Chase the Chuck Wagon (about dogs eating food, bankrolled by the dog food company Purina), drove customers away from the industry.
The industry was revitalized in 1987 with the success of the Nintendo Entertainment System (NES). To ensure ecosystem success, Nintendo instituted strict measures to ensure high-quality games through licensing restrictions, maintained strict control of industry-wide game inventory, and implemented a security lockout system that only allowed certified games to work on the Nintendo platform. In the process, Nintendo ensured that third-party developers had a ready and profitable market.
As organizations contemplate the potential of big data to transform their business models, they need to start by understanding how they can leverage big data and the resulting analytic insights to transform the organization from a product-centric business model into a platform-centric business model. Much like the Nintendo lesson, you accomplish this by creating a marketplace that enables others—like app developers, partners, VARs, and third party solution providers—to make money off of your platform.
information, the company could recommend when consumers should run their high energy appliances, like washers and dryers, to minimize energy costs. The energy company could go one step further and offer a service that automatically manages when the washer, dryer, and other high-energy appliances run—such as running the washer and dryer at 3:00 a.m. when energy prices are lower.
With all of the usage information, the company is also in a good position to predict when certain appliances might need maintenance (for example, monitoring their usage patterns using Six Sigma control charts to flag out-of-bounds performance problems). The energy company could make preventive maintenance recommendations to the homeowner, and even include the names of three to four local service dealers and their respective Yelp ratings.
But wait, there's more! With all of the product performance and maintenance data, the energy company is also in an ideal position to recommend which appliances are the best given the customer's usage patterns and local energy costs. They could become the Consumer Reports for appliances and other home and business equipment by recommending which brands to buy based on the performance of different appliances as compared to their customers' usage patterns, local weather, environmental conditions, and energy costs.
Finally, the energy company could package all of the product performance data and associated maintenance insights and sell the data and analytic insights back to the manufacturers who might want to know how their products perform within certain usage scenarios and versus key competitors.
In this scenario, there are more application and service opportunities than any single vendor can reasonably supply. That opens the door to transform to a platform-centric business model that creates a platform or ecosystem that enables third party developers to deliver products and services on that platform. And, of course, this puts the platform provider in a position to take a small piece of the “action” in the process, such as subscription fees, rental fees, transaction fees, and referral fees.
Much like the lessons of Nintendo with their third-party video games, and Apple and Google with their respective apps stores, creating such a platform not only benefits your customers who are getting access to a wider variety of high-value apps and services in a more timely manner, it also benefits the platform provider by creating a high level of customer dependency on your platform (for example, by increasing the switching costs).
Companies that try to do all of this on their own will eventually falter because they'll struggle to keep up with the speed and innovation of smaller, hungrier organizations that can spot and act on a market opportunity more quickly. Instead of trying to compete with the smaller, hungrier companies, enable such companies by giving them a platform on which they can quickly and profitability build, market, and support their apps and solutions.
So how does your company make the business metamorphosis from a product to a platform or ecosystem company? Three steps are typically involved:
1. Invest the time researching and shadowing your customers to understand their desired solutions. Focus on what the customer is trying to accomplish, not what they are doing. Think more broadly about their holistic needs, such as:
Feeding the family, not just cooking, buying groceries, and going to restaurants
Personal transportation, not just buying or leasing cars, scheduling maintenance, and filling the car with gas
2. Understand the potential ecosystem players (e.g., developers) and how they could make money off of your platform. Meet with potential ecosystem players to brainstorm and prioritize their different data monetization opportunities to:
Clarify, validate, and flush out the ecosystem players' business case
Identify the platform requirements that allow the ecosystem players to easily instrument, capture, analyze, and act on insights about their customers' usage patterns and product performance
3. As the platform provider, focus product development, marketing, and partnering efforts on ensuring that the platform:
Is easy to develop on and seamlessly supports app developer marketing, sales, service, and support (for example, app fixes, new product releases, addition of new services)
Is scalable and reliable with respect to availability, reliability, extensibility, data storage, and analytic processing power
Has all the tools, data processing, analytic capabilities (such as recommendation engines), and mobile capabilities to support modern application development
Simplifies how qualified third parties make money with respect to contracts, terms and conditions, and payments and collections
Enables developers to easily capture and analyze customer usage and product performance data in order to improve their customers' user experience and help the developers optimize their business operations (for example, pricing, promotion, and inventory management)
This step includes creating user experience mockups and prototypes so that you can understand
exactly how successfully and seamlessly customers are able to interact with the platform (for example, which interface processes cause users the most problems, or where do users spend an unusual amount of time). Mockups are ideal for web- or smartphone-based applications, but don't be afraid to experiment with different interfaces that have different sets of test customers to improve the user experience. Companies like Facebook have used live experimentation to iterate quickly in improving their user experience. Heavily instrument or tag every engagement point of the user experience so that you can see the usage patterns and potential bottlenecks and points of frustration that the users might have in interacting with the interface.
As your organization advances up the big data business model maturity index, you will see three key cultural or organizational changes:
Data is becoming a corporate asset to exploit, not a cost of business to be minimized. Your organization starts to realize that data has value, and the more data you have at the most granular levels of detail, the more insights you will be able to tease out of the data.
Analytics and the supporting analytic algorithms and analytic models are becoming
organizational intellectual property that need to be managed, nurtured, and sometimes even protected legally. The models that profile, segment, and acquire your customers, the models that you measure campaign or healthcare treatment effectiveness, the models that you use to predict equipment maintenance—all of these are potential differentiators in the marketplace that can be exploited for differentiated business value and may need to be legally protected.
trusting what the data is telling them about their business. The need to rely solely on the
organization's HiPPO (Highest Paid Person's Opinion) gives way to an organizational culture that values making decisions based on what the data and the analytics are showing.
Big Data Business Model Maturity
Observations
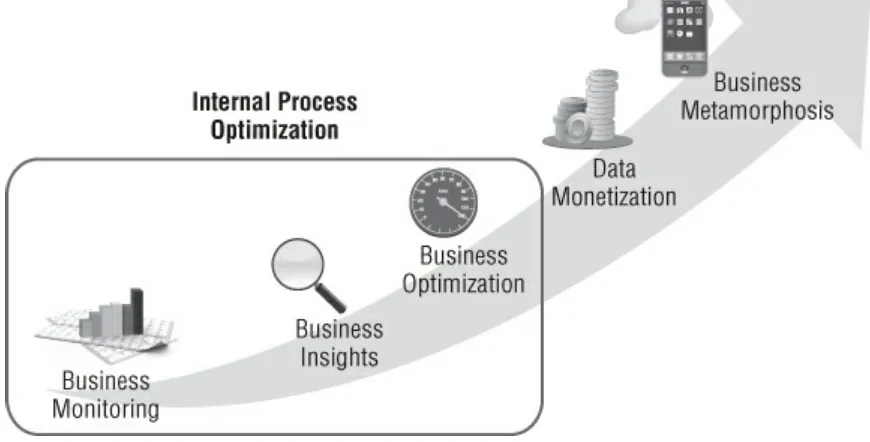
The first observation is that the first three phases of the Big Data Business Model Maturity Index are internally focused—optimizing an organization's internal business processes, as highlighted in Figure 1.2. This part of the maturity index leverages an organization's data warehouse and business intelligence investments, especially the key performance indicators, data transformation algorithms, data models, and reports and dashboards around the organization's key business processes. There are four big data capabilities that organizations can leverage to enhance their existing internal business processes as part of the maturity process:
Mine all the transactional data at the lowest levels of detail much of which is not being analyzed today due to data warehousing costs. We call this the organizational “dark” data.
Integrate unstructured data with detailed structured (transactional) data to provide new metrics and new dimensions against which to monitor and optimize key business processes.
Leverage real-time (or low-latency) data feeds to accelerate the organization's ability to identify and act upon business and market opportunities in a timely manner.
Integrate predictive analytics into your key business processes to uncover insights buried in the massive volumes of detailed structured and unstructured data. (Note: having business users slice and dice the data to uncover insights worked fine when dealing with gigabytes of data, but
doesn't work when dealing with terabytes and petabytes of data.)
Figure 1.2 Big Data Business Model Maturity Index: Internal Process Optimization
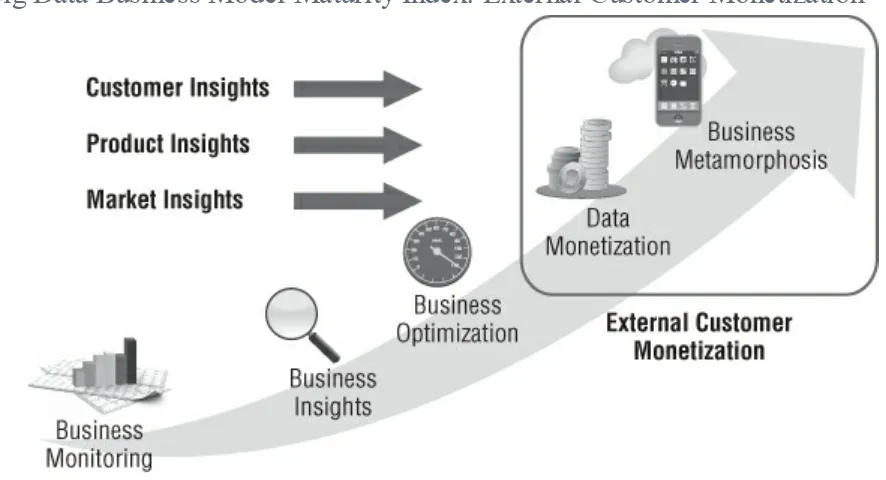
1.3. This is the part of the big data journey that catches most organizations' attention; the opportunity to leverage the insights gathered through the optimization of their internal business processes to create new monetization opportunities. We call this area of the Big Data Business Model Maturity Index the four Ms of big data: Make Me More Money!
Figure 1.3 Big Data Business Model Maturity Index: External Customer Monetization
Summary
This chapter introduced you to the business drivers behind the big data movement. I talked about the bevy of new data sources available covering structured, semi-structured (for example, log files generated by sensors), and unstructured (e.g., text documents, social media postings, physician comments, service logs, consumer comments) data. I also discussed the growing sources of publicly available data that reside outside the four walls of an organization.
This chapter also briefly covered why traditional data warehousing and business intelligence technologies are struggling with the data volumes, the wide variety of new unstructured data sources and the high-velocity data that shrinks the latency between when a data event occurs and when that data is available for analysis and actions.
Probably most importantly, you learned how leading organizations are leveraging big data to transform their businesses—moving from a retrospective view of the business with partial chunks of data in batch to monitor their business performance, to an environment that integrates predictive analytics with real-time data feeds that leverage all available data in order to optimize the business.
1 “The 12 greatest entrepreneurs of our time” Fortune/CNN Money
Chapter 2
Big Data History Lesson
Chapter 1 hinted at how retail point-of-sale (POS) scanner data caused a big data revolution that transformed the Consumer Package Goods (CPG) and retail industries in the late 1980s and 1990s. Let's spend a bit more time on that event, as there are some valuable lessons to be learned that apply to today's big data revolution.
Consumer Package Goods and Retail Industry
Pre-1988
In the 1970s and early 1980s, CPG manufacturers such as Procter & Gamble, Unilever, Colgate-Palmolive, Kraft, and General Mills, to name but a few, and large grocery, drug, and mass merchandise retailers made their marketing decisions based on bi-monthly Nielson store audit data. That is, Nielsen would send people into a sample of stores (in only about 12 cities across the United States) to conduct physical audits—to count how much product was on the shelf, the price of the product, how much linear footage the product had across the front of the shelf, product sales within that store, and other data. Nielsen would aggregate this information by product category in order to calculate market share by volume and revenue, share of shelf space, etc. The results of the audits were then delivered every two months to the retailers and CPG manufacturers, usually in booklet format. CPG manufacturers could also request the data in tape format, but the data volumes were easily in the megabyte range.
So a company like Procter & Gamble would use this data for their Crest brand toothpaste, combined with their own internal orders and shipments data, to compare their sales to other toothpaste brands in the dentifrice product category. The Crest brand team would use this data to plan, execute, and measure their marketing strategies including promotional spending, new product introductions, and pricing decisions.
Note
Not only was Crest's data and analysis only available bimonthly, but the audit books were delivered several weeks after the close of the audit period due to the data cleansing, alignment, and analytics that Nielsen had to do to ensure accuracy and consistency of the data. Needless to say, it could be two to three months after a marketing campaign ended before the manufacturer had any idea how successful their campaign had been in driving incremental revenue, unit sales, and market share increases.
combined retail POS scanner systems with barcodes (universal product codes—UPC) to revolutionize the CPG-to-retail value chain process. Data volumes jumped from megabytes to gigabytes and soon to terabytes of retail sales data. Existing mainframe-based executive information systems (EIS) broke under the data volumes, which necessitated a next generation of data processing capabilities as represented by client-server architectures, and data platforms such as Britton-Lee, Red Brick, Teradata, Sybase IQ, and Informix. This also saw the birth of the Business Intelligence (BI) software industry (e.g., Brio, Cognos, Microstrategy, Business Objects), as many early BI companies can trace their origins to the late 1980s Procter & Gamble-led “decision support” projects.
So data volumes jumped dramatically, breaking existing technology platforms and necessitating a next generation of data platforms and analytic capabilities. Sound familiar? But the most interesting thing wasn't the jump in data volumes that necessitated a new generation of data processing and analytic capabilities. The most interesting and relevant aspect of the scanner POS revolution was how companies like Procter & Gamble, Frito Lay, Tesco, and Walmart were able to leverage this new source of data and new technology innovations to create completely new business applications— business applications that previously were impossible to create. Much like what was discussed in Chapter 1 about moving to the Business Insights and Business Optimization phases of the Big Data Business Model Maturity Index, these new business applications leveraged the detailed POS data and new data management and analytic innovations to create new application categories such as:
Demand-based Forecasting, where CPG manufacturers could create and update their product forecasts in near real-time based on what products were selling in the retail outlets for that current week. This was a major breakthrough for companies that sold products that were considered staples—products with relatively consistent consumption, such as toilet paper, toothpaste, soap, detergent, and most food products.
Supply Chain Optimization, where detailed product sales data at the UPC level, combined with up-to-date inventory data (at each distribution center, at each store, and on order), allowed
retailers and CPG manufacturers to drive excess inventory, holding, and distribution costs out of the supply chain. The savings in reduced capital required to maintain the supply chain was
significant in itself, not to mention savings in other areas such as spoilage, shrinkage and unnecessary labor, distribution center and transportation costs.
Trade Promotion Effectiveness, where CPG manufacturers could more quickly quantify what trade promotions were working most effectively with which retailers, and do this analysis in a more timely manner to actually impact current trade promotion programs.
Market Basket Analysis, where retailers could gain intimate knowledge of what products sold together to what customers at what times of year. This insight could be used to not only change how retailers would lay out their stores, but also put the retailer in a superior position to inform the CPG manufacturers of the optimal cross-product category promotional opportunities.
Category Management was an entirely new concept championed by leading CPG
retailers and CPG manufacturers could collaborate to drive overall category sales and profitability. The “category champion,” which was the title or role given to the CPG
manufacturer, was responsible for the management of the retailer's in-store product category including pricing, replenishment, promotions, and inventory.
Price and Yield Optimization, where organizations are determining optimal product prices—at the individual store and seasonality levels—by combining real-time sales data with historical sales (demand), product sales seasonality trends and available inventory (on-hand and on-order). For example, retailers know that they can charge more for the same products in high tourist areas (e.g., Sanibel Island) than they can charge in normal residential areas due to the degree of price insensitivity of vacationing shoppers.
Markdown Management, where retailers integrated POS historical sales data for seasonal or short-lived fashion products to intelligently reduce product prices based on current inventory data and product demand trends to optimize the product or merchandise markdown management process. For example, grocery, mass merchandiser, and drug chain retail outlets used the POS data with advanced analytics to decide when and how much to mark down Easter, Christmas, Valentine's Day, and other holiday-specific items. And mass merchandisers and department stores used the POS data with advanced analytics to decide when and how much to mark down seasonal items such as swimsuits, parkas, winter boots, and fashion items.
Customer Loyalty Programs were to me the biggest innovation. Retailers suddenly had the opportunity to introduce customer loyalty cards that could be scanned at the time of product purchase in exchange for product discounts and reward programs. Just check your billfold or purse to see how many of these programs you personally belong to. (For me that would include Starbucks, Safeway, Walgreens, Sports Authority, and Foot Locker, just to name a few.) This allowed retailers to tie specific product and market basket purchases to the demographics of their individual shoppers. The potential profiling, targeting, and segmentation possibilities were almost endless, and provided a potentially rich source of insights that retailers could use to better market, sell and service to their most important customers.
Figure 2.1 summarizes the key takeaways with respect to how point-of-sale scanner data drove the CPG-Retail industry transformation.
The combination of new data sources and technology innovations also led to new data monetization opportunities (the Data Monetization phase of our Big Data Business Model Maturity Index), such as Walmart's Retail Link that provided detailed product sales information to Walmart's CPG manufacturing and distribution partners. The creation of a platform or ecosystem from which partners and other value-added developers can deliver new services, capabilities and applications is the start of moving into the Business Metamorphosis phase discussed in Chapter 1.
Ultimately, this more detailed, high-velocity data changed the balance of power in the CPG-Retail industry. Prior to the advent of POS scanner data, CPG manufacturers leveraged their superior knowledge of their customers' buying behaviors (painstakingly gathered through countless focus groups, surveys, and primary research) to dictate sales and payment terms to the retailers. However, courtesy of the POS scanner data and resulting customer and product insights, the retailers suddenly knew more about their customers' buying behaviors, price and promotional sensitivities, and product and market basket preferences. Retailers were able to leverage these superior customer and product insights to dictate product pricing, promotional, and delivery terms to the CPG manufacturers.
Lessons Learned and Applicability to Today's
Big Data Movement
The introduction of retail scanner POS systems created new sources of data that required new technologies to manage the data, and new analytic software to analyze the data. But the real competitive advantages came from organizations that exploited the new sources of data and new technology innovations to derive—or drive—new sources of business differentiation, competitive advantage, and monetization.
How does the POS scanner data history lesson apply to the big data movement today? First, new massive volumes of high-velocity structured and unstructured data—both inside and outside of the organization—are breaking traditional data management tools and platforms, and data and analytic modeling techniques. Data sources such as web logs, social media posts, doctor's notes, service comments, research papers, and machine and sensor-generated data are creating data volumes that have some leading organizations already working with petabytes of data, and planning for the inevitable introduction of zettabytes of data. Traditional data management and data warehousing platforms were never designed for the volume, velocity, or complexity of these types of data sources.
Next, new tools must be developed to exploit this tsunami of new data sources. Digital media companies such as Google, Yahoo!, and Facebook—companies whose primary value proposition is built around managing huge data volumes and consequently monetizing that data—have had to develop new technologies to manage and analyze this data, creating technologies such as Hadoop, MapReduce, Pig, Hive, and HBase.
Programs) gained competitive advantage from new data sources and new technology innovations, companies today should be focused on determining where data and technology innovation can rewire their existing value creation processes to create new value for their customers, and uncover new sources of revenue and profits for their organizations.
Summary
This chapter covered the history lesson from the late 1980s, where retail POS scanner data created an earlier “big data” revolution. POS scanner data volumes quickly jumped from megabytes to gigabytes and ultimately to terabytes of data, replacing the bimonthly store audit data that had previously been used to make marketing, promotional, product, pricing, and placement decisions.
You reviewed how the volume, diversity, and velocity of this POS data broke existing data management and analytical technologies. EIS analytic software that ran on mainframes could not handle the volume of data, which gave birth to new data processing technologies such as specialized data management platforms (Red Brick, Teradata, Britton Lee, Sybase IQ) and new analytic software packages (Brio, Cognos, Microstrategy, Business Objects).
Chapter 3
Business Impact of Big Data
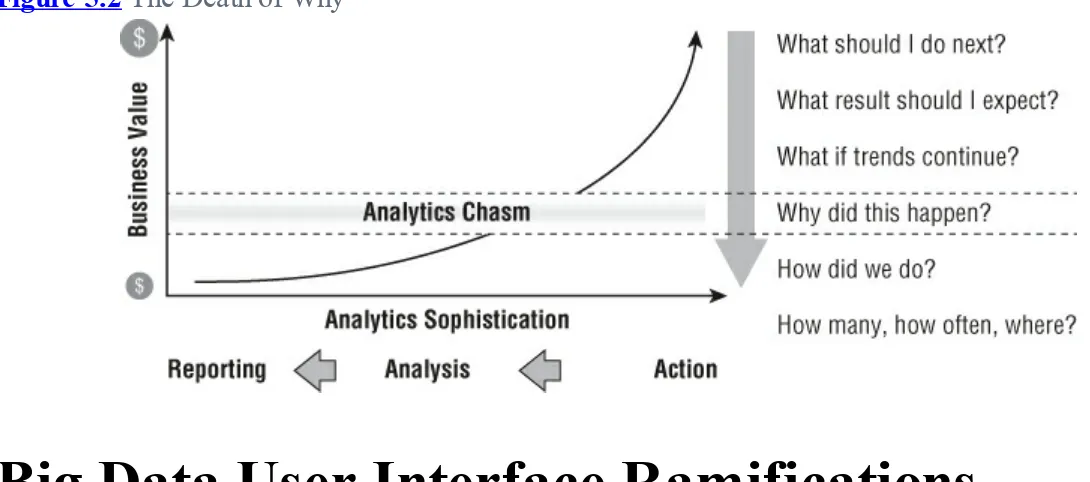
Organizations are starting to realize that big data is more about business transformation than IT transformation. Big data is allowing companies to answer questions they could not previously answer, and make more timely decisions at a finer level of fidelity than before, yielding new insights that can deliver business differentiation and new operational efficiencies. Let's take a look at an example of how big data is transforming how we look at business.
For decades, leading organizations have been exploiting new data sources, plus new technologies, for business differentiation and competitive advantage. And for the most part, the questions that the business users are trying to ask, and answer, with these data sources and new technologies really
The more I thought about these “simple” questions, the more I realized just how “not simple” these questions really were. Because of the new insights available from new big data sources, companies are able to take these types of “simple” questions to the next level of sophistication and understanding.
Let's look at the most valuable customer question. When you ask who your most valuable customers are, do you mean largest by revenue (which is how many companies today still define their most valuable customers)? Or do you mean the most profitable customers, contemplating more aspects of the customer engagement including marketing and sales costs, cost to service, returns, and payment history (which is how some of the more advanced companies think today)? Or by adding social media into the mix, do you now mean your most influential customers and the financial value associated with their circle of friends?
Companies are learning that their most profitable customers may not actually be their most valuable customers because of the net influencer or advocacy effect. Advocates can have significant influence and persuasive effect on a larger community of customers, and the profitability of the “baskets” associated with that community of customers. Same with the most important product question, which retailers have understood for quite a while (think loss leaders like milk that drive store traffic even though they don't drive much in the form of profits), and consumer goods manufacturers understand as well (think category strategies and the use of flanking products to protect their premium-priced core products).
those customers, products, and campaigns make to the business. It is the basis for a more engaging business discussion about what data sources could be critical in defining “valuable” and what analytic models could be used to quantify “valuable.” It's the basis for a wonderful conversation that you can have with your business users about defining those valuable, important, and successful words in light of what big data and advanced analytics can bring to the table.
Big Data Impacts: The Questions Business
Users Can Answer
Big data has changed the nuances for defining and quantifying terms such as valuable, important, and successful. It is these nuances that fuel the insights that are the source of competitive advantage and business differentiation. New big data sources, plus new advanced analytic capabilities, enable higher fidelity answers to these questions, and provide a more complete understanding of your customers, products, and operations that can drive business impact across various business functions, such as:
Merchandising to identify which marketing promotions and campaigns are the most effective in driving store or site traffic and sales.
Marketing to optimize prices for perishable goods such as groceries, airline seats, and fashion merchandise.
Sales to optimize the allocation of scarce sales resources against the best sales opportunities and most important or highest potential accounts.
Procurement to identify which suppliers are most cost-effective in delivering high-quality products in a predictable and timely manner.
Manufacturing to flag machine performance and process variances that might be indicators of manufacturing, processing, or quality problems.
Human Resources to identify the characteristics and behaviors of your most successful and effective employees.
Managing Using the Right Metrics
Since baseball is one of my loves in life, and in honor of the enlightening book, Moneyball: The Art of Winning an Unfair Game, by Michael Lewis (Norton, 2004), I thought it was only appropriate to discuss how the pursuit and identification of the right metrics has not only changed how the game of baseball is managed, but has the same potential impact on how you manage your business.
costly era of free agency.
As a result, the A's enjoyed a significant cost advantage in what they were paying for wins versus a team like the Yankees. The comparison is shown in Figure 3.1.
Figure 3.1 Payroll cost per win: Athletics versus Yankees
Unfortunately for Billy Beane and the Oakland A's, other teams (most notably the Boston Red Sox) copied this model and reduced the competitive advantage that the A's briefly enjoyed. But that's the nature of a competitive business isn't it, whether it's in sports, retail, banking, entertainment, telecommunications, or healthcare.
So how does one survive in a world where competitive advantage via analytics can be so short-lived? By constantly innovating, thinking differently, and looking at new sources of data and analytic tools to bring to light those significant, material, and actionable insights that can differentiate your business from that of your competitors.
One of the challenges with metrics is that eventually folks learn how to game the metrics for their own advantage. Sticking with our baseball scenario, let's take the Fielding Percentage metric as an example. The Fielding Percentage metric is calculated as the total number of plays (chances minus errors) divided by the number of total chances. Some players have learned that one of the ways to improve their Fielding Percentage is to stop trying to field balls that are outside of their fielding comfort zone. If you don't try hard for the ball, there can't be an error assessed. While that might be good for the individual's performance numbers, it is obviously less than ideal for the team who wants all of their players trying to make plays in the field. Let's see how that works.
Let's say that an outfielder has 1,000 fielding chances, and makes 20 errors out of those 1,000 fielding chances for a Fielding Percentage of 98 percent (see Figure 3.2). Now, if the fielder doesn't try to field the 100 hardest opportunities (resulting in only 900 Fielding Chances), he will likely cut down significantly on the number of errors (let's say, eliminating 10 errors) resulting in an increased Fielding Percentage of 98.9 percent.
While the 0.9 basis-point difference (98.9 minus 98.0) between the two efforts may not seem significant, suffice it to say that the difference between the #1 center fielder in Major League Baseball in 2011 and the #11 center fielder was only 0.9 basis points. The difference probably means millions of dollars to their playing contract.
So the bottom line is that some players have figured out that they will perform better by only trying to field those opportunities within their comfort zone. Not the sort of behavior that leads to very many World Series appearances.
So how does the world of big data change this measure? Baseball stadiums have installed video cameras throughout the stadium to get a better idea as to actual game dynamics. One of the benefits of these cameras is a new set of metrics that are better predictors of players' performance.
For example, video cameras now can measure how much many feet a particular fielder can cover within a certain period of time in fielding their position. Ultimately, this will lead to the creation of an Effective Fielding Range metric which measures how much of the playing field the fielder can cover, and how effectively they cover the playing field (see Figure 3.3). This metric will allow baseball management to value players differently because Effective Fielding Range is a much better predictor of fielding performance than the traditional Fielding Percentage.
As illustrated in the figure, the Center Fielder is very efficient in covering the outfield going left, right, or forward (indicated by the green coverage area), but is less efficient going backwards (indicated by the yellow and red coverage areas).
Much like the world of baseball, organizations must be constantly vigilant in search of metrics that are better predictors of business performance. The new data sources and analytic capabilities enabled by big data hold huge potential to be the first mover in uncovering those significant, measurable, and actionable insights that can lead to competitive advantage—on the baseball field or in the corporate battlefields.
Data Monetization Opportunities
Data monetization is certainly the holy grail of the big data discussion: How do I leverage my vast wealth of customer, product, and operational insights to provide new revenue-generating products and services, enhance product performance and the product experience, and create a more compelling and “sticky” customer relationship?
But how does one even start thinking about this data monetization discussion? Let me take a data monetization example from the digital media world and present a process that other industries can use to uncover and capitalize on potential data monetization opportunities.
Digital Media Data Monetization Example
These companies work with bytes to create services, unlike most other companies who work with atoms to build physical products like shoes, tractors, houses, and burrito bowls with double chicken and guacamole.
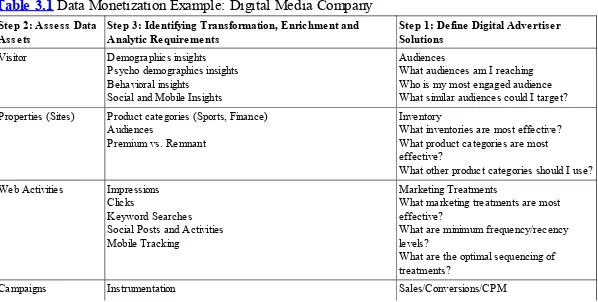
So what process do these digital media companies go through to identify how to monetize their data assets? The data monetization process starts with two key understandings:
1. Who are my target customers (targeted personas) and what business solutions do they need for which they are willing to pay?
2. What data assets do I have (or could I have)?
Once you have a solid understanding of these two questions, then you are in a position to start the data monetization process.
Digital Media Data Assets and UnderstandingTarget
Users
First, digital media companies need to identify and really (and I mean really!) understand their target customers—that is, who is making the million dollar marketing and campaign decisions, and what information and insights do they need to make those decisions? Digital media companies target the following three customers or personas: Media Planners and Buyers, Campaign Managers, and Digital Media Executives. These digital media decision-makers buy the following “solutions”:
Audiences, such as soccer moms, country squires, gray power, and weekend warriors
Inventory (like sports, finance, news, and entertainment) available on certain days and times of days
Results or measures, such as Cost per Thousands (CPM) of impressions, Cost Per Acquisition (CPA), product sales, or conversions (where conversions could include getting a visitor to share their e-mail address, request a quote, or schedule a reservation)
For each of these targeted personas, the digital media company needs to understand what questions they are trying to answer, what decisions they are trying to make, under what circumstances they are making these decisions, and within what sort of environment or user experience they are typically working when they have to answer their questions and make their decisions.
Next, digital media companies assess the breadth, depth, and quality of their data assets, including: Visitors and their associated demographic, psycho-demographic, and behavioral insights
Properties and the type of content and advertising real estate (e.g., full banner, pop-under,
skyscraper, leaderboard, half-page) that is provided on properties (like Yahoo! Finance, Yahoo! Sports, or Yahoo! Entertainment)
Activities that visitors perform on those properties (for example, they viewed a display
impression, moused over a display ad, clicked a display ad, entered a keyword search) including how often, how recent, and in what sequence
This data assessment process should also include what additional data could be captured through data acquisition, as well as through more robust instrumentation and experimentation techniques.