Dewi and Cynthia: Aggressiveness Tax in Indonesia
Aggressiveness Tax In Indonesia
Sofia Prima Dewi and Cynthia
Faculty of Economics, Tarumanagara University, Jakarta Email: [email protected]
Abstract: The purpose of this study was to obtain empirical evidence about the influence of liquidity, corporate social responsibility, earnings management, and firm size against tax aggressiveness on manufacturing companies listed consistently in the Indonesia Stock Exchange during the year 2013-2015. This study used a sample of sixty-four manufacturing companies. This study uses a software program Eviews for data processing. These results indicate that liquidity has an influence on tax aggressiveness, while corporate social responsibility, earnings management, and firm size have no influence on tax aggressiveness.
Keywords: tax aggressiveness, liquidity, corporate social responsibility, earnings management, firm size
Abstrak: Tujuan penelitian ini adalah untuk mendapatkan bukti empiris mengenai pengaruh likuiditas, corporate social responsibility, manajemen laba, dan ukuran perusahaan terhadap agresivitas pajak pada perusahaan manufaktur yang terdaftar secara konsisten di Bursa Efek Indonesia selama tahun 2013-2015. Penelitian ini menggunakan 64 perusahaan manufaktur sebagai sampel. Pengolahan data dilakukan dengan bantuan program software EViews. Hasil penelitian ini menunjukkan bahwa likuiditas memiliki pengaruh terhadap agresivitas pajak, sedangkan corporate social responsibility, manajemen laba, dan ukuran perusahaan tidak memiliki pengaruh terhadap agresivitas pajak.
Kata kunci: agresivitas pajak, likuiditas, corporate social responsibility, manajemen laba, ukuran perusahaan
INTRODUCTION
The government carries out economic development in order to improve the welfare of the entire territory of the state of Indonesia fairly and equitably. For that, it takes a lot of funds and one source of funds to do the development is from natural resources (oil and gas sector and non oil and gas). According to Dewi and Keni (2012: 462) revenues from natural resources have a relatively limited age so that one day will be exhausted and can not be renewed again. Another alternative for the government to obtain development funds is from public dues in the form of taxes, which have a relatively unlimited age given the increasing population in Indonesia and must pay taxes if having income above non-taxable income. These tax revenues will be used to finance development and government expenditures and improve the welfare of all Indonesians.
Dewi and Cynthia: Aggressiveness Tax in Indonesia
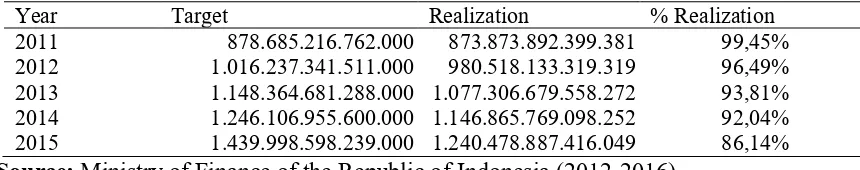
Rp 873,873 billion in 2011 to Rp 1,240,478 billion in 2015 or an increase of 41.95% within 5 years. In fact, the realization of tax revenue is not in accordance with the planned in the budget, where the realization is lower than the budget target. Based on the data in table 1., the percentage of realization of tax revenue from year to year also decreased, from 99.45% in 2011 decreased to 86.14% in 2015. Decrease in the percentage of realization and not reaching the budget on tax revenue is certainly raises questions for the government, the Ministry of Finance, and the Directorate General of Taxes.
Table 1. Budget and Tax Revenues of the Republic of Indonesia (in Rupiah)
Year Target Realization % Realization 2011 878.685.216.762.000 873.873.892.399.381 99,45% 2012 1.016.237.341.511.000 980.518.133.319.319 96,49% 2013 1.148.364.681.288.000 1.077.306.679.558.272 93,81% 2014 1.246.106.955.600.000 1.146.865.769.098.252 92,04% 2015 1.439.998.598.239.000 1.240.478.887.416.049 86,14%
Source: Ministry of Finance of the Republic of Indonesia (2012-2016)
Governments and companies have different perspectives on taxes. For the government, the tax is the income to be maximized, while for the company, the tax is the burden to be minimized. Tax minimization measures are undertaken by the company in order to gain greater benefits in order to make the owners prosperous. According to Lanis and Richardson (2012: 87) tax aggressiveness becomes a common act by corporate management around the world to minimize corporate taxes.
According Suyanto and Supramono (2012: 167) tax aggressiveness is an act of engineered taxable income undertaken by the company through tax planning activities. Tax planning measures are legal (tax avoidance) and illegal (tax evasion). According to Lanis and Richardson (2012: 87) tax aggressiveness is an act that is considered not socially responsible and does not pay attention to the interests of the community. One of the company's strategies to get a good view of society is through implementation and disclosure of corporate social responsibility.
The results of Lanis and Richardson's research (2012: 105) and Ratmono and Sagala (2015: 27) indicate that companies doing corporate social responsibility tend to avoid tax aggressiveness. The results of Landry et al. (2013: 636) shows that companies that implement corporate social responsibility also conduct tax aggressiveness. The results of Landry et al. (2013) is supported by evidence of tax cases by companies in Indonesia such as PT Bank BCA Tbk. and PT Kaltim Prima Coal.
Research on the factors affecting tax aggressiveness has been widely used but shows inconsistent results. The results of research by Adisamartha and Noviari (2015), Anita (2015), and Purwanto (2016) indicate that liquidity has an influence on tax aggressiveness, while the results of Suyanto and Supramono (2012) and Putri (2014) studies show that liquidity has no effect on aggressiveness tax. The results of Lanis and Richardson (2012) and Ratmono and Sagala (2015) indicate that corporate social responsibility has an influence on tax aggressiveness, while the results of research Landry et al. (2013) and Anita (2015) show that corporate social responsibility has no effect on tax aggressiveness.
Dewi and Cynthia: Aggressiveness Tax in Indonesia
aggressiveness. The results of Hsieh (2012), Landry et al. (2013), Ardyansah and Zulaikha (2014), and Ratmono and Sagala (2015) indicate that firm size has an influence on tax aggressiveness, while Lanis and Richardson (2012), Rusydi (2013), and Anita (2015) firm size has no effect on tax aggressiveness.
The Directorate General of Taxes is currently actively increasing tax revenues. If the company does tax aggressiveness will certainly reduce the state revenue that will be used to prosper the community. This research is a replication of Lanis and Richardson (2012) research on the influence of corporate social responsibility towards tax aggressiveness. What distinguishes this research from previous research is the addition of variables such as liquidity, earnings management, and firm size. Based on the above description and inconsistency of the results of previous research, re-conducted research on the influence of liquidity, corporate social responsibility, earnings management, and firm size to tax aggressiveness at manufacturing companies listed on the Indonesia Stock Exchange during 2013-2015.
LITERATURE REVIEW
Tax Aggressiveness. According to Lanis and Richardson (2012: 86) tax aggressiveness is an action taken to reduce taxable income through tax planning activities. According Suyanto and Supramono (2012: 167) tax aggressiveness is an act of engineered taxable income undertaken by the company through tax planning activities.
Companies tend to tax aggressiveness when they receive a large tax burden. According to Lanis and Richardson (2012: 87) tax aggressiveness is an act that is considered socially irresponsible. Companies are deliberately avoiding paying taxes and reducing state revenues to be used for community prosperity. According to Ratmono and Sagala (2015: 17) the company's actions in terms of minimizing tax payments are actually not in line with the views and expectations of the community. This is because the taxes paid by the company have important implications for the public in terms of funding public goods. From the standpoint of stakeholder theory, tax aggressiveness is an act that benefits only the company itself and does not care about other stakeholders including the government and society.
Liquidity. According to Tiaras and Wijaya (2015: 382) liquidity is the ability to be able to meet the short-term obligations of the company. One of the short-term obligations of the company is the tax. According to Suyanto and Supramono (2012: 168) companies that have a high level of liquidity illustrate that the company has a good cash flow and healthy so that the company will not be reluctant to pay all its obligations including taxes. The higher the liquidity the tax aggressiveness will be lower.
Corporate Social Responsibility. Corporate social responsibility is a concept whereby the company has the responsibility of all its stakeholders in all aspects of the company's operations. According to Lanis and Richardson (2012: 87) corporate social responsibility is how companies take into account their social and environmental impacts in how to operate, maximize benefits, and minimize losses.
Dewi and Cynthia: Aggressiveness Tax in Indonesia
Richardson (2012: 105) state that the higher level of corporate social responsibility disclosure of a company, the lower the degree of tax aggressiveness.
Companies that disclose corporate social responsibility expect to gain legitimacy from the public that the company's activities are in line with society's expectations. According to Ratmono and Sagala (2015: 17) the company tries not to do tax aggressiveness to maintain the legitimacy obtained from corporate social responsibility activities. Tax aggressiveness can damage the corporate image in the eyes of the public. The higher level of corporate social responsibility corporate disclosure then the tax aggressiveness will be lower.
Earnings Management. According to Belkaoui (2004: 456) earnings management is the potential use of accrual management to gain personal gain. According to Belkaoui (2004: 447) there are three underlying hypotheses of profit management action: the bonus plan hypothesis, the debt equity-hypothesis, and the political cost hypothesis. According to Suyanto and Supramono (2012: 168) tax motivation is one of the motivation managers make earnings management. This statement is consistent with the political cost hypothesis of positive accounting theory, in which the firm will make income decreasing to reduce its taxable income. According to Suyanto and Supramono (2012: 168) the more aggressive companies do earnings management tax aggressiveness will be higher due to the smaller tax burden.
Firm Size. Firm size is determined by the size of the assets owned by the company. Large companies tend to have large assets. According to Ardyansah and Zulaikha (2014: 2) the greater the number of assets owned, the increased amount of productivity and profit generated by the company, including the tax burden borne by the company. The higher the size of the company the higher the tax aggressiveness.
According to Anita (2015: 12) in general large companies will get greater attention from the tax authorities associated with the profits earned. The height of supervision by the tax authorities on the company will make the company to be more careful in doing corporate tax planning. The higher the size of the company the lower the tax aggressiveness.
Prior Research and Hypothesis Development. Lanis and Richardson (2012) conducted research on the impact of corporate social responsibility on tax aggressiveness. The samples studied were 408 company data registered in Australia during 2008-2009. The results showed that corporate social responsibility has an influence on tax aggressiveness.
Hsieh (2012) conducted a study on the factors that affect tax aggressiveness. The samples studied were 421 company data registered at Shanghai Security Exchange and Shenzhen Security Exchange during 1998-2001. The results showed that size, leverage, return on assets, inventory intensity, and capital intensity have an influence on tax aggressiveness.
Dewi and Cynthia: Aggressiveness Tax in Indonesia
Landry et al. (2013) conducted a study on the impact of corporate social responsibility on tax aggressiveness. The sample studied was 551 company data listed on the Toronto Stock Exchange during 2004-2008. The results show that corporate social responsibility has no effect on tax aggressiveness. Rusydi (2013) conducted a study on the effect of firm size on tax aggressiveness. The sample studied is 204 data of companies listed on Indonesia Stock Exchange during 2010-2012. The results show that firm size has no effect on tax aggressiveness.
Ardyansah and Zulaikha (2014) conducted research on the effect of size, leverage, profitability, capital intensity, and independent commissioners against tax aggressiveness. The sample studied is 225 data of manufacturing companies listed on Indonesia Stock Exchange during 2010-2012. The results showed that the size and independent commissioners have an influence on tax aggressiveness, while leverage, profitability, and capital intensity have no influence on tax aggressiveness.
Putri (2014) conducted research on the influence of liquidity, earnings management, and corporate governance to tax aggressiveness. The sample under study is 164 data of manufacturing companies listed on Indonesia Stock Exchange during 2008-2012. The results show that corporate governance has an influence on tax aggressiveness, while liquidity and earnings management have no influence on tax aggressiveness.
Adisamartha and Noviari (2015) conducted research on the effects of liquidity, leverage, inventory intensity, and the intensity of fixed assets against tax aggressiveness. The sample studied is 172 data of manufacturing companies listed on Indonesia Stock Exchange during 2011-2014. The results showed that liquidity and inventory intensity have an influence on tax aggressiveness, while leverage and fixed asset intensity have no effect on tax aggressiveness.
Amril et al. (2015) conducted a study on the effect of earnings management and corporate governance on tax aggressiveness. The samples studied are 180 data of manufacturing companies listed on Indonesia Stock Exchange during 2011-2013. The results show that corporate governance has an influence on tax aggressiveness, while earnings management has no effect on tax aggressiveness.
Anita (2015) conducted a study on the impact of corporate social responsibility, leverage, liquidity, and company size on tax aggressiveness. The sample studied is 112 data of real estate and property companies listed on Indonesia Stock Exchange during 2010-2013. The results showed that liquidity has an influence on tax aggressiveness, while corporate social responsibility, leverage, and firm size have no influence on tax aggressiveness.
Ratmono and Sagala (2015) conducted research on the impact of corporate social responsibility on tax aggressiveness. The sample studied was 370 non-financial company data listed on the Indonesia Stock Exchange during 2011-2013. The results showed that corporate social responsibility has an influence on tax aggressiveness.
Purwanto (2016) conducted research on the influence of liquidity, leverage, earnings management, and fiscal loss compensation against tax aggressiveness. The samples studied are 57 data of agricultural and mining companies listed on Indonesia Stock Exchange during 2011-2013. The results show that liquidity, leverage, and earnings management have an influence on tax aggressiveness, while fiscal loss compensation has no effect on tax aggressiveness.
Dewi and Cynthia: Aggressiveness Tax in Indonesia
Figure 1. Research Model
Based on the description above, the formulation of the hypothesis is as follows: Ha1: Liquidity has an influence on the tax aggressiveness.
Ha2: Corporate social responsibility has an influence on the tax aggressiveness. Ha3: Earnings management has an influence on the tax aggressiveness.
Ha4: Firm size has an influence on the tax aggressiveness.
METHODS
Population and Methods of Sampling. The population in this study are all manufacturing companies listed consistently on the Indonesia Stock Exchange during the year 2013-2015. The sample selection using purposive sampling method, meaning that the sample population is a population that meets the criteria that have been determined. Companies that will be used as research samples are companies that have the following criteria: a. The company publishes a complete annual report, b. The company uses the Rupiah currency in its financial reporting, c. The company uses the year ended 31 December, and d. The company had no pre-tax loss.
Operationalization of Research Variables. The dependent variable in this research is tax aggressiveness. The independent variables in this research consist of liquidity, corporate social responsibility, earnings management, and firm size.
Tax Aggressiveness. The dependent variable in this study is the tax aggressiveness given the symbol AGP. The tax aggressiveness measurement scale is a ratio scale. According to Lanis and Richardson (2012: 92) tax aggressiveness using a proxy effective tax rate and formulated as follows:
Liquidity. The measurement scale for liquidity given the symbol LIQ is a ratio scale. According to Putri (2014: 7) liquidity using a proxy current ratio and formulated as follows:
Liquidity
Corporate Social Responsibility
Earnings Management
Tax
Aggressive-ness
Ha1
Ha3
Ha2
Firm Size
Dewi and Cynthia: Aggressiveness Tax in Indonesia
Corporate Social Responsibility. The measurement scale for the corporate social responsibility that is symbolized CSR is the ratio scale. Lanis and Richardson (2012: 92) use categorization methods to measure corporate social responsibility, where each item of corporate social responsibility indicator disclosed in the company's annual report will be assigned a value of 1 and vice versa for those not disclosed in the company's annual report will be given a value of 0. Value categorization of corporate social responsibility disclosure of each company will be summed then divided by the total indicator of corporate social responsibility.
In this study, corporate social responsibility disclosure indicators will use items compiled by Lanis and Richardson (2012: 93). According to Lanis and Richardson (2012: 93) this indicator contains 52 items that include: a. Corporate and corporate social responsibility strategy items (8 items), b. Staff strategy items (18 items), c. Social investment items (5 items), d. Environment items (8 items), e. Customer and supplier items (7 items), and f. Community and political involvement items (6 items). According to Lanis and Richardson (2012: 9) corporate social responsibility formulated as follows:
Earnings Management. The measurement scale for earnings management given the symbol DA is a ratio scale. According to Purwanto (2016: 586) earnings management using a proxy discretionary accrual calculated by modified Jones models and formulated as follows:
Description: Dait : Discretionary accruals for firm i in period t; Tait : Total accruals for firm i in period t; Ait-1 : Total assets of firm i in period t-1; NDAit : Non-discretionary accruals for firm i in period t; Total accruals (TA) is calculated by:; TAit= NIit – CFOit
Total accrual is estimated using ordinary least squares regression equation as follows:
Dewi and Cynthia: Aggressiveness Tax in Indonesia company i in period t; e: Error terms; Δrect : Change in accounts received firm i in period t
Firm Size: The measurement scale for firm size given the symbol SIZE is a ratio scale. Appropriate to Lanis and Richardson (2012: 95) firm size formulated as follows:
SIZE = Ln (Total Assets)
Data Collection Technique. The object of this research is the influence of liquidity, corporate social responsibility, earnings management, and firm size to tax aggressiveness at manufacturing companies registered consistently in Indonesia Stock Exchange during the year 2013-2015. The data used in this study is secondary data derived from the Indonesia Stock Exchange in the form of financial statements and annual reports issuers during the year 2013-2015 obtained from the website www.idx.co.id. The data obtained is then processed and tested using the help of EViews software program.
Data Processing Technique. In this research, the analysis is quantitative analysis, using Ordinary Least Square regression analysis. The regression model in this study is AGP = a + b1 LIQ + b2 CSR + b3 DA + b4 SIZE + e, where AGP = tax aggressiveness; a = Constants; b1-4 = Regression coefficient; LIQ = Liquidity; CSR = Corporate social responsibility; DA = earnings management; SIZE = Company size; and e = Error terms. The hypothesis was tested by Chow test and Hausman test. This research uses error rate of 5%.
RESULT AND DISCUSSIONS
Sample Selection. The population in this study are all manufacturing companies listed consistently on the Indonesia Stock Exchange during the year 2013-2015. Companies that will be used as research samples are companies that have the following criteria: a. The company publishes a complete annual report, b. The company uses the Rupiah currency in its financial reporting, c. The company uses the year ended 31 December, and d. The company had no pre-tax loss. Based on these criteria obtained the final sample of 192 data.
Dewi and Cynthia: Aggressiveness Tax in Indonesia
Table 2. Descriptive Statistics
AGP LIQ CSR DA SIZE
Mean 0,286066 2,857838 0,436198 0,028760 28,32233 Maximum 0,947617 13,87127 0,750000 0,360022 33,13405 Minimum 0,029100 0,403140 0,076923 -0,136545 25,61948 Std. Dev. 0,142057 2,538748 0,165626 0,078842 1,666901
Source: EViews Processing Results
Table 2. shows that tax aggressiveness (AGP) has an average value of 0.286066, a standard deviation of 0.142057, a minimum value of 0.029100, and a maximum value of 0.947617. Liquidity (LIQ) has an average value of 2.857838, a standard deviation of 2.538748, a minimum value of 0.403140, and a maximum value of 13.87127. Corporate social responsibility (CSR) has an average value of 0.436198, a standard deviation of 0.165626, a minimum value of 0.076923, and a maximum value of 0.750000. Earnings management (DA) has an average value of 0.028760, a standard deviation of 0.078842, a minimum value of -0.136545, and a maximum value of 0.360022. Firm size (SIZE) has an average value of 28.32233, a standard deviation of 1.666901, minimum value of 25.61948, and a maximum value of 33.13405.
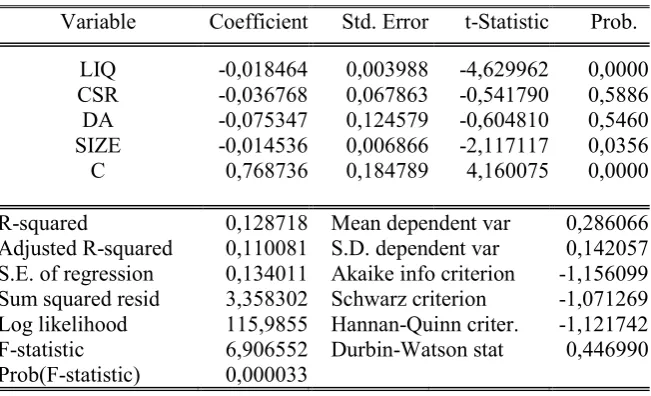
Analysis and Discussion. The purpose of this analysis is to determine the effect of liquidity, corporate social responsibility, earnings management, and firm size on tax aggressiveness at manufacturing companies listed consistently in Indonesia Stock Exchange during 2013-2015. The technique of estimation of panel data regression model there is two that is Chow test and Hausman test. The first step is to test the Chow choosing between the pooled least square model or the fixed effect model. Here is the pooled least square model:
Table 3. Pooled Least Square Model
Variable Coefficient Std. Error t-Statistic Prob. LIQ -0,018464 0,003988 -4,629962 0,0000 CSR -0,036768 0,067863 -0,541790 0,5886 DA -0,075347 0,124579 -0,604810 0,5460 SIZE -0,014536 0,006866 -2,117117 0,0356 C 0,768736 0,184789 4,160075 0,0000 R-squared 0,128718 Mean dependent var 0,286066 Adjusted R-squared 0,110081 S.D. dependent var 0,142057 S.E. of regression 0,134011 Akaike info criterion -1,156099 Sum squared resid 3,358302 Schwarz criterion -1,071269 Log likelihood 115,9855 Hannan-Quinn criter. -1,121742 F-statistic 6,906552 Durbin-Watson stat 0,446990 Prob(F-statistic) 0,000033
Source: EViews Processing Results
Dewi and Cynthia: Aggressiveness Tax in Indonesia
Table 4. Fixed Effect Model
Variable Coefficient Std. Error t-Statistic Prob. LIQ -0,008605 0,007588 -1,133978 0,2590 CSR 0,661205 0,274436 2,409325 0,0175 DA -0,054820 0,082486 -0,664603 0,5075 SIZE 0,005794 0,050741 0,114189 0,9093 C -0,140284 1,411582 -0,099381 0,9210
Effects Specification Cross-section fixed (dummy variables)
R-squared 0,840471 Mean dependent var 0,286066 Adjusted R-squared 0,754274 S.D. dependent var 0,142057 S.E. of regression 0,070419 Akaike info criterion -2,197589 Sum squared resid 0,614895 Schwarz criterion -1,043893 Log likelihood 278,9686 Hannan-Quinn criter. -1,730334 F-statistic 9,750565 Durbin-Watson stat 2,295903 Prob(F-statistic) 0,000000
Source: EViews Processing Results
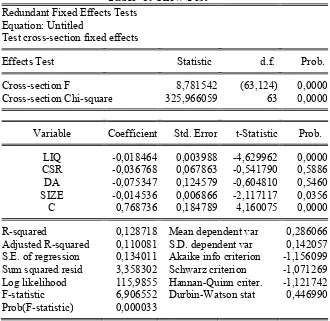
After model pooled least square and fixed effect model is known then Chow test. Here are the Chow test results:
Table 5. Chow Test
Redundant Fixed Effects Tests Equation: Untitled
Test cross-section fixed effects
Effects Test Statistic d.f. Prob. Cross-section F 8,781542 (63,124) 0,0000 Cross-section Chi-square 325,966059 63 0,0000
Variable Coefficient Std. Error t-Statistic Prob. LIQ -0,018464 0,003988 -4,629962 0,0000 CSR -0,036768 0,067863 -0,541790 0,5886 DA -0,075347 0,124579 -0,604810 0,5460 SIZE -0,014536 0,006866 -2,117117 0,0356 C 0,768736 0,184789 4,160075 0,0000 R-squared 0,128718 Mean dependent var 0,286066 Adjusted R-squared 0,110081 S.D. dependent var 0,142057 S.E. of regression 0,134011 Akaike info criterion -1,156099 Sum squared resid 3,358302 Schwarz criterion -1,071269 Log likelihood 115,9855 Hannan-Quinn criter. -1,121742 F-statistic 6,906552 Durbin-Watson stat 0,446990 Prob(F-statistic) 0,000033
Dewi and Cynthia: Aggressiveness Tax in Indonesia
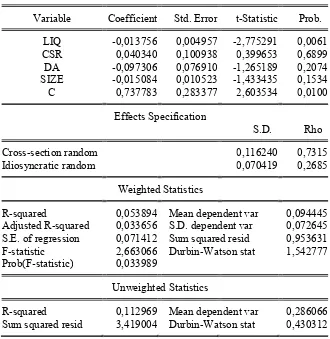
Based on table 5. the results obtained that the value of F arithmetic smaller than 0.05 so that Ho is rejected or in other words fixed effect model that must be used for estimation techniques in this study. The next stage is Hausman test which chooses between fixed effect model or random effect model. Here is a random effect model:
Table 6. Random Effect Model
Variable Coefficient Std. Error t-Statistic Prob. LIQ -0,013756 0,004957 -2,775291 0,0061 CSR 0,040340 0,100938 0,399653 0,6899 DA -0,097306 0,076910 -1,265189 0,2074 SIZE -0,015084 0,010523 -1,433435 0,1534 C 0,737783 0,283377 2,603534 0,0100
Effects Specification
S.D. Rho Cross-section random 0,116240 0,7315 Idiosyncratic random 0,070419 0,2685
Weighted Statistics
R-squared 0,053894 Mean dependent var 0,094445 Adjusted R-squared 0,033656 S.D. dependent var 0,072645 S.E. of regression 0,071412 Sum squared resid 0,953631 F-statistic 2,663066 Durbin-Watson stat 1,542777 Prob(F-statistic) 0,033989
Unweighted Statistics
R-squared 0,112969 Mean dependent var 0,286066 Sum squared resid 3,419004 Durbin-Watson stat 0,430312
Source: EViews Processing Results
Dewi and Cynthia: Aggressiveness Tax in Indonesia
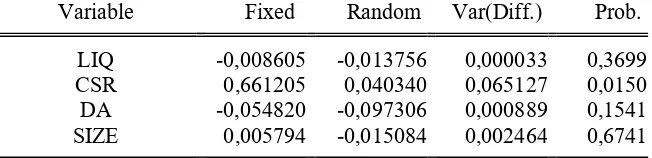
Table 7. Hausman Test
Source: EViews Processing Results
Correlated Random Effects - Hausman Test Equation: Untitled
Test cross-section random effects
Test Summary
Chi-Sq.
Statistic Chi-Sq. d.f. Prob. Cross-section random 9,309765 4 0,0538
Cross-section random effects test comparisons:
Variable Fixed Random Var(Diff.) Prob. LIQ -0,008605 -0,013756 0,000033 0,3699 CSR 0,661205 0,040340 0,065127 0,0150 DA -0,054820 -0,097306 0,000889 0,1541 SIZE 0,005794 -0,015084 0,002464 0,6741
Cross-section random effects test equation: Dependent Variable: AGP
Method: Panel Least Squares Date: 01/12/18 Time: 15:15 Sample: 2013 2015
Periods included: 3
Cross-sections included: 64
Total panel (balanced) observations: 192
Variable Coefficient Std. Error t-Statistic Prob. C -0,140284 1,411582 -0,099381 0,9210 LIQ -0,008605 0,007588 -1,133978 0,2590 CSR 0,661205 0,274436 2,409325 0,0175 DA -0,054820 0,082486 -0,664603 0,5075 SIZE 0,005794 0,050741 0,114189 0,9093
Effects Specification Cross-section fixed (dummy variables)
Dewi and Cynthia: Aggressiveness Tax in Indonesia
Based on table 7. we get the result that p-value is greater than 0.05 so that Ho fails to be rejected or in other words random effect model that must be used for estimation technique in this research. Regression model obtained is AGP = 0.737783 - 0.013756 LIQ + 0.040340 CSR - 0.097306 DA - 0.015084 SIZE + e.
First Hypothesis Test. The first alternative hypothesis (Ha1) in this study is that liquidity has an influence on tax aggressiveness. Table 6. shows that the value of liquidity significance is 0.0061 where this value is smaller than 0.05 so it can be concluded that Ha1 received or in other words liquidity has an influence on tax aggressiveness.
Liquidity has a negative effect on tax aggressiveness. If the company's liquidity increases by one unit then the tax aggressiveness will decrease by 0.013756 units. These results are consistent with the results of research conducted by Adisamartha and Noviari (2015), Anita (2015), and Purwanto (2016) stating that if the company gets more liquid it will tend to avoid aggressive tax action. Companies that have a high level of liquidity indicate that the company has a number of current assets that many and available to be converted into cash. The cash can be used by the company to settle its obligations including tax obligations. The ability of the company to carry out the obligation makes the company feel unnecessary to tax aggressiveness in order to minimize the amount of tax payable. The company will tend to carry out its tax obligations in a strict and correct manner as it has the ability to pay the tax burden arising from the results of the company's operating profit.
Second Hypothesis Test. The second alternative hypothesis (Ha2) in this study is corporate social responsibility has an influence on tax aggressiveness. Table 6. shows that the value of corporate social responsibility significance is 0.6899 where this value is greater than 0.05 so it can be concluded that Ha2 is not accepted or in other words corporate social responsibility has no influence on tax aggressiveness.
These results are consistent with the results of research conducted by Landry et al. (2013) and Anita (2015) stating that although a company conducts and discloses corporate social responsibility in its annual report, the company is also active in tax aggressiveness to minimize the amount of tax payable. The inconsistency of the results of this study can be due to the measurement of corporate social responsibility that is seen only the presence or absence of disclosure of an item of social action, rather than judging from the actual actions taken by the company. Companies may simply disclose information about the conduct of the social action, but in practice not necessarily implemented and although implemented, the implementation of social action is not really animated by the company.
Dewi and Cynthia: Aggressiveness Tax in Indonesia
deemed not to provide added value or direct profits to the company, but incur a burden to the company in the form of taxes to be paid.
Third Hypothesis Test. The third alternative hypothesis (Ha3) in this study is earnings management has an influence on tax aggressiveness. Table 6. shows that the value of significance of earnings management is equal to 0.2074 where this value is greater than 0.05 so it can be concluded that Ha3 is not accepted or in other words earnings management has no effect on tax aggressiveness.
These results are consistent with the results of research conducted by Putri (2014) and Amril et al. (2015) stating that companies that make earnings management may not necessarily tax aggressiveness. The inconsistency of the results of this study could be due to the company's goal in making earnings management is not based on tax motivation. Earnings management actions can be done by the company with the aim of maximizing the number of bonuses for successful performance through increased earnings reporting. Earnings management actions can also be done with the aim of delaying costs or sanctions arising from debt that can hamper management performance by improving earnings reporting.
Fourth Hypothesis Test. The fourth alternative hypothesis (Ha4) in this study is the size of the company has an influence on tax aggressiveness. Table 6. shows that the significance value of firm size is 0.1534 where this value is greater than 0.05 so it can be concluded that Ha4 is not accepted or in other words firm size has no influence to tax aggressiveness.
The results of this study are consistent with the results of research conducted by Lanis and Richardson (2012), Rusydi (2013), and Anita (2015). The inconsistency of the results of this study can be due to both large and small companies continue to aggressive taxes and deliberately avoid tax payments.
CONCLUSION
Liquidity has an effect on tax aggressiveness. The results of this study are consistent with the results of research conducted by Adisamartha and Noviari (2015), Anita (2015), and Purwanto (2016). The results of this study are inconsistent with the results of research conducted by Suyanto and Supramono (2012) and Putri (2014).
Corporate social responsibility has no effect on tax aggressiveness. The results of this study are consistent with the results of research conducted by Landry et al. (2013) and Anita (2015). The results of this study are inconsistent with the results of research conducted by Lanis and Richardson (2012) and Ratmono and Sagala (2015).
Earnings management has no effect on tax aggressiveness. The results of this study are consistent with the results of research conducted by Putri (2014) and Amril et al. (2015). The results of this study are inconsistent with the results of research conducted by Suyanto and Supramono (2012) and Purwanto (2016).
Dewi and Cynthia: Aggressiveness Tax in Indonesia
This study only uses independent variables such as liquidity, corporate social responsibility, earnings management, and company size. The suggestion for further research is researchers should examine other factors that are expected to have an effect on tax aggressiveness but have not been tested in this study such as institutional ownership and inventory intensity. For the Directorate General of Taxes is expected to pay attention to the factors that affect tax aggressiveness so that the target of tax revenue can be achieved.
REFERENCES
Adisamartha, Ida Bagus Putu Fajar dan Naniek Noviari. (2015). Pengaruh likuiditas, leverage, intensitas persediaan dan intensitas aset tetap pada tingkat agresivitas wajib pajak badan. E-Jurnal Akuntansi Universitas Udayana. 13(3). Desember. 972-1000
Amril, Alfred, Dwi Fitri Puspa, dan Popi Fauziati. (2015). Pengaruh manajemen laba dan corporate governance terhadap agresivitas pajak perusahaan manufaktur yang listing di bursa efek indonesia (BEI) periode 2011-2013. Jurnal Universitas Bung Hatta. 7(1). 1-15
Anita M., Fitri. (2015). Pengaruh corporate social responsibility, leverage, likuiditas dan ukuran perusahaan terhadap agresivitas pajak (studi empiris pada perusahaan real estate dan property yang terdaftar di bursa efek indonesia tahun 2010-2013). Jom FEKON. 2(2). 1-15
Ardyansah, Danis dan Zulaikha. (2014). Pengaruh size, leverage, profitability, capital intensity ratio dan komisaris independen terhadap effective tax rate (ETR). Diponegoro Journal of Accounting. 3(2). 1-9
Belkaoui, Ahmed Riahi. (2004). Accounting theory. Fifth Edition. London: Thomson Learning
Dewi, Sofia Prima Dewi dan Keni. (2012). Faktor-faktor yang mempengaruhi kepatuhan pelaporan wajib pajak dosen tetap universitas tarumanagara di jakarta. Jurnal Akuntansi. September. 16(3). 461-474
Hsieh, Yao-Chih. (2012). New evidence on determinants of corporate effective tax rates. African Journal of Business Management. 6(3). 1177-1180
Kementerian Keuangan Republik Indonesia. (2012). Laporan Keuangan Pemerintah Pusat Tahun 2011. http://www.kemenkeu.go.id/Publikasi/laporan-keuangan-pemerintah-pusat-2011-audited
_____. (2013). Laporan Keuangan Pemerintah Pusat Tahun 2012. http://www.kemenkeu.go.id/Publikasi/laporan-keuangan-pemerintah-pusat-2012-audited
_____. (2014). Laporan Keuangan Pemerintah Pusat Tahun 2013. http://www.kemenkeu.go.id/Publikasi/laporan-keuangan-pemerintah-pusat-2013-audited
_____. (2015). Laporan Keuangan Pemerintah Pusat Tahun 2014. http://www.kemenkeu.go.id/Publikasi/laporan-keuangan-pemerintah-pusat-2014 _____. (2016). Laporan Keuangan Pemerintah Pusat Tahun 2015.
Dewi and Cynthia: Aggressiveness Tax in Indonesia
Landry, Suzanne, Manon Deslandes, dan Anne Fortin. (2013). Tax aggressiveness, corporate social responsibility, and ownership structure. Journal of Accounting, Ethics & Public Policy. 14(3). 611-645
Lanis, Roman dan Grant Richardson. (2012). Corporate social responsibility and tax aggressiveness: an empirical analysis. Journal of Accounting and Public Policy. 31(1). 86-108
Purwanto, Agus. (2016). Pengaruh likuiditas, leverage, manajemen laba, dan kompensasi rugi fiskal terhadap agresivitas pajak perusahaan pada perusahaan pertanian dan pertambangan yang terdaftar di bursa efek indonesia periode 2011-2013. JOM Fekon. 3(1). 580-594
Putri, Lucy Tania Yolanda. (2014). Pengaruh likuiditas, manajemen laba dan corporate governance terhadap agresivitas pajak perusahaan (studi empiris pada perusahaan yang terdaftar di BEI periode 2008-2012). Jurnal Akuntansi. 2(1). 1-23
Ratmono, Dwi dan Winarti Monika Sagala. (2015). Pengungkapan corporate social responsibility (CSR) sebagai sarana legitimasi: dampaknya terhadap tingkat agresivitas pajak. Jurnal Nominal: Barometer Riset Akuntansi dan Manajemen. 4(2). 16-30
Rusydi, M. Khoiru. (2013). Pengaruh ukuran perusahaan terhadap aggressive tax avoidance di Indonesia. Jurnal Akuntansi Multiparadigma. 4(2). 322-329
Suyanto, Krisnata Dewi dan Supramono. (2012). Likuiditas, leverage, komisaris independen, dan manajemen laba terhadap agresivitas pajak perusahaan. Jurnal Keuangan dan Perbankan. 16(2). 167-177