ANALYSIS OF FINANCIAL PERFORMANCE
ISO 9000 CERTIFIED COMPANY
(Empirical Study on the Manufacturing Companies Listed on the Stock Exchange)
Rini Oktaviana Sari
Student of Graduate Program, Master of Management, D Building, VII Floor
Jl. Kiai Tapa No. 1 Grogol, Jakarta 11440
email: [email protected], Phone: (021) 5664166, Fax.: (021) 5668640
ABSTRACT
Business competition in the era of globalization requires businesses to be more creative to produce a quality product to compete in the market International. ISO 9000 certification has been accepted as a reference for quality management and quality assurance. The purpose of this study was to determine differences in the performance of financial companies that have certified ISO 9000 as measured by levels of profitabiltas (ROCE, ROI, ROE), market growth (sales growth and growth equity) and management of liabilities (DTA and DER). This research method uses quantitative methods of research methods based on analysis of variables that can be explained quantitatively by using a formula that is by Financial Ratio Analysis.SimakBaca secara fonetik Technical analysis of the data in this research are descriptive analysis and statistics analysis. Statistical analysis to test data normality, if the normal data, using Paired Sample T-test and if the data is not normal, using the Wilcoxon Signed-rank Test. The conclusion from this research indicate that there is no difference whether the level of profitability, market growth and management of liabilities in the period before and after the certification of ISO 9000. No difference was attributable to that ISO certification is only for administrative completeness in order to obtain the logo of the certification institution, so as to indicate to consumers that its product quality.
INTRODUCTION
Business faces competition in the era of globalization and the rapid development of today’s business world, all businesses are required to be more creative and competitive. Globalization is believed to provide some opportunities but also creates a number of challenges for companies, both engaged in industrial goods or services. To be able to compete, every company should have a competitive advantage is to produce a product/service quality. Product quality if the product is said to meet or exceed customer expectations at competitive prices. Achieving high quality and continuous improvement in the quality of the goals of all organizations, because of good quality will be lower costs, improve customer satisfaction and encourage and sustain long-term success and profitability (Blocher et al., 2000). To convince the public of the quality of products produced, the company requires recognition by outsiders on the application of quality management system is superior, it is a form of recognition of certification from an independent certification body. With this certification, the public can get an idea of the quality products offered by the company.
ISO 9000 has been widely accepted as the reference system of quality management and quality assurance. Basically the ISO 9000 certification is voluntary (voluntary). In other words the company is not obligated to perform the certification. But in fact the number of companies that perform ISO 9000 certification always increases every year (Chow Chua, Goh, Tan, 2003). This fact raises the question “what benefits are derived by an enterprise that many companies are doing ISO 9000 certification”. Various studies have found several benefits to companies that ISO 9000 certification. ISO 9000 can be used as a tool for business processes and continuous performance improvement. ISO 9000 certification will be part of a strategic plan for the record of past performance so that it can be used to forecast the future keys (Nasser and Khabari, 2004). Wide range of disciplines in management, business and economics tries to provide a reasonable explanation about the reasons underlying the company’s conduct ISO certification (Dimara, Skuras and Tsekouras, 2004). Construction of a reason refers to the desire in order to improve internal processes and improve the overall competitive performance for the company (Yahya and Goh, 2001). As a result, the terminology of quality management, quality control, quality systems and quality assurance obtained by different and sometimes create conflict between countries, between industries within a country, even between companies within an industry.
9000; (2a) To know the different market growth as measured by sales growth before and after the certification of ISO 9000; (2b) To know the different market growth as measured by the growth of equity before and after the certification of ISO 9000; (3a) To determine the differences in the management of liabilities as measured by debt to total assets before and after the certification of ISO 9000; (3b) To determine the differences in the management of liabilities as measured by debt to equity ratio before and after the certification of ISO 9000; Limitations in this study is the first, the dimensions and measurements of service quality items made in this study refer only to research conducted by Dimara, Sekuras and Tsekouras (2004). Second, the Company used are manufacturing companies that have earned ISO 9000 certification between the years 2003-2006 that have been listed on the Stock Exchange in 2000-2009, on the grounds that the data from the companies that Go Public is easily accessible via IDX, so companies that have ISO certified but has not Go Public is not included in the sample.
THEORETICAL FRAMEWORK AND HYPOTHESIS DEVELOPMENT
ISO (International Organization for Standardization)
Seize opportunities in an increasingly open market provision of goods and services must be supported by a system of internationally recognized quality. One is a standard issued by the International Organization for Standardization in a series related to the quality system is ISO 9000, even now evolving towards integrated quality management system covering the entire production process from beginning to end, such as ISO 9000. ISO 9000 is a guideline for managing the quality and quality standards developed by the International Organization for Standardization in Geneva, Switzerland. Certification to ISO 9000 quality mark since the standard is implemented effectively in 1987. In order to obtain ISO 9000 certification, companies must prove that they have followed the operating procedures that exist in ISO 9000; which includes inspection of the production process, maintaining equipment, trained manpower, test the product and associated with customer complaints. Independent testing company in auditing the company’s operations and make a recommendation to issue the certificate. ISO 9000 standards derived from the British Standards (BS) received 5750 and increased to Euro Standards (EN-29 000 series). ISO is related to quality management that is based on four levels of the ISO 9003 standard is the base level of standards for controlling field final assessment and tests, 9002 medium to high level assessment of the quality of the design, development, production, installation and service, ISO 9004 for the highest level quality management and quality system elements (Suardi, 2003).
Quality Audits; (r) Training; (s) Servicing; (t) Statistic techniques. To get the certificate ISO 9000, a company must develop five issues: (1) Organization requirements; (2) Pre-operational requirements; (3) Operational; (4) Inspection and correction; (5) Support System (Tjiptono, 2003).
Types of ISO 9000
ISO 9000 standards group, consisting of:
1. ISO 9000. This standard describes the fundamentals, principles and terminology of quality management systems.
2. ISO 9001, contains requirements concerning the quality management system requirements that must be disclosed by an organization that is required to show its ability in providing products that meet customer and regulatory compliance.
3. ISO 9004. This standard contains guidance for continuous improvement.
4. ISO 19011. Which contains guidance in planning and carrying out environmental audits and quality.
Quality
Quality products and services also increase the company’s competitive advantage (Blocher, 2000). Final testing of the product or service quality is whether these products meet or exceed customer expectations. The word quality has many meanings. But when it comes to the importance of maintaining quality, according to Joseph M. Juran (2002) there are two meanings that are important are:
a. Quality means the product features that meet the needs of consumers and thus give satisfaction to the consumer. In this sense the meaning of quality associated with income. The goal of high quality is to give greater satisfaction to consumers and so on are expected to increase revenue. b. The quality of error-free means free from errors that require rework, customer dissatisfaction,
consumer complaints and others. In this sense quality oriented and cost of higher quality is usually low cost.
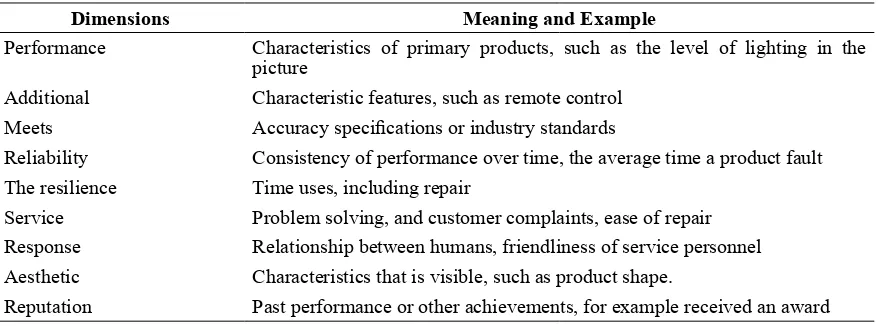
Table 1: The Quality Has Nine Different Dimensions, Namely:
Dimensions Meaning and Example
Performance Characteristics of primary products, such as the level of lighting in the picture
Additional Characteristic features, such as remote control Meets Accuracy specifications or industry standards
Reliability Consistency of performance over time, the average time a product fault The resilience Time uses, including repair
Service Problem solving, and customer complaints, ease of repair Response Relationship between humans, friendliness of service personnel Aesthetic Characteristics that is visible, such as product shape.
Reputation Past performance or other achievements, for example received an award
Financial Impact of Quality
Quality has a huge financial impact for the company. Juran (2002) divides these effects into two parts, namely the effect on income and the impact on costs. Good quality leads to increased revenue and otherwise good quality leads to lower costs. The amount of income has a relationship with the features of the products produced. In general, products with better features generate higher revenue through the market (market share) is greater or through higher prices. The system guarantees a better quality is consistently associated with reduced rework the subsequent lowering costs. This cost reduction and lead to better business performance (Dick, 2000).
Corporate Financial Performance Measurement
Associated with the underlying reasons for the company to ISO 9000 certification, financial performance is one indicator that can be used to measure the benefits derived from the company’s certification. Through analysis of financial ratios related to financial performance, can be seen whether the company’s initial motivation in doing the certification has been achieved or not. Thus, these ratios reflect the benefits that have been obtained by the company after ISO 9000 certification. According to Harahap (2006), financial ratios are the figures obtained from the comparison of one post of financial statements with other headings which have a relevant and significant. For example, between debt and equity, cash and total assets, the cost of production with total sales, and so on. This technique is very commonly used by financial analysts. In addition, financial ratios are also very important in analyzing the company’s financial condition. According to Gitman (2000), Financial Ratios are complete can be presented briefly as below:
Rasio Formula
Liquidity
Net Working Capital Current Assets – Current Liabilities
Current Ratio Current Assets
Current Liabilities
Quick (Acid Test) Ratio Current Assets-Inventory
Current Liabilities
Profitability
Gross Profit Margin Gross Profit Sales
Operating Profit Margin Operating Profit Sales
Net Profit Margin Net Profit After Taxes Sales
Return On Assets Net Profit After Tax Stockholder’s Equity
Earning Per Share Earning Available for Common Stockholders
Number of Shares of C/S Outstanding
Price Earning Ratio Market Price for Share of C/S Earning per Share
In this study there will be restrictions in the use of financial ratios, as adjusted by the discussion of the studied according to research conducted by Dimara, Sekuras and Tsekouras (2004). Ratios used are grouped into three, namely:
1. Profitability
Is the net result of a number of policies and decisions. Ratios examined so far provide useful clues about the effectiveness of the company’s operations, but the ratio of profitability goes to show the combined effect of liquidity, asset and debt management business results (Bringham and Ehrhardt, 2006). In conducting the analysis of the company, in addition to seeing the company’s financial statements, can also be done using analysis of financial ratios. Van Horne, Wachowics (2007), describes the ratio of profitability is “financial ratios that links profits with the sale of investment in the company “. Profitability ratios divided into two types of ratios, namely: profitability ratios associated with the sale and ratios related to investments. Profitability ratios used in this study are:
- Return on capital (ROCE)/ROA
Munawir (2002), “Return On Assets reflect how much the company has obtained the results of financial resources invested by the company”. ROA ratio is often used to measure the management of the company’s financial performance and assess the operational performance in utilizing the resources a company has, in addition need to consider the issue of financing of these assets. ROA values are increasingly close to 1, meaning the better the profitability of the company because every existing assets can generate profits. In other words the higher the ROA value the better the financial performance of the company. ROA shows the ability of companies to make profits from assets that are used (Syahyunan, 2004). ROA is calculated by comparing net profit after tax by total assets.
- Returns on invested capital (ROI)
- Return to Equity (ROE)
ROE indicates the ability of companies to make profits from invested equity shareholders. ROE is calculated by comparing net profit after tax to shareholders equity. ROE is an important indicator to investors because it shows the return on capital or capital invested. According to Van Horne, Wachowics (2007), firm ROE is another measure of the overall performance of companies that can inform the company’s ability to generate profits.
2. Market growth
3. Liability Management
Leverage for understanding the business terminology means lever effect, which means small changes in sales levels resulted in major changes in operating net income. Leverage is usually calculated as a ratio. Leverage is used to measure how far a company funded by corporate debt (Brealey et al., 2009). The extent to which firms use cash financing or financial leverage has three important implications: (1) By raising the debt funds, shareholders can maintain control of the company without increasing their investments; (2) If the company earns more on investments financed with loan funds rather than paying interest, and then return on shareholders of the company is enlarged or “leverage” their risks but also enlarged; (3) The lender saw the owner of such investments or funds to provide a margin of safety so the higher the proportion of funding met by stockholders, creditors face a lower risk (Bringham and Ehrhardt, 2006).
Kamal Naser, Zulkifli Mohammad Yusuf Kharbari and Mochtar (2004) which examined the impact of ISO 9000 registration on company performance in Malaysia. Performance evaluation was developed based on the four predictor variables include return on sales (ROS), lender security, free cash flow and economic value added (EVA). The result is that ROS and EVA have an impact on the ISO 9000 registration. Frank Martin Aarts and Ed Vos (2001) examined the impact of ISO certification on the performance of companies in New Zealand in terms of the financial perspective. His research is focused on investor reaction to the announcement of the company to be ISO registered. And the result that many investors do not react to the company obtained ISO certification. While research on companies in Greece showed no differences between the financial indicators exhibited significantly in ISO 9000 certified company with a company that is not certified ISO 9000 (Dimara, Sekuras and Tsekouras, 2004).
In this study, the company is certified ISO 9000 strategic orientations adopted by corporate which is a factor that determines a company’s financial performance. Initial motivation to do the certification ISO 9000 company is a diverse and multidimensional application may have an effect on corporate performance. Similarly, a study by Costa and Martinez Martinez Lorente (2004) found that ISO 9000 certification has no effect on the financial performance of companies in Singapore, there is a relationship between ISO 9000 certification by the company’s financial performance. Of the 146 companies that became the conclusion that the sample obtained ISO 9000 certified companies have better financial performance. The following framework will be explained in a diagram.
Hypothesis Formulation
H1 = The Company has a level of profitability through the Return on Capital is the difference between before and after the certification of ISO 9000.
H2 = Company has a level of profitability by return on invested capital is the difference between before and after the certification of ISO 9000.
H3 = Company has a level of profitability through Return on Equity is the difference between before and after the certification of ISO 9000.
H4 = Company has a market growth rate of sales growth through the different between before and after the certification of ISO 9000.
H5 = The company has a growth rate of the market through equity growth are different between before and after the certification of ISO 9000.
H6 = Company has liability management through Debt to Total Assets are different between before and after the certification of ISO 9000.
H7 = Company has liability management through the Debt to Equity ratio is different between before and after the certification of ISO 9000.
METHODS
Operational Variables
1. Profitability
Profitability is the ability of the company in obtaining benefits and also gives an overview about the effectiveness of the management company.
In accordance with research Dimara, Skuras and Tsekouras (2004) represented by the ratio of the level of profitability as follows:
Net Profit ROCE =
Total Asset
Net Profit
ROI =
Net FixedAsset
Net Profit
ROE =
Equity
2. Market Growth
With increasing sales and capital invested in the company jointly will be able to expand the market share of the company.
In accordance with research Dimara, Skuras and Tsekouras (2004) market growth is measured by:
Salesi – Salesi-1
Growth of Sales = Salesi-1
Equityi – Equityi-1 Growth of Equity =
Equityi-1
3. Liability Management
Obligation or debt required by the company in order to provide additional capital to run its business, in order to increase sales and ultimately increase profitability. According to Bringham and Ehrhardt (2006), the management of liabilities is measured by:
Total Liabilities Debt to Total Asset =
Total Asset
Total Liabilities
Debt to Equity Ratio =
Equity
ISO certification, conducted searches prior to the site of the National Standardization Agency (BSN) and annual tracking of manufacturing firms in 2003-2006, then do a search which has been certified company that has been listed on the Stock Exchange during the period 2000 - 2009. The data used are secondary data is data obtained indirectly from the company. All data obtained from the National Standardization Body (BSN) and the Indonesia Stock Exchange (IDX). The data was obtained in the form of financial statements and annual report for the period 2000-2009, published in the official website of the Indonesia Stock Exchange (www.idx.co.id). In addition other data obtained from various literature related to this research is from books, journals and internet. The method of analysis used in this study is a quantitative method of research methods based on analysis of variables that can be explained by the quantity (measurable) using the formula or definitive analysis tools. The data already collected will be analyzed further to highlight the issue that has been formulated can be missed. The steps of data analysis are as follows:
1. Descriptive Analysis
This analysis is a picture of corporate profitability, market growth and management duties for three years before and three years after the certification of ISO 9000.
2. Statistical Analysis a. Normality Test Data
Prior to hypothesis testing, testing normality of data that aims to test whether the data sample is taken to have a normal distribution or no distribution. Normal distribution has several characteristics, namely: (1) Bell-shaped normal curve and has a peak which is located right in the middle of the distribution; (2) Symmetrical with the arithmetic mean, and (3) Normal curve gently downward to the two the opposite direction from the middle and never intersect with the X axis is often called asymptotically (Lind, 2007). Test for normality in this study using the One-Sample Kolmogorov-Smirnov Test. Decisions obtained from the value Sig. Kolmogorov-Smirnov test (p-value). If the value Sig. > Α = 0.05 is considered normal data distribution. Conversely, if the value Sig. <Α = 0.05 then the distribution of the data is not normal. Testing normality of data was conducted to determine the analyzer to be used in hypothesis testing. If the data are normally distributed then the analysis tool used is a statistical test of t-test. However, if the data are not normally distributed then the analysis tool used is a non-parametik Wilcoxon signed-rank test.
b. Hypothesis Test 1) Test-t
2) Wilcoxon signed-rank test
Testing with the Wilcoxon signed-rank test was used when the data distribution is not normal and the sample used is less than 30. Requirement that is needed is an ordinal data should at least be shaped and both samples should be related / partner (Douglas A. Lind, 2007).
RESULTS AND DISCUSSION
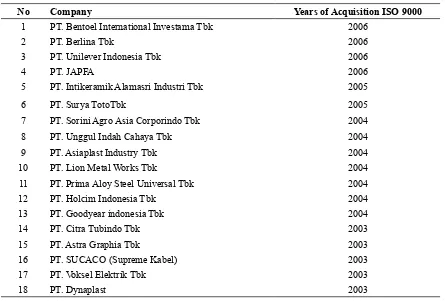
Of searches made of the companies that obtain ISO 9000 certification in the time period 2003-2006, data obtained as follows:
Table 2: Samples Company
No Company Years of Acquisition ISO 9000
1 PT. Bentoel International Investama Tbk 2006
2 PT. Berlina Tbk 2006
3 PT. Unilever Indonesia Tbk 2006
4 PT. JAPFA 2006
5 PT. Intikeramik Alamasri Industri Tbk 2005
6 PT. Surya TotoTbk 2005
7 PT. Sorini Agro Asia Corporindo Tbk 2004
8 PT. Unggul Indah Cahaya Tbk 2004
9 PT. Asiaplast Industry Tbk 2004
10 PT. Lion Metal Works Tbk 2004
11 PT. Prima Aloy Steel Universal Tbk 2004
12 PT. Holcim Indonesia Tbk 2004
13 PT. Goodyear indonesia Tbk 2004
14 PT. Citra Tubindo Tbk 2003
15 PT. Astra Graphia Tbk 2003
16 PT. SUCACO (Supreme Kabel) 2003
17 PT. Voksel Elektrik Tbk 2003
18 PT. Dynaplast 2003
Source: BEI and BSN.
Descriptive analysis
Table 3: The Results of Calculation of the Mean and Standard Deviation Before and After Manufacturing certification of ISO 9000 to 0.21 in the period after the certification of ISO 9000. This suggests that the market growth rate in terms of sales growth increased after the company obtained ISO 9000. So also with a standard deviation of 0.04 this increased from 0.16 to 0.20. This means that the size of the spread of Sales Growth increased by 0.04 from 18 cases that occurred. While the other variables the average has decreased. This decrease is probably due to the increased sales are not comparable with the increase in earnings and the ability to manage liabilities. The company is still focused to increase its sales alone, because he wanted to expand its market share, as proposed Juran (2002) that the main reason for seeking certification is maintenance or expansion of the market. By obtaining ISO 9000 certification, companies are more confident because it can show proof to customers that its product quality. The cost to obtain certification that relatively few companies are not likely to cause increased profits significantly. Similarly in terms of management liability to third parties. Companies prefer not immediately settle their obligations because these obligations have a deadline that already exist and more use of funds and assets held for sale increased.
Normality Test
Normalias test aims to determine whether the distribution of the data follow a normal distribution or close to, ie data with bell-shaped distribution (bell shaped). Good data is data that has a pattern like a normal distribution, namely the data distribution is skewed to the left or skewed to the right.
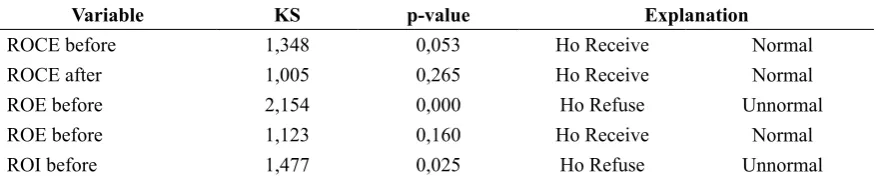
Table 4: Normality Test Results Before and After the ISO 9000 Certification
Variable KS p-value Explanation
ROCE before 1,348 0,053 Ho Receive Normal
ROCE after 1,005 0,265 Ho Receive Normal
ROE before 2,154 0,000 Ho Refuse Unnormal
ROE before 1,123 0,160 Ho Receive Normal
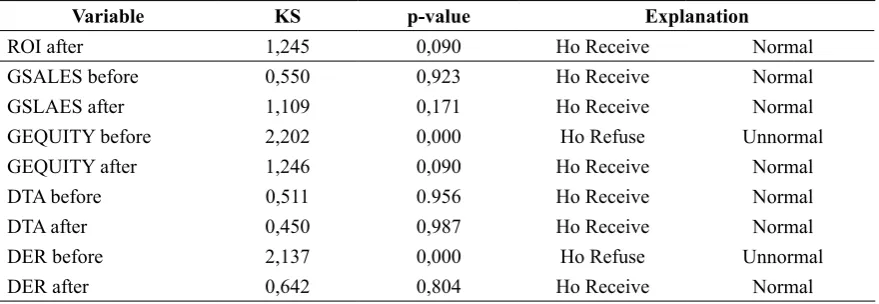
Variable KS p-value Explanation
ROI after 1,245 0,090 Ho Receive Normal
GSALES before 0,550 0,923 Ho Receive Normal
GSLAES after 1,109 0,171 Ho Receive Normal
GEQUITY before 2,202 0,000 Ho Refuse Unnormal
GEQUITY after 1,246 0,090 Ho Receive Normal
DTA before 0,511 0.956 Ho Receive Normal
DTA after 0,450 0,987 Ho Receive Normal
DER before 2,137 0,000 Ho Refuse Unnormal
DER after 0,642 0,804 Ho Receive Normal
Source: The results of data processing
For variable ROCE, GSALES and DTA both before and after the certification of ISO 9000, the data are normally distributed (p> 0.05), so testing on these three variables using the test Paired Sample t test. As for the variable ROE, ROI, GEQUITY and DER in the period before the data are not normally distributed (p <0.05) and for the period after the data is normally distributed (p> 0.05). Thus the test statistic is the Wilcoxon Signed Rank Test.
Hypothesis testing
1. Testing the First Hypothesis
Table 5: Paired Sample t Test Test on Capital Returns Before and After the ISO 9000 Certification Period Average Difference t Count Significant Explanation
Before 0,10 0,05↓ 1,412 0,176 HA1 Refuse
After 0,05
Sources: The results of data processing
The results of comparison on Return On Capital ratio between before and after the company obtained ISO 9000 certification t count of 1.412 and a probability of 0.176 is greater than the significance level of 0.05 (p> 0.05). Thus, Ho is accepted that there is no difference in profitability through the Returns On Capital between before and after the certification of ISO 9000 in Manufacturing company listed in Indonesia Stock Exchange. These results are supported by the decrease in the average value that is equal to 0.05 from 0.10 to 0.05. Thus the first hypothesis is rejected, meaning that there is no difference in profitability as measured by On Capital Returns before and after the certification of ISO 9000 in manufacturing companies listed on the Stock Exchange.
2. Second Hypothesis Testing
Table 6: Wilcoxon Signed Rank Test Test Returns on invested capital before and after ISO 9000 Certification
Period Z Count Significant Explanation
ROI Before-After -0,370 0,711 HA2 Refuse
The results of comparison on the ratio between the returns on invested capital before and after ISO 9000 certification acquired Z count of -0.370 and a probability of 0.711 is greater than the significance level of 0.05 (p> 0.05). Thus Ho is accepted that there is no difference in profitability based on the ratio between the returns on invested capital before and after the company’s ISO 9000 certification in Manufacturing Company listed in Indonesia Stock Exchange. Thus the third hypothesis is rejected, meaning that there is no difference in profitability as measured by returns on invested capital before and after the certification of ISO 9000 in manufacturing companies listed on the Stock Exchange.
3. Third Hypothesis Testing
Table 7: Wilcoxon Signed Rank Test Test Returns On Equity Before and After the ISO 9000 Certification
Period Z Count Significant Explanation
ROE Before-After -0,109 0,913 HA3 Refuse
Source: The results of data processing
The results of comparison on Returns On Equity ratio between before and after the company obtained ISO 9000 certification acquired Z count of -0.109 and a probability of 0.913 is greater than the significance level of 0.05 (p> 0.05). Thus Ho is accepted that there is no difference in profitability based on the Returns On Equity ratio between before and after the certification of ISO 9000 in Manufacturing company listed in Indonesia Stock Exchange. Thus the second hypothesis is rejected, meaning that there is no difference in profitability as measured by Returns On Equity before and after the certification of ISO 9000 in manufacturing companies listed on the Stock Exchange. From the results above profitability, both of ROCE, ROE, or ROI, all three showed no difference before and after the certification of ISO 9000. This result coincides with findings Dimara, Skuras and Tsekouras (2002), where conventional approaches study of the differences of financial performance for firms that adopt ISO 9000 concluded that there was no significant difference in the company’s financial performance in the two time periods. Consequently one could argue that the application of ISO 9000 does not help the company achieve higher levels of financial performance. This shows that with ISO 9000, management has not been able to utilize all company resources to generate profits. It is not in line with ISO 9000 standard which requires companies to always be careful in every action and decision to be taken so as not to cause waste in the company so the company’s performance to be more effective and efficient.
4. Fourth Hypothesis Testing
Table 8: Paired t-test Test Sample Sales Growth Before and After the ISO 9000 Certification
Periode Average Difference t-Count Significant Explanation
Before 0,13 0,08↑ -1,738 0,100 HA4 Refuse
After 0,21
Results on Sales Growth comparison between before and after ISO 9000 certification obtained t count of -1.738 and a probability of 0.100 is greater than the significance level of 0.05 (p> 0.05). Thus, Ho is accepted that there is no significant difference between Sales Growth before and after the company obtained ISO 9000 in Manufacturing company listed in Indonesia Stock Exchange. Although there is an increase in the average value which is equal to 0.08 from 0.30 to 0.21. Thus the fourth hypothesis is rejected it means that there is no difference in the level of market growth through sales growth between before and after the certification of ISO 9000 in manufacturing companies listed on the Stock Exchange.
5. Fifth Hypothesis Testing
Table 9: Wilcoxon Signed Rank Test Test Before and After growth equity ISO 9000 Certification
Period Z Count Significant Explanation
GEQUITY Before-After -0,283 0,777 HA5 Refuse
Source: The results of data processing
The results of comparison on the equity growth rate between before and after ISO 9000 certification acquired Z count of -0.283 and a probability of 0.777 is greater than the significance level of 0.05 (p> 0.05). Thus, Ho is accepted that there is no difference in profitability based on the growth of equity between before and after the company obtained ISO 9000 in Manufacturing company listed in Indonesia Stock Exchange. Thus the fifth hypothesis is rejected it means that there is no difference in profitability as measured by the growth of equity before and after the certification of ISO 9000 in manufacturing companies listed on the Stock Exchange.
From the results of market growth is represented by sales growth and equity growth showed similar results with profitability is no difference before and after obtaining ISO 9000 certification. The results in this study are also consistent with research Dimara, Skuras and Tsekouras (2002). So, the company has obtained ISO 9000 setifikat should be able to give quality products and production processes better than the companies that have not obtained ISO 9000. Based on previous theoretical foundation we already know that the companies that provide better quality will provide a better customer value as well. That way, companies can retain existing customers, attract new customers, and divert the attention of consumer products competitors. This effort will ultimately increase the market share of total sales. Many companies have increased sales experience after obtaining the ISO certificate. With ISO 9000 company is expected to increase its sales from time to time.
6. Sixth Hypothesis Testing
Table 10: Test Sample Paired t test Debt to Total Assets Before and After the ISO 9000 Certification Period Average Difference t-count Significant Explanation
Before 0,60 0,04↓ 0,870 0,397 HA6 Refuse
After 0,56
The results of comparison on Debt to Total Assets between before and after the company obtained ISO 9000 certification t count of 0.870 and a probability of 0.397 is greater than the significance level of 0.05 (p> 0.05). Thus, Ho is accepted that there is no difference in liability management through Debt to Total Assets between before and after the company obtained ISO 9000 in Manufacturing company listed in Indonesia Stock Exchange. These results are supported by the decrease in the average value that is equal to 0.04 from 0.60 to 0.56. Thus the sixth hypothesis is rejected it means that there is no difference in liability management through Debt to Total Assets between before and after the certification of ISO 9000 in manufacturing companies listed on the Stock Exchange.
7. Seventh Hypothesis Testing
Table 11: Wilcoxon Signed Rank Test Test Debt to Equity Ratio Before and After the ISO 9000 Certification
Period Z Count Significant Explanation
DER Before-After -0,501 0,616 HA7 Refuse
Source: The results of data processing
The results of comparison on the Debt to Equity Ratio between before and after the company obtained ISO 9000 certification acquired Z count of -0.501 and a probability of 0.616 is greater than the significance level of 0.05 (p> 0.05). Thus, Ho is accepted that there was no difference in the management of liabilities through the Debt to Equity Ratio between before and after the company obtained ISO 9000 in Manufacturing company listed in Indonesia Stock Exchange. Thus the seventh hypothesis is rejected, meaning that there is no difference in the management of liabilities through the Debt to Equity Ratio before and after the certification of ISO 9000 in manufacturing companies listed on the Stock Exchange. From the results above liability management, represented by the Debt to Equity Ratio and Debt to total assets shows the result that there was no difference before and after obtaining the ISO 9000. These results indicate that the company does not accelerate its obligations to third parties, because the orientation of the ISO 9000 certification is more focused on market expansion and increased sales.
CONCLUSION
Based on the results of data analysis and discussion of results which refers to the problem and research objectives, the research conclusions can be drawn are:
1. For the variable profitability as measured by Return on Capital, the results showed no difference before and after ISO 9000 certification in manufacturing companies listed on the Stock Exchange (Table 4).
3. For the variable profitability as measured by Return on Equity, the results showed no difference before and after ISO 9000 certification in manufacturing companies listed on the Stock Exchange (Table 6).
4. For market growth variables measured by sales growth, the results showed no difference before and after ISO 9000 certification in manufacturing companies listed on the Stock Exchange (Table 7).
5. For variables measured market growth through equity growth, the results showed no difference before and after ISO 9000 certification in manufacturing companies listed on the Stock Exchange (Table 8).
6. For debt management variables measured by Debt to Total Assets, the results showed no difference before and after ISO 9000 certification in manufacturing companies listed on the Stock Exchange (Table 9).
7. For debt management variables measured by Debt to Equity Ratio, the results showed no difference before and after ISO 9000 certification in manufacturing companies listed on the Stock Exchange (Table 10).
Overall results of this study showed similar results ie no difference in the three years before and three years after obtaining ISO certification. Because this study focuses only on manufacturing companies, who produce products in their business activities. No significant change after such companies obtain ISO 9000, showed that lack of consumer awareness of the importance of quality. Consumers in purchasing a quality product is no longer making as the main reason, but many factors, one of which is the price. Products with good quality will definitely have a higher value or more expensive. In today’s era of free markets, products imported mainly from China have flooded the market at a price much cheaper than local products. Actually people aware that imported products have no better quality than local products, but because the goods are sold at a price that can be reached, then the public would prefer to buy imported products than to buy local products.
Future studies are expected to not only research on manufacturing firms only, but also include a sample of the entire company went public on the Stock Exchange who has received the ISO 9000 certificate. In addition, further research samples not only on companies listed on the Stock Exchange alone, but also take samples of the other companies which have not go public on the Stock Exchange. Study period should be extended as 4 years before and after 4 years, so it is expected that the resulting conclusions can be generalized, and able to prove the hypothesis presented.
REFERENCES
Angel R. Martínez-Lorente, Micaela Martínez-Costa. 2004. “ISO 9000 and TQM: substitutes or complementaries?: An empirical study in industrial companies”, International Journal of Quality & Reliability Management, Vol. 21 Iss: 3 : 260 – 276.
Proyek Peningkatan Penelitian Pendidikan Tinggi Direktorat Jenderal Pendidikan Tinggi, Departemen Pendidikan Nasional.
Brealey, Myers & Marcus. 2009. “Dasar-Dasar Manajemen Keuangan Perusahaan”, Jilid 1, Edisi 5, Jakarta:Erlangga.
Blocher, Edward J., Kung H. Chen, dan Thomas W. Lin. 2000. Manajemen Biaya dengan Tekanan Stratejik. Terjemahan A. Susty Ambarriani. Jakarta : Salemba Empat.
Chow-Chua, C., Goh, M., dan Tan, B.W. 2003. “Does ISO 9000 Certification ImproveBusiness Performance?”. The International Journal of Quality & Reliability Management, Vol. 20. Cornelius Thihendradi, 2005, Step by Step SPSS 13. Analisis Data Statitik, Yogyakarta: Andhi. Dimara, E., Skuras, D., Tsekouras, K., dan Goutsos, S. 2004. “Strategic Orientation and Financial
Performance of Firms Implemening ISO 9000”. The International Journal of Quality & Reliability Management, Vol. 21.
Eugene F Brigham &, Michael C. Ehrhardt. 2006 . “Financial Management”. Dasar-dasar Manajemen Keuanan, Edisi ke-10. Jakarta. Salemba Empat.
Frank Martin Aarts, Ed Vos. 2001. “The impact of ISO registration on New Zealand firms’ performance: a financial perspective”, The TQM Magazine Vol 13 Iss: 3 : 180 – 191. Gitman, Lawrence J. 2000. Principles of Managerial Finance, International edition, Ninth Edition,
San Diego State University, Canada.
Gotzamani, K. and Tsiorast, G. 2002. “The True Motivies Behind ISO 9000 Certification”. International Journal of Quality & Reliabilty Management, Vol. 19, No. 2.
Garvin, David A. 1988. Managing Quality: The strategic and competitive edge. New York: Free Press. Dalam Sri Arini A. 2000. Analisis Perbedaan Kinerja Keuangan Perusahaan yang Bersertifikat ISO 9000 dengan Perusahaan yang Tidak Bersertifikat ISO 9000: Studi pada Perusahaan Manufaktur yang Terdaftar di Bursa Efek Jakarta, Tesis Publikasi. Malang:UNIBRAW.
Harahap, Sofyan Syafri. 2006. Analisis Rasio Keuangan. Jakarta, Salemba Empat.
Haversjo, T. 2000. “The Financial Effects of ISO 9000 Certification for Danish Companies”. Managerial Auditing Journal, Vol.15, No.1.
Heras, I., Casadesus, M, Dick, G. 2002. “ISO 9000 Certification and The Bottom Line: A Comparative Study of the Profitability of Basque Region Companies”. Managerial Auditing Journal, Vol.17.
Higgins, Robert C. 2003. Analysis for Financial Management, 6th Edition, Singapore: McGraw-Hill Book Co.
Juran, J.M., Godfrey, A.B. 2002. Juran’s Quality Handbook. 5th Edition. McGraw-Hill, New York. Lind, Douglas A. dan Robert D. Mason. 2007. “Teknik-Teknik Statistika dalam Bisnis dan Ekonomi”
(Alih Bahasa: Ellen Gunawan Sitompul, dkk), Edisi 9, Jilid 1, Jakarta: Erlangga.
Naser, K., Khabhari, Y. dan Mokhtar, M.Z. 2004. “Impact of ISO 9000 Registration on Company Performance: Evidence for Malaysia”. Managerial Auditing Journal, Vol. 19.
Santoso, Singgih. 2010. “Panduan lengkap menguasai Statistik dengan SPSS 16”. Elex Media Computindo.
Suardi, Rudi. 2003. Sistem Manajemen Mutu ISO 9000:2000. Jakarta, PPM.
Syahyunan. Analisis kualitas aktiva produktif sebagai salah satu alat ukur kesehatan bank. Fakultas Ekonomi Universitas Sumatera Utara.
Tjiptono, Fandy. 2003. Total Quality Management. Yogyakarta, Andi.
Yahya, S and Goh, W.K. 2001. “The implementation of an ISO 9000 quality system”, International Journl of Quality and Reliability Management, Vol. 18 No. 9 : 941-66.
Van Horne and Wachowicz. 2007. “Fundamentals of Financial Management”. Indonesian Capital Market Directory.