*Corresponding author:
E-mail: [email protected]; [email protected]
Strengthening No: 36b/E/KPT/2016 Available online at http://medpet.journal.ipb.ac.id/
The Relationship Analysis between Service Performances of Milk Producer
Cooperative with the Dairy Farm Performance of Members
A. Asmaraa,*, Y. L. Purnamadewia, & D. Lubisb
aDepartment of Economics, Faculty of Economics and Management, Bogor Agricultural University bDepartment of Sharia Economics, Faculty of Economics and Management, Bogor Agricultural University
Kampus IPB Darmaga, Bogor 16680, Indonesia
(Received 28-11-2016; Reviewed 08-03-2017; Accepted 21-06-2017)
ABSTRACT
The main objective of Milk Producers Cooperative (MPC) is to provide services to the members and improve the performance of dairy farm of MPC members. The purposes of this study were: (1) to analyze dairy farm performance of MPC members, (2) to analyze performance of MPC services, and (3) to analyze the relationship between service performance of MPC with dairy farm performance of MPC members. The main data used were primary data. The analytical methods used included:
descriptive analysis, profit analysis and R/C Ratio, and Chi-Square. The study showed that produc
-tivity and profitability of large-scale dairy farm was higher than small-scale. The performance of small-scale dairy farm of MPC members was relatively low both in terms of productivity and profit -ability. Most members judged that the performance of MPC services was good. There was a positive
relationship between the MPC service performance (milk marketing, finance, technical assistance, and education/training) with the performance of dairy farm of MPC members. Coaching and more
intensive services should continue to be given by the MPC to the members, especially the members with the small-scale dairy farms.
Keywords: service performance, milk producerscooperative, dairy farm
ABSTRAK
Tujuan utama dibentuknya Koperasi Produsen Susu (KPS) adalah untuk memberikan pela-yanan kepada anggota dan meningkatkan kinerja usaha peternakan sapi perah anggota. Tujuan studi ini adalah: (1) menganalisis kinerja usaha ternak anggota KPS, (2) menganalisis kinerja pelayanan KPS, dan (3) menganalisis hubungan kinerja pelayanan KPS dengan kinerja usaha ternak sapi perah anggota. Data utama yang digunakan adalah data primer. Metode analisis yang digunakan meliputi:
analisis deskriptif, analisis keuntungan, R/C Ratio, dan Chi-Square. Hasil studi menunjukkan bahwa
produksi sapi laktasi dan profitabilitas usaha ternak sapi perah skala besar lebih tinggi dari skala
kecil. Kinerja usaha ternak sapi skala kecil pada anggota KPS relative rendah baik dari segi
produk-tivitas maupun profitabilitas. Sebagian besar anggota menilai bahwa kinerja pelayanan KPS sudah
baik. Terdapat hubungan positif antara kinerja pelayanan KPS (pemasaran susu, pembiayaan,
kon-sultasi, dan pendidikan/pelatihan) dengan kinerja usaha ternak anggota. Pembinaan dan pelayanan
yang lebih intensif perlu terus diberikan oleh KPS kepada anggota, terutama anggota dengan usaha peternakan sapi perah skala kecil.
Kata kunci: kinerja pelayanan, koperasi produsen susu, usaha ternak sapi perah
INTRODUCTION
Dairy farm is one of the business activities in the livestock subsector that has the potential to be devel-oped. The development of the population of dairy
ASMARA ET AL. / Media Peternakan 40(2):143-150
In Indonesia, a dairy farm with small-scale business is the most dominant. This phenomenon is characterized by a pattern that is still traditional and family-based labor. Meanwhile, large-scale farming are generally managed with a better management and the use of labor from outside the family. Asmara et al. (2016) indicated a difference in the gains of dairy cattle business between small-scale and large-scale farms.
In conducting the business, generally farmers join the cooperative institutions. The Milk Producer Cooperative (MPC) is the primary cooperatives, which are at the sub-district level (for one sub-districts, there is only one cooperative) and organize dairy farmers who become members. Mazzarol et al. (2013) suggested that cooperatives could offer substantial value to their members in the form of access to resources, sharing of knowledge and information.
Cooperatives have the potential to have the com-petitiveness. Yang & Liu (2012) stated that the farmer cooperative formed by a series of contracts and on the principle of reciprocity could reduce transaction costs. Kunte & Patankar (2015) stated that cooperatives have positive impact on milk production and income gen-eration. Furthermore, Khan et al. (2014) stated that the important role of dairy cooperatives in the marketing of milk and provided the necessary supports for dairy farmers leading to their socio-economic development.
However, the empirical evidence in Indonesia showed that the majority of dairy farms of cooperative members had not yet reached the level of income as expected. Kartikasari et al. (2015) showed that a dairy
farm in the Cooperative Mahesa in Jember was not in accordance with the standards of agroecology and was not financially feasible. Meanwhile, Emawati (2011) stated that the investment in the dairy farm of the farmer members of Dairy Cattle Farm of Kaliurang Cooperative, Sleman was financially feasible. Astuti et al. (2010) revealed that farmer members of Kaliurang Cooperative were technically not rational (elasticity of production (Ep) > 1) in the use of production factors. Departing from the phenomenon, the main question in this study is whether there is a relationship of service performance with the performance of cooperative dairy farm members. The objectives of this study were: (1) to analyze the dairy farm performance of MPC members, (2) to analyze the performance of MPC services, and (3) to analyze the relationship between the MPC service performances with business performance of members.
METHODS
The study was conducted in East Java and West Java as the centers of dairy cattle production in Indonesia. However, the different agro-ecosystems and socio-cultural conditions of farmers in the region were expected to bring their differences or diversities in the business pattern, which then affected the variability in the achievements of business performances.
For selected areas in East Java was Pasuruan, and for West Java was in Bandung. Those locations were chosen because those two locations were not only being the centers of dairy cattle production but also there were
a number of MPCs that were relatively developed so that both locations were expected to be representative.
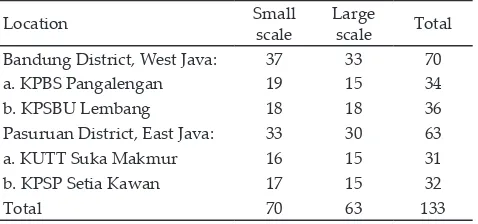
The main data used in the study were primary data. Those were collected through interviews using a questionnaire to the members of dairy cooperatives. The samples were selected by stratified random sampling method which was based on the scale of activities of livestock (small scale and large scale). A farmer was cat-egorized into small scale when it had the number of lac-tating cows up to 5 heads and large scale if it had more than 5 lactating cows. The distribution of the sample based on the region and business scale is presented in Table 1.
Data collected were analyzed using descriptive analysis, analysis of profit and R/C Ratio, and Chi-Square analysis. Descriptive analysis were used to de-scribe the characteristics of dairy farms and MPC service performance. MPC service performance was measured from the perspective of the farmer members by using Likert scale from 1 (very low) to 5 (high). Meanwhile, analysis of business profits and R/C ratio was used to measure the performance of the livestock business carried on by members of the cooperative farmers. The formula for calculating the profit of business was as follows:
TP= TR - TC ……….………..(1) where:
TP= Total profit (Rp) TR= Total revenue (Rp) TC= Total cost (Rp)
Meanwhile, R/C Ratio was the ratio of TR to TC. If the revenue that was achieved was lower than the cost of a business carried on, then the business was not profitable (loss) and vice versa. Thus, if the value of R/C ratio was greater than one, then the business which car-ried on was already profitable, while if it’s less than one, it meant that the business carried on was unprofitable. Analysis of the level of business profits and R/C Ratio was based on the cash costs and total costs.
Chi Square was used to analyze the relationship
between the performance of cooperative’s services (from the perspective of members) and business performance of livestock cooperative members. Hypotheses for test-ing were:
Ho : performance of cooperatives service and
perfor-Table 1. Distribution of respondents by region and business scale
Location Small scale Large scale Total
Bandung District, West Java: 37 33 70
a. KPBS Pangalengan 19 15 34
b. KPSBU Lembang 18 18 36
Pasuruan District, East Java: 33 30 63
a. KUTT Suka Makmur 16 15 31
b. KPSP Setia Kawan 17 15 32
Total 70 63 133
ASMARA ET AL. / Media Peternakan 40(2):143-150
mance of farm business members is independent (There is no association)
Hi : performance of cooperative service and the per-formance of the livestocks business members are dependent (There is association)
Territory criticism for hypothesis testing were:
If χ2
account > χ 2
α(v) then Ho was not accepted
If χ2
account < χ 2
α(v) then Ho was accepted
(α= significance level, v= degree of freedom)
The formula to calculate Chi Square was as follows:
6
Oij= the observations frequency in the row i and column j
Eij= The theoretical frequency (expectations) in the row i and column j
To calculate the theoretical frequency used the for-mula: was the total of frequency in the coloumn j, and T.. was the total frequency of observations.
RESULTS
Milk Producers Cooperative Profiles in the Study
Areas
The number of members of the four cooperatives samples is presented in Table 2. Based on the table, it was known that the number of members in each MPC was likely to increase, unless the KPBS Pangalengan which tended to decrease.
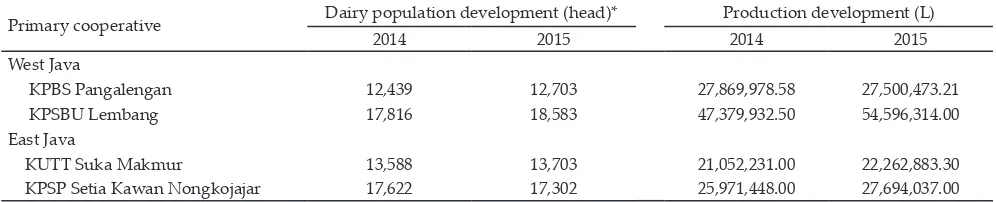
Unlike the member development, the development of the cattle population in the KPBS Pangalengan was increased. However, milk production was decreased. The decline in milk production was also occurred in KPSP Setia Kawan Nongkojajar. The decline was in line with the decline in population. It was an indication that the business of dairy cattle run by the members was not able to develop as expected. Meanwhile, for the two other cooperatives (KPSBU Lembang and KUTT Suka
Makmur) the population and milk production were increased (Table 3).
Furthermore, the business units run by MPC are presented in Table 4. Based on the table, it was known that the business-related services and marketing milk production was the main business unit which became the core business of MPC.
Characteristics and Business Performance of Dairy Farm of MPC Members
The results of analysis on the characteristics and performance of dairy farm of MPC members showed that the dairy farms of the MPC members in West Java were better than in East Java (Table 5).
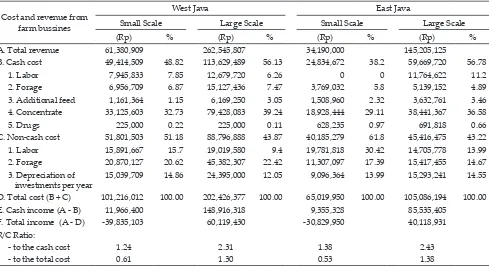
However, Table 6 showed that although the pro-ductivity of dairy farm of the MPC members in West Java was relatively high, the profitability of its business, as measured by the value of R/C ratio (the ratio of rev-enue to costs, cash costs in particular) in East Java was higher than in West Java. The facts also showed that in both provinces, profitability of large-scale dairy farm was greater than the small-scale dairy farm, almost twice as much.
Milk Producers Cooperative (MPC) Services Performance from Member Perspective
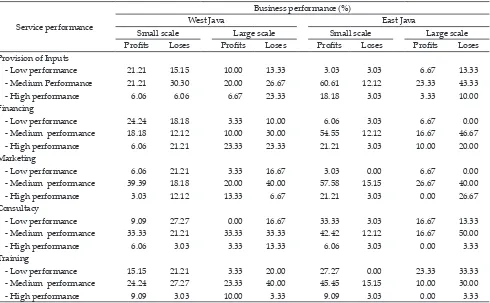
The results of the analysis of the MPC service performance according to the members perception are shown in Table 7. The tables showed that in general
Source: Reports of each cooperative
Table 2. The development of milk producers cooperative (MPC) members in the study area
Cooperative
Members development
2014 2015
West Java
KPBS Pangalengan 5,050 4,813
KPSBU Lembang 7,091 7,190
East Java
KUTT SukaMakmur 2,259 2,744
KPSP Setia Kawan Nongkojajar 8,252 8,484
Tabel 3. The development of dairy population and milk production of milk producers cooperative (MPC) in the study area
Primary cooperative Dairy population development (head)* Production development (L)
2014 2015 2014 2015
West Java
KPBS Pangalengan 12,439 12,703 27,869,978.58 27,500,473.21
KPSBU Lembang 17,816 18,583 47,379,932.50 54,596,314.00
East Java
KUTT Suka Makmur 13,588 13,703 21,052,231.00 22,262,883.30
KPSP Setia Kawan Nongkojajar 17,622 17,302 25,971,448.00 27,694,037.00
ASMARA ET AL. / Media Peternakan 40(2):143-150
Table 5. The average number of dairy cattle and the performance of milk production of the milk producers cooperative (MPC) mem
-bers in the study area
Description West Java East Java
1 2 1 2
The average ownership of lactating cow (head) 2.59 9.79 1.82 8.03
The average ownership of total dairy cow (head) 5.71 16.58 4.48 11.83
The average production (L/cow/day) 13.03 14.24 10.5 10.97
Calving interval (day) 409 403 411 405
Service per conception 2.88 2.15 2.34 2.22
Length of lactation (day) 295 307 305 305
The price of milk (Rp/L) 4309 4438 4564 4640
The price of concentrate (Rp/kg) 3350 3345 4564 4603
Note: 1= small scale (ownership of lactating cows up to 5 heads); 2= large scale (ownership of lactating cows more than 5 heads)
Table 6. Analysis of profit and R/C ratio farming business of milk producers cooperative (MPC) members in the study area
Cost and revenue from farm bussines
West Java East Java
Small Scale Large Scale Small Scale Large Scale
(Rp) % (Rp) % (Rp) % (Rp) %
A. Total revenue 61,380,909 262,545,807 34,190,000 145,205,125
B. Cash cost 49,414,509 48.82 113,629,489 56.13 24,834,672 38.2 59,669,720 56.78
1. Labor 7,945,833 7.85 12,679,720 6.26 0 0 11,764,622 11.2
2. Forage 6,956,709 6.87 15,127,436 7.47 3,769,032 5.8 5,139,152 4.89
3. Additional feed 1,161,364 1.15 6,169,250 3.05 1,508,960 2.32 3,632,761 3.46 4. Concentrate 33,125,603 32.73 79,428,083 39.24 18,928,444 29.11 38,441,367 36.58
5. Drugs 225,000 0.22 225,000 0.11 628,235 0.97 691,818 0.66
C. Non-cash cost 51,801,503 51.18 88,796,888 43.87 40,185,279 61.8 45,416,475 43.22
1. Labor 15,891,667 15.7 19,019,580 9.4 19,781,818 30.42 14,705,778 13.99
2. Forage 20,870,127 20.62 45,382,307 22.42 11,307,097 17.39 15,417,455 14.67 3. Depreciation of
investments per year
15,039,709 14.86 24,395,000 12.05 9,096,364 13.99 15,293,241 14.55
D. Total cost (B + C) 101,216,012 100.00 202,426,377 100.00 65,019,950 100.00 105,086,194 100.00
E. Cash income (A - B) 11,966,400 148,916,318 9,355,328 85,535,405
F. Total income (A - D) -39,835,103 60,119,430 -30,829,950 40,118,931
R/C Ratio:
- to the cash cost 1.24 2.31 1.38 2.43
- to the total cost 0.61 1.30 0.53 1.38
Table 4. Milk producers cooperative (MPC) business development in the study area
Primary cooperative Cooperative business developments
West Java
KPBS Pangalengan (1) Unit of production services (2) Unit of processing and marketing services (3) Unit of goods services, feed and vehicles (4) Unit of feed processing (5) Unit of nursery and HMT services (6) Unit of veterinary services and member (7) Unit of PT. BPR Bandung Kidul
KPSBU Lembang (1) Production (2) Marketing and milk quality (3) Feed concentrates (4) Processing of milk (5) Waserda (6) Cattle farming (7) Credit
East Java
KUTT Suka Makmur (1) Unit of agri-service (2) Unit of Kejayaan PMT (3) Unit of savings and loans (4) Unit of SP2T (5) Unit of G-Mart (6) Unit of G-Logistic
the MPC members in East Java and West Java assessed that the services provided by the MPC to the members for all of its services were good. Most of the members considered that MPC’s service delivery in terms of input provision, financing, marketing, consultation, and train-ing had medium and high performances.
The Relationship Between MPC Services Performance with Performance of Dairy Farm of MPC Members
Results of the analysis of the relationship between MPC service performance and dairy farm performance of MPC members are shown in Table 8. The result of Chi-square analysis showed that there was a difference in relationship between MPC service with dairy farm performance of the MPC members between East Java and West Java as well as between small and large scale. In East Java, MPC service performance only affected large scale dairy farm performance and did not affect small-scale dairy farm performance. While in West Java, MPC service performance influenced both small and large-scale dairy farm performed differently.
DISCUSSION
Characteristics and Business Performance of Dairy Farm of MPC Members
Productivity of the milk produced is the main char-acteristics of the production, as already in Table 5. The
Note: ***Significance level of α= 1%; **Significance level of α= 5%; *Significance level of α= 20%..
Services
Cattle business performance
West Java East Java
Small scale
Large scale
Small scale
Large scale
X2 X2 X2 X2
Provision of inputs
0.833 1.155 1.470 0.150
Financing 3.436* 2.010 0.637 4.421*
Marketing 7.133** 3.445* 0.509 8.400** Technical
assistance
7.446** 39.569*** 3.082 3.125
Training/ Education
1.363 4.041* 2.750 1.346
Table 8. Chi-Square values between performances of coopera
-tive service and performances of farming coopera-tive members
Tabel 7. Assessment distribution of respondents on services performance of milk producers cooperative (MPC) and cross tabulation with dairy farm business performances of MPC member
Service performance
Business performance (%)
West Java East Java
Small scale Large scale Small scale Large scale
Profits Loses Profits Loses Profits Loses Profits Loses
Provision of Inputs
- Low performance 21.21 15.15 10.00 13.33 3.03 3.03 6.67 13.33
- Medium Performance 21.21 30.30 20.00 26.67 60.61 12.12 23.33 43.33
- High performance 6.06 6.06 6.67 23.33 18.18 3.03 3.33 10.00
Financing
- Low performance 24.24 18.18 3.33 10.00 6.06 3.03 6.67 0.00
- Medium performance 18.18 12.12 10.00 30.00 54.55 12.12 16.67 46.67
- High performance 6.06 21.21 23.33 23.33 21.21 3.03 10.00 20.00
Marketing
- Low performance 6.06 21.21 3.33 16.67 3.03 0.00 6.67 0.00
- Medium performance 39.39 18.18 20.00 40.00 57.58 15.15 26.67 40.00
- High performance 3.03 12.12 13.33 6.67 21.21 3.03 0.00 26.67
Consultacy
- Low performance 9.09 27.27 0.00 16.67 33.33 3.03 16.67 13.33
- Medium performance 33.33 21.21 33.33 33.33 42.42 12.12 16.67 50.00
- High performance 6.06 3.03 3.33 13.33 6.06 3.03 0.00 3.33
Training
- Low performance 15.15 21.21 3.33 20.00 27.27 0.00 23.33 33.33
- Medium performance 24.24 27.27 23.33 40.00 45.45 15.15 10.00 30.00
- High performance 9.09 3.03 10.00 3.33 9.09 3.03 0.00 3.33
ASMARA ET AL. / Media Peternakan 40(2):143-150
good reproductive condition (calving interval, service per conception, and long lactation).
Factors affecting the milk production are stated in the studies reported by Weglarzy (2009) and Pasaribu
et al. (2016). Weglarzy (2009) stated that lactation
pro-ductivities of dairy cows were affected by the length of preceding dry period. Pasaribu et al. (2016) stated that variations in milk production of dairy were determined by variations in the amount of feed, the amount of drinking water, the age of livestock, the size of the cow-shed, and the milking interval.
The other findings of the characteristic of the dairy farm are profitability or Revenue-Cost analysis (Table 6). The first finding was that although the productivity of dairy farm of the MPC members in West Java was rela-tively high, but the profitability of its business, in East Java was higher than in West Java. The value of R/C ra-tio (cash costs in particular) of dairy farm of MPC mem-bers in East Java reached 1.38 and 2.43, respectively, for each of the small-scale and large-scale business; while in West Java for a similar business scale, the R/C ratio only reached 1.24 and 2.31.
The second finding related to the profitability of the dairy farm was that in both provinces, profitability of large-scale dairy farm was greater than that of small-scale dairy farm, almost twice as much; even if the non-cash expenses were taken into account, small-scale dairy farm was not profitable, meanwhile large-scale dairy farm still had a positive profit. If all costs were taken into account, small-scale dairy farm got a negative gain (loss) with the value of R/C of 0.53 in East Java and 0.61 in West Java. These results implied that for every 1 rupiah costs, it will only gain 0.53 rupiah of revenue for small-scale dairy farm in East Java and it will only gain 0.61 rupiah of revenue for small-scale dairy farm in West Java.
The results of this study confirm that small-scale businesses have poorer performance than large-scale businesses, although the service cooperatives received were same. Thus, the differences of profit between small and large scale dairy farm are due to the differences in business management. Small-scale farmers generally run the business with a pattern as was done by previ-ous generations. Limitations in the capital owned causes the production inputs is not used properly. Concentrate feed is often replaced with other feed ingredients with lower qualities such as bran or tofu. Meanwhile, large-scale farmers run the business with a better manage-ment system. In addition, large-scale farmers provide forage and concentrates with a good quality and apply the recommended technology of livestock farming. Moran (2009) stated that high quality forages and con-centrates are essential for profitable dairy farm.
These results were also consistent with the analysis of efficiency which showed that large-scale businesses were relatively more efficient than small-scale busi-nesses (Asmara et al., 2016). The results of Herrero et al.
(2010) and Masuku et al. (2014), also revealed that one of the factors that significantly affected economic ef-ficiency of dairy farmers was herd size or the number of dairy cattle ownership with a positive impact. Related
to business profit, Sari et al. (2013) stated that the dairy farm was not profitable. Meanwhile, Halolo et al. (2013a) stated that the dairy farm business was profitable and Halolo et al. (2013b) stated that the dairy farm was
ef-ficient. Santosa et al. (2013) revealed that the R/C ratio of dairy farm was 1.28.
In accordance with the previous description that analyzes the differences in the rate of profit and R/C ratio on the small scale and large scale businesses indi-cated that the results of this study confirm the findings of previous studies. The results of this study were able to show that the business of dairy farm run by MPC members get benefit (R/C ratio> 1) and some suffer losses (R/C ratio <1).
The fact in this study that the profitability of small and large scale dairy farm in East Java was higher than in West Java is possible because the cost of dairy farm in East Java is relative smaller than in West Java (Table 6). Meanwhile, the output price in East Java was higher than in West Java (Table 5).
Based on the comparison of revenue and cash cost, it was known that the cash cost portion reaches 80.5% and 43.3% for small scale and large scale in West Java. While in East Java, the share of cash cost on revenues was 72.6% in small scale and 41.1% in large scale dairy farms. With the share of these costs, the profit of dairy farm in East Java was relatively more profitable than in West Java. The cost of purchasing concentrates was the largest cash costs in the dairy farm
Differences in profit between West Java and East Java, are not only due to differences in costs but also dif-ferences in output prices. The effects of cost and output price on profit are also expressed by Kristoro (2014). Kristoro (2014) stated that dairy farm in Semarang Regency was feasible. Nevertheless, the low selling price at farmers level and the high cost of milk production makes the farmers gain little profit.
Meanwhile, Saha (2014) stated that the dairy farm had a lot of potential to improve rural incomes, nutri-tion, and women empowerment, and hence it was a very critical area for investment. In line with Saha (2014), Kusnadi & Juarini (2007) revealed that the increase of income in the dairy farm could be done through the implementation of economical dairy farm management.
Milk Producers Cooperative (MPC) Services Performance from Member Perspective
The result in Table 7 showed that most of the MPC members in both West Java and East Java felt that the performance of services provided by the cooperative already excellent (middle-high performance). These finding was in line with the studies of Nugroho & Dedi (2011), Nurfitriani & Husnah (2013), and Liang et al.
(2015).
that each dimension of social capital had a significant and positive impact on the economic performances of cooperatives.
The Relationship Between MPC Services Performance with Performance of Dairy Farm of MPC Members
Result of analysis showed that there was a relation
-ship between the performances of MPC services to the
dairy farm performance of the members (Table 8). The
relationship between the variables of service perfor -mance and the perfor-mance of businesses member
found either on cooperative members with small scale or large-scale, except for the small-scale farming in East Java. Result of that study is supported by others studies, Tanwar et al. (2015), McRoberts et al. (2013) and Phadi (2014).
Tanwar et al. (2015) showed that annual milk
pro-duction and annual net income were significantly higher in cooperative members compared to non-cooperative member. McRoberts et al. (2013) concluded that the co-operative potentially could increase community incomes while controlling risk under a range of environmental and market conditions.. Meanwhile, Phadi (2014) stated that the dairy cooperatives play an important role for rapid development of rural people.
Chi-square analysis result also showed that there is different types of MPC services that affect the dairy farm performance of scale business and inter-region. However, all dairy farms of small and large scale businesses, in West Java and East Java were influenced by the marketing service of The MPC. This result in line with Kavoi et al. (2010) which states that one of the key
avenues for increasing efficiency for smallholder dairy cattle is to address the institutional and socio economic infrastructure.
Marketing milk, financing, consulting, and train-ing for members are cooperative services that have a relationship with the member’s business performance. Provision of input service has no significant corelation-ship to the dairy farm of the members, meanwhile mar-keting is an MPC service that has an effect on all dairy farms in West Java and East Java. Services in marketing milk that provides convenience and certainty of the market and the price is reasonable for members to sell the products (milk) produced that will provide an incen-tive for members to increase production.
Priyono & Priyanti (2015) states that strengthen-ing of dairy cooperatives in dairy cattle area is quite effective in supporting the development of dairy cattle population and milk production because the coopera-tive institution is one of marketing nodes of milk that has a strategic role. Asih et al. (2013) indicates that the existence of cooperatives as a core industry in the dairy industry cluster in Semarang Regency has a big role in the marketing of milk.
Meanwhile, with the services of consulting and training provided by the cooperative, it is hoped, will improve the knowledge and skills of cooperative mem-bers in carrying out his business. According to Sheela & Ramegowda (2013), more training should be given to stimulate interests and commitment of members. Utami
et al. (2014) stated that the role of cooperatives will affect
the performance of cooperative members in producing quality milk.
Capital constraints often make the cooperative members are not able to do business development. Therefore, the service in terms of capital will help the members of the cooperative in meeting capital require-ments. The cooperative is one of alternative source of financing for dairy farm because the constraints faced. Study of Sulistyati et al. (2013) describes the importance of the capital to encourage their dairy farms.
CONCLUSION
In general, the performance of the dairy farms of the MPC members measured by productivity and profitability still needs to be improved. Productivity and profitability of large-scale dairy farm was higher than small-scale. Performance of small-scale dairy farm of the MPC members was relatively low both in terms of profitability and productivity. Profitability of dairy farm in East Java was higher than in West Java. Based on the members' perception, most of members judge that the performance of MPC services (provision of input, financing, marketing, technical assistance and training) was good (middle and high performances), but there was little difference in the assessment between regions and between scale of the dairy farms. There was a posi-tive relationship between the MPC service performance (milk marketing, finance, technical assistance, and edu-cation/training) with the performance of dairy farms of MPC members, but only marketing service that affects the dairy farm in both East Java and West Java and both small and large-scale dairy farms. Coaching and more intensive services should continue to be given by the MPC to the members, especially the members with the small-scale dairy farms.
REFERENCES
Asih, R., T. W. Murti, & F. T. Haryadi. 2013. Dynamics of dairy industry cluster development in Semarang Regency, Central Java. Article in Indonesian. Buletin Peternakan 37: 59-66. https://doi.org/10.21059/buletinpeternak.v37i1.1960 Asmara, A., Y. L. Purnamadewi, & D. Lubis. 2016. Keragaan
produksi susu dan efisiensi usaha peternakan sapi perah rakyat di Indonesia. Jurnal Manajemen & Agribisnis 13: 14-25. https://doi.org/10.17358/JMA.13.1.14
Astuti, M., R. Widiati, & Y. Y. Suranindyah. 2010. Production efficiency of smallholder dairy cattle farming (Case study on the farmer members of dairy cattle farm of Kaliurang Cooperative, Sleman, Yogyakarta). Article in Indonesian.
Buletin Peternakan 34: 64–69. https://doi.org/10.21059/bu
-letinpeternak.v34i1.108
Emawati, S. 2011. Profitability of dairy cattle farm in Sleman District. Article in Indonesian. Sans Peternakan 9: 100-108. https://doi.org/10.20961/sainspet.9.2.100-108
Halolo, R. D., S. I. Santoso, & S. Marzuki. 2013a. Analisis prof-itabilitas pada usaha peternakan sapi perah di Kabupaten Semarang. Jurnal Pengembangan Humaniora 13: 65-72. Halolo, R. D., S. I. Santoso, & S. Marzuki. 2013b. Efisiensi
usaha peternakan sapi perah di Kabupaten Semarang. Agromedia 31: 1-8.
ASMARA ET AL. / Media Peternakan 40(2):143-150
Profit efficiency among Kenyan smallholder milkproduc
-ers: A case study of Meru-South District, Kenya. African Journal of Agricultural Research 5: 332-337.
Kartikasari, C. A., Soetriono, & E. B. Koentadi. 2015. Analisis
kelayakan finansial dan strategi pengembangan peter
-nakan sapi perah pada Koperasi Mahesa di Kabupaten Jember. Berkala Ilmiah Pertanian x: 1-10.
Kavoi, M. M., D. L. Hoag, & J. Pritchett. 2010. Measurement of economic efficiency for smallholder dairy cattle in the Marginal Zones of Kenya. Journal of Development and Agricultural Economics 2: 122-137.
Khan, N., A. K. Parashari, & M. S. Salman. 2014. Role of dairy co-operatives in socio-economic development of dairy farmers in Moradabad District: a case study. International Journal of Social Sciences 2: 1-8).
Kristoro, A. 2014. Analisis profit marjin susu sapi perah di Kecamatan Ungaran Kabupaten Semarang. Economics Development Analysis Journal 3: 345-354.
Kunte, B. S. & S. Patankar. 2015. A literature review of Indian
Dairy Industry. International Journal of Management Research & Review 5: 341-350.
Liang, Q., Z. Huang, H. Lu, & X. Wang. 2015.Social capital, member participation, and cooperative performance: Evidence from China’s Zhejiang. International Food and Agribusiness Management Review 18: 49-78.
Masuku, B. B., M. B. Masuku, & A. Belete, 2014. Economic efficiency of smallholder dairy farmers in Swaziland: An application of the profit function. Journal of Agricultural Studies 2: 132-146. https://doi.org/10.5296/jas.v2i2.6046 Mazzarol, T., E. M. Limnios, & S. Reboud. 2013. Co-operatives
as a strategic network of small firms: Case studies from Australian and French co-operatives. Journal of Co-operative Organization and Management 1: 27–40. https:// doi.org/10.1016/j.jcom.2013.06.004
McRoberts, K. C., C. F. Nicholson, R. W. Blake, T. W. Tucker, & G. D. Padilla. 2013. Group model building to assess ru-ral dairy cooperative feasibility in South-Centru-ral Mexico. International Food and Agribusiness Management Review16: 55-98.
Ministry of Agriculture. 2016. Populasi dan Produksi Peternakan di Indonesia. http: //www.pertanian.go.id/
Indikator/tabel-4-pop-prod-nak.pdf. [15 February 2017].
Nugroho, B. A. & Dedi. 2011. The analysis of balanced score-card (BSC) in evaluating the performance of KUD “DAU” Malang. Article in Indonesian. Agrise XI:65-80.
Nurfitriani, S. & N. Husnah. 2013.Analisis tata kelola dan
kiner-ja koperasi peternak sapi di Jawa Barat. Jurnal Pengkajian Koperasi dan UKM 8: 41-57.
Pasaribu, A., Firmansyah, & N. Idris. 2016. Analisis faktor-faktor yang mempengaruhi produksi susu sapi perah di Kabupaten Karo Provinsi Sumatera. Jurnal Ilmu-Ilmu Peternakan XVIII: 28-35.
Phadi, P. K. 2014. Growth and development of Indian dairy sector: A pragmatic analysis. Pacific Business Review International 7: 81-85.
Priyono & A. Priyanti. 2015. Strengthening Dairy Cooperative through National Development of Livestock Region. Article in Indonesian.Wartazoa 25: 85-94.
Saha, G. K. 2014. Milk marketing in North East India: Experiences from Assam. The International Journal Of Business & Management 2: 112-117.
Santosa, S. I., A. Setiadi, & R. Wulandari. 2013. Potential
Analysis of Dairy Cattle development through agribusi
-ness paradigm in Musuk Sub District Boyolali Regency. Article in Indonesian. Buletin Peternakan 37: 125-135. https://doi.org/10.21059/buletinpeternak.v37i2.2431 Sari, D. R., S. Anantanyu, & Suprapto. 2013. Analisis usaha
tani ternak sapi perah Kecamatan Getasan Kabupaten Semarang. Jurnal Agrista 1: 1-12.
Sheela K. S. & A. Ramegowda. 2013. Dairy cooperatives and empowerment of women. International Journal of Advanced Social Science and Humanities 2: 034-042. Sulistyati, M., Hermawan, & A. Fitriani. 2013. Potential of small
scale dairy farm for facing in global market. Article in Indonesian. Jurnal Ilmu Ternak 13: 17-23.
Tanwar, P. S., Y. Kumar, & G. S. Aulakh. 2015. Impact of dairy cooperatives on milk production, income and employment generation in Semi Arid Rajasthan. International Journal in Management and Social Science 3: 477-487.
Utami, K. B., L. E. Radiati, & P. Surjowardojo. 2014. Kinerja peternak sapi perah PFH (Studi kasus pada anggota Koperasi Agro Niaga) di Kecamatan Jabung Kabupaten Malang. Jurnal Ilmu-Ilmu Peternakan 24: 61–68.
Weglarzy, K. 2009. Lactation productivity of dairy cows as affected by the length of preceding dry period. Animal Science Papers and Reports 27: 303-310.