Refer to Important disclosures on the last of this report
Stock DataTarget price (Rp) Rp5,800
Prior TP (Rp) Rp5,100
Shareprice (Rp) Rp4,650
Upside/downside (%) +24.7
Sharesoutstanding (m) 10,540
Marketcap. (US$ m) 3,311
Inalum (Persero) 65.0%
Estimate Change; Vs. Consensus
2018F 2019F PT Indo Premier Sekuritas [email protected] +62 21 5793 1170
Strong earnings momentum to remain
Solid 3Q18 performance as coal ASP improved.
Additional earnings from DMO quota transfer could reach Rp500bn.
We raise our earnings forecasts by 24%-19% for FY18F-19F.
Buy with 25% upside to new TP of Rp5,800 (prev. Rp5,100).
Strong earnings as ASP increased.
PTBA recorded strong performance in 3Q18
with earnings grew 50% qoq and 75% yoy to Rp1.35tn, allowing net profit to
reach Rp3.93tn in 9M18, up 50% yoy, which inline with consensus expectation
(75%) but above our forecast (80%) for FY18F. Strong earnings were mostly
stemming from higher ASP of Rp842k per ton (+12.9% yoy) in 9M18. PTBA’s
operating profit grew 11% qoq and 34% yoy to Rp1.65tn in 3Q18, which brought
9M18 operating profit to Rp5.17tn, up 40% yoy and represent 80% and 82%
(above) of consensus and our forecasts for FY18F, respectively. Please note that
PTBA’s reported 9M18 results had not included additional revenues from coal DMO
transfer quota which currently remains on negotiation and verification process
with the buyers and regulator.
Potential earnings from DMO quota transfer.
On the last meeting, the
would reach ~Rp530bn in FY18F and ~Rp600bn in FY19F, assuming excess DMO
quota of 25% (of total production volumes), quota transfer price of US$8 per ton
and USD/IDR of Rp14,000.
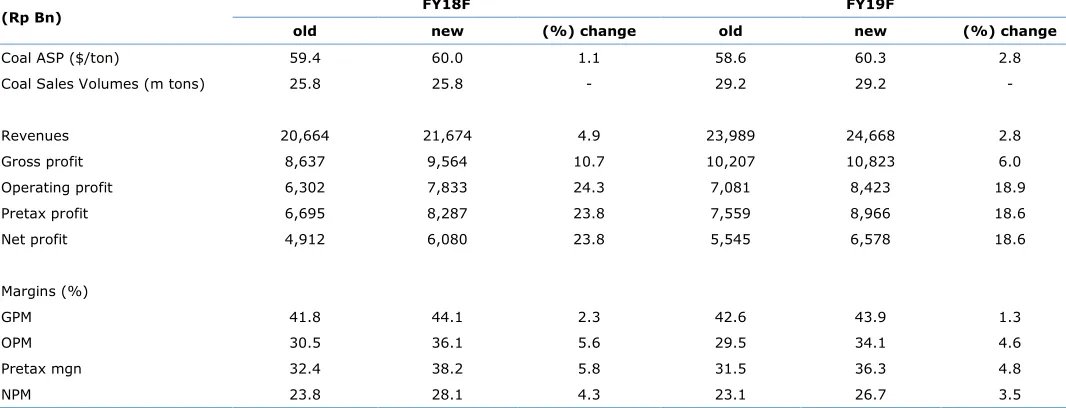
Revise up earnings estimates.
We raise our earnings forecast by 23.8% -
18.6% (Fig. 8) for FY18F-19F, respectively, as we included DMO quota transfer
revenues and we revise up ASP estimates by 1.1% - 2.8% for FY18F-19F,
respectively, given better than expected coal ASP in 9M18. We maintain our
flattish coal price assumption for FY19F which translates to PTBA’s flat coal ASP of
~US$60 per ton for FY18F-19F. Nonetheless, we believe PTBA’s earnings
performance would outperform its peers on the back of manageable stripping
ratio and improvement in railway coal transport volumes.
Maintain Buy with 25% potential upside to new TP of Rp5,800.
We
maintain our Buy rating for PTBA with 25% potential upside to our new target
price (DCF-based, WACC: 14.3%, TG: 2%) of Rp5,800 (prev. Rp5,100) which
implies FY18F-19F P/E of 11.0x and 10.2x, respectively. Our new TP is derived
from higher earnings estimates, roll-over base valuation year to 2019 and higher
risk free rate assumption of 8.5% (prev. 7.5%).
Bukit Asam
(PTBA IJ)
14 November 2018
Results Note
BUY
(Unchanged)
Year To 31 Dec 2016A 2017A 2018F 2019F 2020F
Source: PTBA, IndoPremier Share Price Closing as of : 13-November-2018
2
Refer to Important disclosures on the last of this report
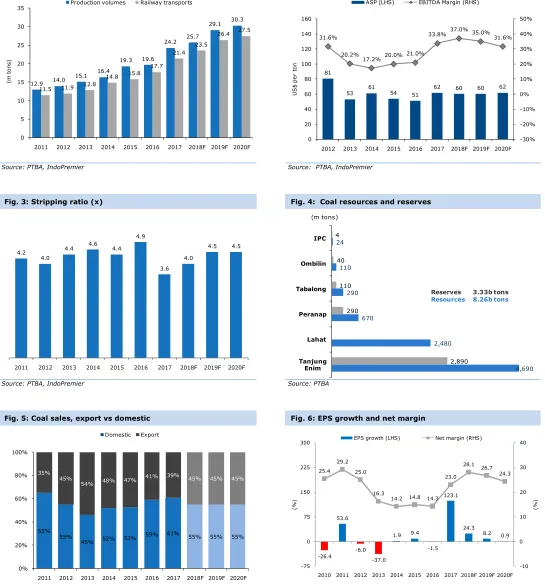
Fig. 1: Production and railway transport volumes Fig. 2: ASP and EBITDA margin
Source: PTBA, IndoPremier Source: PTBA, IndoPremier
Fig. 3: Stripping ratio (x) Fig. 4: Coal resources and reserves
Source: PTBA, IndoPremier Source: PTBA
Fig. 5: Coal sales, export vs domestic Fig. 6: EPS growth and net margin
Source: PTBA Source: PTBA, IndoPremier
12.9 14.0
2011 2012 2013 2014 2015 2016 2017 2018F 2019F 2020F
(m
Production volumes Railway transports
81
33.8% 37.0% 35.0% 31.6%
-30%
2012 2013 2014 2015 2016 2017 2018F 2019F 2020F
US
ASP (LHS) EBITDA Margin (RHS)
4.2
2011 2012 2013 2014 2015 2016 2017 2018F 2019F 2020F 4,690
2,480
2011 2012 2013 2014 2015 2016 2017 2018F 2019F 2020F
Domestic Export
2010 2011 2012 2013 2014 2015 2016 2017 2018F 2019F 2020F
(%
)
(%
)
3
Refer to Important disclosures on the last of this report
Fig. 8: 3Q18 results summary(Rp Bn) 9M18 9M17 % Y-Y 3Q18 % Q-Q % Y-Y vs. cons. vs. ours
Fig 8. Earnings revisions
4
Refer to Important disclosures on the last of this report
Year To 31 Dec (RpBn) 2016A 2017A 2018F 2019F 2020F
Cash & Equivalent 3,675 3,555 5,690 6,905 7,886
Receivable 2,285 5,344 5,948 6,770 7,499
Inventory 1,102 1,156 1,277 1,460 1,625
Other Current Assets 1,288 1,063 1,183 1,346 1,491
Total Current Assets 8,350 11,118 14,097 16,482 18,502
Fixed Assets - Net 7,516 7,466 8,210 9,043 10,132
Goodwill 0 0 0 0 0
Non Current Assets 1,315 1,905 2,245 2,645 3,117
Total Assets 18,577 21,987 26,126 29,822 33,485
ST Loans 958 208 208 208 208
Payable 539 886 0 1,119 1,246
Other Payables 3,065 3,328 3,704 4,216 4,670
Current Portion of LT Loans 481 91 0 0 0
Total Current Liab. 5,043 4,513 4,891 5,544 6,124
Long Term Loans 167 36 36 36 36
Other LT Liab. 2,814 3,638 4,670 5,994 7,694
Total Liabilities 8,024 8,187 9,597 11,574 13,854
Equity (944) (956) (956) (956) (956)
Retained Earnings 11,366 14,565 17,287 19,001 20,378
Minority Interest 131 192 198 204 210
Total SHE + Minority Int. 10,552 13,800 16,528 18,248 19,631
Total Liabilities & Equity 18,577 21,987 26,126 29,822 33,485
5
Refer to Important disclosures on the last of this report
Year to 31 Dec 2016A 2017A 2018F 2019F 2020F
Operating Margin (%) 18.0 30.3 36.1 34.1 30.9
Pre-Tax Margin (%) 19.4 31.3 38.2 36.3 33.1
Net Margin (%) 14.3 23.0 28.1 26.7 24.3
ROA (%) 11.3 22.1 25.3 23.5 21.0
ROE (%) 20.2 36.8 40.1 37.8 35.1
ROIC (%) 19.1 35.9 41.8 39.8 37.1
Acct. Receivables TO (days) 50.4 71.5 95.1 94.1 95.3
Acct. Receivables - Other TO (days) 0.0 0.0 0.0 0.0 0.0
Inventory TO (days) 8.3 9.7 10.0 10.1 10.0
Payable TO (days) 31.9 23.7 28.1 27.7 28.0
Acct. Payables - Other TO (days) 0.0 0.0 0.0 0.0 0.0
Debt to Equity (%) 15.2 2.4 1.5 1.3 1.2
Interest Coverage Ratio (x) 0.1 0.0 0.0 0.0 0.0
Net Gearing (%) (19.6) (23.3) (32.9) (36.5) (38.9)
Head Office
PT INDO PREMIER SEKURITAS
Wisma GKBI 7/F Suite 718
Jl. Jend. Sudirman No.28
Jakarta 10210 - Indonesia
p +62.21.5793.1168
f +62.21.5793.1167
INVESTMENT RATINGS
BUY : Expected total return of 10% or more within a 12-month period HOLD : Expected total return between -10% and 10% within a 12-month period SELL : Expected total return of -10% or worse within a 12-month period
ANALYSTS CERTIFICATION.
The views expressed in this research report accurately reflect the analysts personal views about any and all of the subject securities or issuers; and no part of the research analyst's compensation was, is, or will be, directly or indirectly, related to the specific recommendations or views expressed in the report.
DISCLAIMERS