Motor Vehicle Accidents?
Evidence from a Natural
Experiment
Abstract
This paper analyzes the effect of traffic tickets on motor vehicle accidents. Ordinary least squares (OLS) estimate may be upward biased because police officers tend to focus on areas where and periods when there is heavy traffic and thus higher rates of accidents. This paper exploits the dramatic increase in tickets during the Click-it-or-Ticket campaign to identify the causal impact of tickets on accidents using data from Massachusetts. I find that tickets significantly reduce accidents and nonfatal injuries. I provide suggestive evidence that tickets have a larger impact at night and on female drivers.C 2014 by the Association for Public Policy Analysis and Management.
INTRODUCTION
Reducing motor vehicle accidents is a key concern for health policy makers. Motor vehicle accidents cause more than 40,000 deaths and several million injuries each year, and are also the leading cause of death among children in the United States (Center for Disease Control and Prevention, 2011). While a large body of literature examines the impact of regulations and technological innovations, such as seat belts, airbags, and child safety seats (Braver et al., 1997; Carpenter & Stehr, 2008; Levitt, 2008), there has been considerably less work on the effect of traffic law enforcement. In particular, whether traffic tickets—the primary traffic law enforcement tool—are effective in decreasing road accidents remains an open question. Addressing the question is complicated by the issue of reverse causality—more police officers tend to be stationed at areas and during periods with higher rates of traffic accidents, in which case ordinary least squares (OLS) estimate of the effect of traffic tickets on accidents may be upward biased.
Further, while the ostensible goal of traffic tickets is to improve road safety, re-cent literature demonstrates that traffic tickets are often used as a tool to generate revenue for local municipality budgets (Garrett & Wagner, 2009; Makowsky & Strat-mann, 2009).1There is also compelling evidence that police officers are influenced by personal preferences when giving out tickets (Anbarci & Lee, 2008; Antonovics &
1Makowsky and Stratmann (2009) show that police officers in towns, which are more budget-strapped
are more likely to issue a ticket than a warning. Garrett and Wagner (2009) find that significantly more tickets are issued in counties the year following a decline in revenue.
86/Do Traffic Tickets Reduce Motor Vehicle Accidents?
Knight, 2009).2It is thus unclear whether tickets would fulfill their intended purpose of increasing road safety.
The limited existing literature on the impact of traffic law enforcement on motor vehicle accidents has provided mixed results. Carr, Schnelle, and Kirchner (1980) use the Nashville traffic police strike in 1978 as a natural experiment and report no significant deterioration in road safety during the strike. Conversely, Beenstock, Gafni, and Goldin (2001) use panel data on road sections in Israel and find some evidence that large-scale enforcement reduces road accidents, but that small-scale enforcement has no effect. More recently, DeAngelo and Hansen (2014) demonstrate that the mass layoff of the Oregon State Police due to budget cuts was associated with a marked increase in injuries and fatalities. Makowsky and Stratmann (2011) use the financial health of a town as an instrument for the number of tickets issued to demonstrate that more tickets lead to fewer accidents. However, most of the existing studies use the number of police officers as the measure of traffic law enforcement, which may not be accurate because police have other duties besides patrolling traffic. Monthly data could also obscure the sensitivity of the behavior of drivers to traffic tickets.
This paper exploits exogenous variation in the number of tickets issued to iden-tify the causal impact of traffic tickets on motor vehicle accidents using daily municipality-level data from Massachusetts. In the fall of 2002, Massachusetts par-ticipated for the first time in the Click-it-or-Ticket (CIOT) program, a federal pro-gram that was initiated and funded by the National Highway Traffic Safety Admin-istration (NHTSA). The program is carried out throughout the federal year through six “mobilizations” of one to two week periods, during which designated police of-ficers specifically and aggressively focus on traffic law enforcement. Although the program focuses on seat belt use, Massachusetts had a secondary seat belt law until 2007, which meant that while drivers and passengers were required to wear seat belts, police could not pull them over solely for failing to wear a seat belt. The motorist would have to be committing another traffic offense, such as speeding, in order for the police to have sufficient grounds for pulling a motorist over. Thus, I argue that the main impact of the CIOT campaign is to increase the degree of traffic law enforcement overall, and serves as a natural experiment to examine the impact of tickets on motor vehicle accidents.
There were two state-wide mobilizations that took place in Massachusetts during November and December of 2002. The November mobilization was held during the two weeks surrounding Thanksgiving and the December mobilization was carried out the week before Christmas. However, these periods were presumably chosen because there are higher traffic volumes (and therefore potentially higher rates of accidents) around holiday periods. To address the concern of endogeneity, I control for the periods that would presumably have been chosen for mobilizations had the campaign taken place in 2001. After controlling for these periods in 2001, calendar and municipality fixed effects, as well as a host of other municipality-specific time-varying variables, the increase in tickets during the actual mobilization periods in 2002 is then arguably exogenous to accidents. Results from reduced form regressions and using the mobilizations as an instrument for tickets both suggest that there is a negative and significant relationship between tickets and accidents. The estimated accident elasticity with respect to tickets is approximately−0.28—a 1 percent increase in tickets issued leads to a 0.28 percent decline in motor vehicle
2Anbarci and Lee (2008) find that minority officers, particularly African Americans, are harsher on
all motorists but even harsher on minority motorists. Antonovics and Knight (2009) find evidence for preference-based discrimination among police officers. Their results demonstrate that officers are more likely to stop and search a car if officer race and driver race differ.
Journal of Policy Analysis and Management DOI: 10.1002/pam
accidents. The estimated elasticity of nonfatal injuries with respect to tickets is smaller at−0.17. I demonstrate the reduction in accidents is higher in municipalities that issued more tickets during the mobilizations, which is consistent with the idea that tickets per se are reducing accidents rather than other concurrent factors. The main results are robust to a number of different specification checks. Finally, I show that tickets are more effective in more densely populated areas, and provide suggestive evidence that tickets have a larger impact at night, as well as a larger effect on female drivers. However, tickets do not appear to differentially affect age groups. These results on the heterogeneous effects of tickets may help inform policy makers how to allocate enforcement in order to achieve the highest impact.
BACKGROUND AND DATA
The CIOT Program
The CIOT program was first conceived in North Carolina in 1993, and by 2001 the program had spread to a number of other states in the region. The program is still in existence today. The initial program combined 3,000 enforcement checkpoints and paid advertising to build public awareness about seat belt use. In 2002, 18 states participated in a national CIOT campaign pilot program, including Massachusetts (Tison et al., 2006).
In Massachusetts, the CIOT campaign is organized as follows. Local police agen-cies are given grants according to their population size, and police officers apply for overtime to work during the campaign mobilizations. During the mobilizations, po-lice officers focus exclusively on traffic law enforcement and do not have to respond to any other calls. Further, they are expected to give out a certain number of tickets per shift, although they are not penalized if they do not attain the number. Since the campaign focuses on safety belt use, officers target drivers who were not using seat belts. As mentioned, however, Massachusetts had a secondary seat belt law until 2007, which meant that drivers and passengers were required to wear seat belts, but police could not pull them over solely for failing to wear a seat belt. Therefore, it was not just tickets issued for seat belt violations that rose in number during the mobilization periods, but tickets of all types of offenses (as described in more detail in the next section). In addition to increased traffic law enforcement, Massachusetts engaged in a state-wide media campaign to publicize the CIOT program via radio and television advertisements. The CIOT program, combined with the fact that Mas-sachusetts still had a secondary seat belt law in 2002, provides a unique setting to examine the impact of traffic citations on motor vehicle accidents.
Data Sources and Description
The data used in this paper are drawn from two main sources. The tickets data include all traffic tickets issued in the state from April 1, 2001, through January 31, 2003, covering all 350 municipalities. The database has detailed information on the offense type, ticket amount, location and time, demographic data about the driver, as well as the model and make of the car. The particular beginning and end dates of the sample period are exogenous to this study—the tickets data set was kindly shared by Bill Dedman and Francie Latour, who first collected the extensive data from the Massachusetts Registry of Motor Vehicles for a series of Boston Globe articles examining ticketing behavior and racial profiling in Massachusetts. The authors were not aware of the CIOT program.
88/Do Traffic Tickets Reduce Motor Vehicle Accidents?
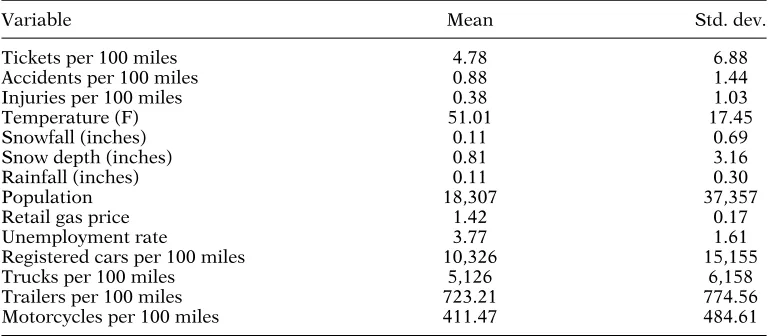
Table 1.Summary statistics.
Variable Mean Std. dev.
Tickets per 100 miles 4.78 6.88
Accidents per 100 miles 0.88 1.44
Injuries per 100 miles 0.38 1.03
Temperature (F) 51.01 17.45
Snowfall (inches) 0.11 0.69
Snow depth (inches) 0.81 3.16
Rainfall (inches) 0.11 0.30
Population 18,307 37,357
Retail gas price 1.42 0.17
Unemployment rate 3.77 1.61
Registered cars per 100 miles 10,326 15,155
Trucks per 100 miles 5,126 6,158
Trailers per 100 miles 723.21 774.56
Motorcycles per 100 miles 411.47 484.61
Notes: Unit is at the day/municipality level.N=234,850. Sample period is from April 1, 2001 to January 31, 2003.
for the same period. Each accident includes information on date, time, location, number of vehicles involved, and severity. I also obtain additional demographic data from the Highway Safety Division on the age and gender of the drivers involved in each accident. The demographic data are available only from 2002 onwards. I then link the tickets and accidents data sets by municipality and date to create a panel data set describing the number of tickets issued and accidents for each day in the sample period, for each municipality. The unit of observation is thus at the date/municipality level.
In addition to the tickets and accidents data, I collect daily weather information and gas data, which could potentially affect both traffic volume and accidents. The weather data includes daily precipitation, snowfall, snow depth on the ground, and mean temperatures for each municipality based on the closest weather station. There are altogether 57 weather stations that collected daily weather data for the relevant data period, and I link each municipality to its closest weather station. Gas data consist of retail prices for regular unleaded gas for each municipality for each day in the sample period.
Finally, I include year-varying municipality level data that are intended to capture characteristics that could be correlated with both traffic volume and accidents, such as the municipality unemployment rate, population, number of registered motor vehicles per capita, luxury cars per capita, trucks per capita, motorcycles per capita, and average car age.
Summary Statistics
Table 1 reports the overall summary statistics. On average, there are 4.8 tickets issued and 0.9 motor vehicle accidents per 100 miles of public road length. There are 0.381 nonfatal injuries per 100 road miles. The measures of tickets and accidents are adjusted per length of public road in each municipality to account for the different sizes (and also populations) of municipalities. Figure 1 depicts the number of tickets and accidents by week for the sample period. As it can be seen, there are two large and distinct spikes in tickets for the highlighted areas in 2002 relative to the same periods in 2001, and relative to all other periods. The spikes represent the CIOT mobilizations.
Journal of Policy Analysis and Management DOI: 10.1002/pam
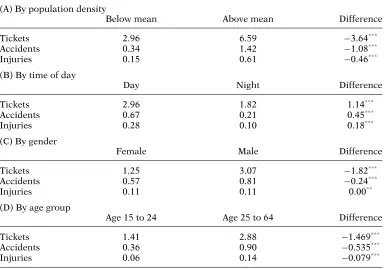
Table 2.Differences in means of selected variables.
(A) By population density
Below mean Above mean Difference
Tickets 2.96 6.59 −3.64***
Accidents 0.34 1.42 −1.08***
Injuries 0.15 0.61 −0.46***
(B) By time of day
Day Night Difference
Tickets 2.96 1.82 1.14***
Accidents 0.67 0.21 0.45***
Injuries 0.28 0.10 0.18***
(C) By gender
Female Male Difference
Tickets 1.25 3.07 −1.82***
Accidents 0.57 0.81 −0.24***
Injuries 0.11 0.11 0.00**
(D) By age group
Age 15 to 24 Age 25 to 64 Difference
Tickets 1.41 2.88 −1.469***
Accidents 0.36 0.90 −0.535***
Injuries 0.06 0.14 −0.079***
Notes: Unit is at the day/municipality level. For panel B, day is defined from 6 a.m. to 6 p.m., night from 6 p.m. to 6 a.m.; the sample period is from April 1, 2001 to January 31, 2003;N=234,850. For panels C and D, the sample period is from January 1, 2002 to January 31, 2003;N=138,204.
*Significant at 10 percent; **significant at 5 percent; ***significant at 1 percent.
90/Do Traffic Tickets Reduce Motor Vehicle Accidents?
Table 2 presents the summary statistics of the main dependent variables by dif-ferent groups—time of day, gender, and age group. Unsurprisingly, there are more tickets and accidents in the day because of higher traffic volumes. Males are involved in more accidents than females, which could reflect both that there are fewer female drivers and gender differences in driving behavior. There are also more tickets and accidents among the 25 to 64 years age group, which could again be because there are more drivers among that age group on the road.3
IDENTIFICATION STRATEGY
The identification strategy of this paper uses the sharp increase of tickets during the CIOT mobilizations to examine the impact on accidents. It rests on the assumption that the increase in tickets is exogenous, an assumption that I argue in this section is reasonable after controlling for other factors. The first CIOT mobilization occurred from November 18, 2002 until December 1, 2002, and Thanksgiving Day was on November 28. The concern is that these periods were chosen because there are high traffic volumes surrounding these holidays, in which case any changes in tickets or accidents could simply be an artifact of increased traffic volume. To address this issue, I control for the comparable periods in 2001. More specifically, if the CIOT campaign took place in 2001, the mobilization period would presumably have been chosen in the same way—the week of Thanksgiving and the week before. Since Thanksgiving was on November 22 in 2001, I define the comparable period to be November 12 to 25, 2001. The second mobilization in 2002 occurred from December 16 to 22. I similarly define the comparison period in 2001 to be December 17 to December 23. The comparison periods are specified to begin and end on the same day of the week, in order to prevent any bias from having unequal number of weekdays and weekends. For lack of a better term, I label the following weeks Treatment Periods: November 12 to 25, 2001, December 17 to 23, 2001, November 18 to December 1, 2002, and December 16 to 22, 2002.Treatment Periods×Year2002 is then the equivalent of the actual CIOT mobilizations. The control periods are all other days in the sample period.
The identification strategy would also be violated if there were uncontrolled fac-tors that were systematically correlated with the mobilization periods. For example, the mobilizations in 2002 could be systematically correlated with inclement weather or shocks to gas prices, which could affect traffic volume and in turn both the num-ber of tickets and crashes. I therefore control for weather conditions and retail unleaded gas prices as well. There were no major changes in the auto insurance industry during the sample period, which could have posed a challenge to identi-fication if the changes systematically altered driver behavior and were correlated with the timing of CIOT.
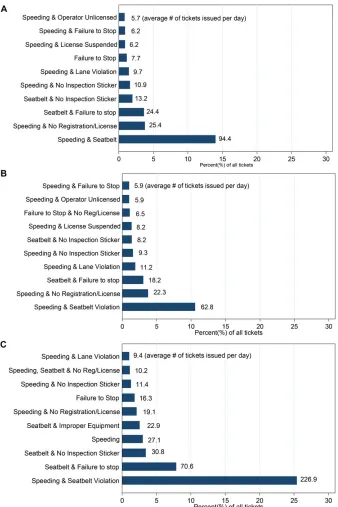
Next, using the CIOT mobilizations to capture the overall impact of tickets may not be appropriate if enforcement focused only on seat belt use, in which case the impact on injuries could be due to increased seat belt use rather than enforcement. Since Massachusetts did not have a primary seat belt law until 2007, law enforce-ment officers may issue a ticket for not wearing a seat belt only when there is another citable traffic infraction. Hence, a single ticket may include several different viola-tions, such as for both speeding and failing to wear a seat belt. Figure 2 depicts the
3Adjusted for population, however, the accident rate among the 15 to 24 years age group is twice as
large as that of the 25 to 64 years age group. A more appropriate measure may be to adjust the number of accidents by the number of drivers on the road from that group, but unfortunately those numbers are not available.
Journal of Policy Analysis and Management DOI: 10.1002/pam
Note: The number next to each bar represents the daily average number of tickets of that cateogry that were issued during the specified period.
92/Do Traffic Tickets Reduce Motor Vehicle Accidents?
10 most common “types” of tickets during the three key periods: control, compar-ison periods in 2001, and the CIOT mobilizations. The horizontal axis depicts the percent of all issued tickets during the relevant period, and the number next to each shaded bar represents the daily average frequency of that particular ticket type. As an example, tickets that consisted of speeding and seat belt infractions made up ap-proximately 14 percent of all tickets given out during the control period, and there were on average 94.4 tickets of this type issued daily during this time. During CIOT, the frequency ranking of ticket types was mostly preserved, with tickets involving speeding and seat belt infractions remaining the most common. However, the vol-ume of each ticket type increased substantially during the CIOT mobilizations—the number of tickets issued that consisted of speeding and seat belt infractions more than double. At the same time, the percent of all tickets issued that were made up of speeding and seat belt violations also almost double during CIOT. I investigate whether this shift in the composition of tickets issued has an independent effect on accidents and injuries in the next section.
Finally, both the comparison periods and CIOT mobilizations occurred around holiday weekends, which could challenge the external validity of the results if holi-day periods are systematically different from nonholiholi-day periods in terms of traffic patterns and composition of drivers. To address this concern, I first examine the pro-portion of tickets given to out-of-state drivers in the data.4The difference between the percent of tickets issued to out-of-state drivers over holiday weekends (8.90 percent) versus other periods (8.92 percent) is very close to zero and statistically insignificant, suggesting that the composition of drivers remains stable. Further, the composition of tickets between nonholiday periods and holiday weekends is similar, which helps confirm that the composition of drivers and driving patterns are comparable between holiday and nonholiday periods (not shown). Regardless, holiday periods per se may be of particular policy concern. Long holiday weekends tend to have high numbers of accidents and fatalities (NHTSA, 2014), so it may be especially important to understand whether tickets can be an effective policy tool to increase road safety during these periods.
RESULTS
OLS Results
According to the basic model in Becker’s seminal paper (1968) on crime and pun-ishment, an individual makes the decision of whether to commit a crime or not by weighing the expected costs against the expected benefits. In the context of this paper, the degree of traffic law enforcement increases markedly during the CIOT mobilizations, which can be translated into a higher probability of getting caught and thus a higher expected cost of committing a traffic violation. We should there-fore expect to see fewer traffic violations and potentially fewer accidents, that is, we would expectβ1 to carry a negative sign if we model the relationship between accidents and tickets as such:
Accidentsit =αi+δt+β1Ticketsit+Xitβ2+εit (1)
4It should be noted that out-of-state tickets need to be paid just as routinely as in-state tickets, and
most states have a reciprocal relationship between other states to keep track of any traffic convictions. Forty-five states and the District of Columbia participate in the Driver License Compact (DLC). Georgia, Michigan, Wisconsin, and Tennessee are the only states that do not participate in this interstate compact.
Journal of Policy Analysis and Management DOI: 10.1002/pam
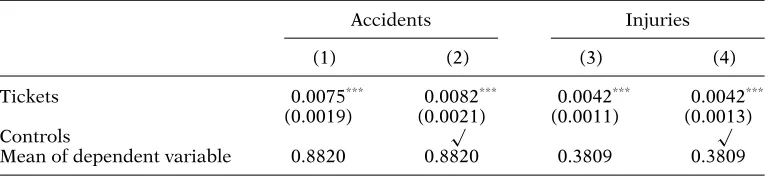
Table 3.OLS results: the impact of tickets on motor vehicle accidents and injuries.
Accidents Injuries
(1) (2) (3) (4)
Tickets 0.0075*** 0.0082*** 0.0042*** 0.0042*** (0.0019) (0.0021) (0.0011) (0.0013)
Controls √ √
Mean of dependent variable 0.8820 0.8820 0.3809 0.3809
Notes: N=235,521. Standard errors clustered by municipality are presented in parentheses. Regressions include dummies for month-by-year, day of week, holiday weekends, andTreatment Periods.Controls include daily municipality-specific measures of average snowfall, snow depth, rainfall, temperature, retail gas prices (plus squared terms), annual municipality-specific measures of population, unemployment rate, number of registered automobiles, trucks, motorcycles, and trailers per 100 miles.
*Significant at 10 percent; **significant at 5 percent; ***significant at 1 percent.
where αi and δt are municipality and calendar fixed effects, which include day-of-week, month-by-year, and public holidays (and the contiguous weekend if the holiday falls on a Friday or Monday) fixed effects.Xit represents a vector of controls that may influence both traffic volume and accidents, which include the amount of snowfall, snow depth on ground, rainfall, temperature, retail gas prices, pop-ulation, unemployment rate, registered cars per 100 miles, trucks per 100 miles, trailers per 100 miles, and motorcycles per 100 miles. The weather condition and gas price variables vary at the day-municipality level; the rest vary at the calendar year-municipality or fiscal year-municipality level.
However, OLS estimates of equation (1) would lead to biased estimates if there were a correlation betweenεit andTicketsit. This is probable because police officers tend to focus on areas where and periods when accidents are prone to happen. If so, estimates ofβ1 will be upward biased. Table 3 reports the OLS estimates from regressing accidents and injuries on tickets directly, both with and without time-varying municipal controls. The coefficients on tickets are close to zero and in fact slightly positive, suggesting that the estimates are indeed upward biased.
First-Stage Results
The identification strategy proposed in this paper is to use the CIOT periods as a single instrument for tickets. To be a valid instrument, the CIOT periods should be able to demonstrate strong explanatory power of tickets (Bound et al., 1995). The first-stage regression representing the relationship between tickets issued in municipalityion datetand the CIOT mobilizations is modeled as follows:
Ticketsit =αi+δt+β2Tr eatment Periodst+β3CIOTt+Xitβ4+εit (2) whereαiandδtare again municipality and calendar fixed effects.Tr eatment Periodst is a dummy representing the treatment weeks as defined in the previous section. C I OTtindicates when the CIOT mobilizations took place in 2002, and is also equiv-alent toTr eatment Periodst×Year2002.Xitis the same vector of controls as before. β3thus captures the rise in tickets during the CIOT mobilizations in 2002.
94
Table 4.The impact of CIOT and tickets on motor vehicle accidents and injuries.
Injuries scaled Injuries controlling Tickets Accidents Injuries by accidentsa for accidentsb
(1) (2) (3) (4) (5) (6) (7) (8)
(A) Reduced form evidence
CIOT 1.9350*** 1.9043*** 0.0945*** 0.0987*** −0.0248 −0.0261 0.0189 0.0162 (0.1795) (0.1769) (0.0239) (0.0238) (0.0174) (0.0172) (0.0206) (0.0156)
(B) IV estimates
Tickets 0.0479*** 0.0519***
−0.0123 −0.0137* 0.0081 0.0084 (0.0119) (0.0125) (0.0085) (0.0084) (0.0089) (0.0087)
Controls √ √ √ √ √
Mean of dependent variable
4.7780 4.7780 0.8820 0.8820 0.3809 0.3809 0.4330 0.3809
Notes: N=235,521 except for column 7, whereN=98,905. Standard errors clustered by municipality are presented in parentheses. Regressions include dummies for month-by-year, day of week, holiday weekends, andTreatment Periods.Controls include daily municipality-specific measures of average snowfall, snow depth, rainfall, temperature, retail gas prices (plus squared terms), annual municipality-specific measures of population, unemployment rate, number of registered automobiles, trucks, motorcycles, and trailers per 100 miles.
aThe dependent variable is the number of injuries divided by total motor vehicle accidents.
bThe dependent variable is the number of injuries and the regression controls for the total number of motor vehicle accidents.
*Significant at 10 percent; **significant at 5 percent; ***significant at 1 percent.
in tickets. TheF-statistic is approximately 100. The first-stage relationship between the CIOT periods and tickets is clearly strong.
Reduced Form Evidence
Table 4 (columns 3 to 8) reports the results from estimating the reduced-form relationship between the CIOT mobilization program and the number of acci-dents/injuries:
Accidentsit =αi+δt+β2Tr eatment Periodst+β3CIOTt+Xitβ4+εit (3) Using accidents as the dependent variable (columns 3 and 4), the results suggest that the reduced form impact of the CIOT campaign on motor vehicle accidents ranges from −0.94 to −0.99, which would translate to an 11 percent reduction. It appears that the number of accidents fell significantly during the mobilization periods, relative to both the comparable periods in 2001 and the control periods. Injuries went down during the CIOT periods as well, but the estimated reduction is not statistically different from zero at conventional levels (columns 5 and 6). From Figure 2, one can see that the fraction of total tickets that were made up of speeding and seat belt violations almost doubled during CIOT. The shift in the composition of tickets may have had an independent effect on the composition of accidents. Since seat belt violations were always given in tandem with at least another violation due to the secondary seat belt law in MA and there are no detailed data on seat belt use, it is not possible to disentangle the effect of seat belt versus other types of violations. However, if the impact of CIOT was mainly on seat belt use, then we should expect to see a decrease in injuries relative to the total number of accidents. I test this hypothesis in columns 7 and 8. In column 7, the dependent variable is the number of injuries divided by total number of accidents.5In column 8, the dependent variable remains the number of injuries, but the number of accidents enters the regression as an additional control. The composition of accidents is not significantly affected in either specification. This also supports the notion that although the intended goal of CIOT is to increase seat belt use, the actual effect was to increase traffic law enforcement overall.6
Instrumental Variable Results
The main results of the paper, which are the estimates from the instrumental vari-able (IV) regressions, are reported in Tvari-able 4, panel B. As I argue in the identification strategy section, the increase in tickets due to the CIOT mobilizations can be viewed as exogenous after controlling for other factors. There is also a strong first-stage re-lationship between tickets and the CIOT mobilizations (Table 4, columns 1 and 2). The IV model hence uses the CIOT mobilizations as a single instrument for tickets, controlling for the same covariates in equation (1) as well asTreatment Periods to adjust for any confounding differences in traffic conditions due to holiday periods. The coefficients on tickets in columns 3 and 4 imply that a unit increase in tick-ets decreases accidents by approximately 0.05, and the estimates are statistically significant at the 1 percent level. Since there are on average 4.8 tickets issued and 0.88 accidents in a municipality, this implies the elasticity of accidents with respect
5This leads to a smaller sample size because there are a number of observations where zero accidents
were recorded.
6While data on fatalities are available, I do not present any analysis on fatalities due to lack of statistical
96/Do Traffic Tickets Reduce Motor Vehicle Accidents?
to tickets is approximately −0.28—a 1 percent increase in tickets leads to a 0.28 percent decrease in motor vehicle accidents.7Next, I examine whether tickets have any impact on nonfatal injuries caused by motor vehicle accidents (columns 5 and 6). For injuries, the IV estimate is significant at the 10 percent level when including municipality-specific time-varying controls. If we take the estimate at face value, the elasticity of injuries with respect to tickets would be−0.17. I find no evidence that tickets affect the composition of accidents, that is, the number of injuries relative to total number of accidents (columns 7 and 8).
To my knowledge, Makowsky and Stratmann (2011) is the only other study that examines the impact of traffic tickets on road safety. They use the financial health of a town—whether a town asks voters to approve a property tax override referendum— as the instrument for tickets. By putting an override referendum in front of voters, the town board indicates that the town is in fiscal distress and that they would like to raise additional revenue.8They find comparable results. Their IV estimates indicate that a unit increase in tickets leads to 0.12 (SE=0.034) fewer motor vehicle accidents and 0.044 (SE=0.022) injuries. Their unit of observation is at the month-municipality level and the mean of tickets, accidents, injuries are at 82.68, 36.93, and 15.83, respectively. Their results thus translate into an elasticity of accidents with respect to tickets of−0.27, which is very close to the elasticity found in this paper. They find a somewhat higher elasticity of injuries with respect to tickets of −0.23.
Mechanism: Tickets versus Information
There are two main mechanisms that could lead to the observed result of fewer accidents during the CIOT mobilizations. The first is a deterrence effect, both for drivers who receive a ticket and those who observe other drivers receiving a ticket. For example, giving a ticket to a driver who was going 80 mph on a road where the speed limit is 55 mph could deter the recipient from further speeding, and thus be less likely to be involved in an accident. There could also be a visual deterrence effect, for example, drivers observe another car being pulled over for speeding and therefore slow down and drive more carefully.
Second, it is possible that tickets per se did not drive the reduction in accidents. As noted earlier, there was a concurrent state-wide media campaign during the CIOT periods.9While the media campaign would only be credible if there were an actual increase in ticketing, the estimated impact of tickets on accidents would be overstated if the media campaign was the main mechanism through which accidents were reduced.
I argue that the main mechanism was indeed through tickets and not through the spread of information through the media campaign (or other related channels, such as through the social networks of ticketed drivers). First, previous literature suggests that advertising campaigns have no or little effect until accompanied by highly visible enforcement (Elder et al., 2004; Foss, 1989; Williams et al., 1987;
7All results using the level numbers of tickets and accidents (instead of rates per 100 miles) yield similar
results and can be obtained by request.
8Their instrument rests on the caveat that the only impact of fiscal distress on motor vehicle accidents
is through the number of tickets issued. However, one could imagine that fiscal distress would affect accidents through other channels such as unemployment (and therefore less traffic), poorer road main-tenance, and other unobservable variables. The authors attempt to address these issues by including various controls and by using different specifications.
9It is my understanding from discussions with the Massachusetts Highway Safety Division that the
main component of the CIOT program, particularly in its inception year, was the increase in traffic law enforcement.
Journal of Policy Analysis and Management DOI: 10.1002/pam
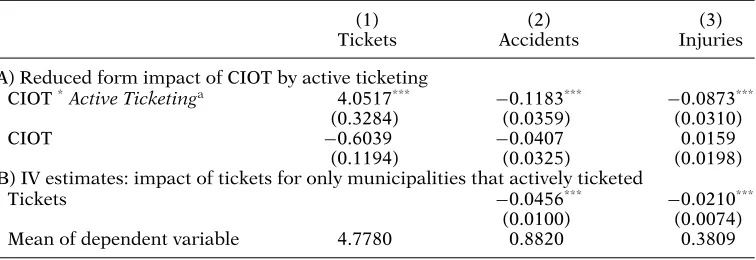
Table 5.Comparing mechanisms: tickets versus information.
(1) (2) (3)
Tickets Accidents Injuries
(A) Reduced form impact of CIOT by active ticketing
CIOT*Active Ticketinga 4.0517*** −0.1183*** −0.0873***
(0.3284) (0.0359) (0.0310)
CIOT −0.6039 −0.0407 0.0159
(0.1194) (0.0325) (0.0198) (B) IV estimates: impact of tickets for only municipalities that actively ticketed
Tickets −0.0456***
−0.0210*** (0.0100) (0.0074) Mean of dependent variable 4.7780 0.8820 0.3809
Notes:For panel A,N=234,850. For panel B,N=234,850. Standard errors clustered by municipality are presented in parentheses. Regressions include dummies for month-by-year, day of week, holiday week-ends,Treatment Periods,andActive Ticketing×Treatment Periods.Controls include daily municipality-specific measures of average snowfall, snow depth, rainfall, temperature, retail gas prices (plus squared terms), annual municipality-specific measures of population, unemployment rate, number of registered automobiles, trucks, motorcycles, and trailers per 100 miles.
aActive Ticketingis a dummy variable equal to 1 if the daily average of tickets issued during the CIOT
mobilizations is greater than the rest of the sample period in that municipality. *Significant at 10 percent; **significant at 5 percent; ***significant at 1 percent.
Wintemute, 1992). The prevailing wisdom is that enforcement campaigns are more effective when accompanied by widespread advertising and publicity, but that ad-vertising and publicity alone may only have a short-term effect that soon dissipates in the absence of enforcement. Second, if the spread of information about the CIOT mobilizations was the main mechanism, the reduction in accidents should not vary systematically by how many tickets were written in a particular town. In other words, if ticketing mattered, then it should have had a larger effect in the towns that issued more tickets. In panel A of Table 5, I include an interaction term ofCIOTand Active Ticketing, a binary variable which I define to be 1 if the average number of tickets issued daily during the CIOT periods exceeded the average number of tickets issued daily in the control periods. This seems to be a reasonable proxy for active traffic enforcement during the mobilizations. Overall, participating municipalities on average give out more tickets, have more accidents, and have higher population densities. It is possible that municipalities that choose to participate have different accident risk factors or marginal costs of ticketing (e.g., municipalities with higher population densities may have higher accident risk factors or lower marginal costs in implementing CIOT).10These municipalities may therefore have larger expected gains from participating in CIOT.
I present results from this exercise in Table 5. By construction, the first-stage coefficient of tickets on the interaction termCIOT×Active Ticketingis much larger than and statistically different from the coefficient onCIOT(panel A column 1). Of more interest are the coefficients of accidents and injuries on the interaction term ofCIOT×Active Ticketing, which are both statistically different from zero and from theCIOTterm (columns 2 and 3). In municipalities where the main exposure to the CIOT program is not through increased ticketing, we do not observe a significant decrease in accidents or injuries, whereas the opposite is true for municipalities that actively ticketed. This helps rule out the hypothesis that the state-wide media
10I revisit this issue in the penultimate section of the paper when I explore heterogeneous effects by
98/Do Traffic Tickets Reduce Motor Vehicle Accidents?
campaign was the main cause of the reduction in accidents. The sample in Table 5, panel B uses only the participating municipalities, and IV regressions yield similar but even more precisely estimated coefficients than when using the entire sample.11
ROBUSTNESS CHECKS
Using Different Subsample Periods
As there were only three weeks of mobilizations in 2002, a potential concern would be that there were uncontrolled factors occurring in other months that would con-found the estimation. For example, there was a spike in tickets in May 2002 relative to May 2001 (Figure 1). The reason for this is because a number of the larger municipalities in Western MA participated in a trial CIOT mobilization the week surrounding Memorial Day Weekend (Soloman, Ulmer, & Preusser, 2002). How-ever, I am unable to obtain data on which specific municipalities participated in the mobilization as the Department of Highway Safety did not keep records of the particulars of the trial mobilization. As a robustness check, I restrict the analysis to only the November and December months of 2001 and 2002.
The results are similar to those using the entire sample period. Table 6, panel A summarizes the reduced form estimates of the CIOT mobilizations on tickets and accidents using the full set of controls. The reduction in the number of injuries due to motor vehicle accidents associated with the mobilization periods is now statistically significant at the 5 percent level. The IV estimates are reported in columns 4 and 5 of Table 6, panel A. The results imply that a 1-unit increase in tickets reduces accidents by 0.07 and injuries by 0.02. The results from using the restricted sample tell a consistent story: tickets lead to fewer accidents and injuries.
Second, it can be noted in Figure 1 that there was a dip in the number of tickets the week before the November mobilization in 2002 relative to the comparison period in 2001. It is unclear why the dip occurred, but a plausible reason is that police departments were holding back on ticketing in order to reserve resources and effort for the upcoming mobilization. Another potential confounding factor would be if the media campaign started before the mobilizations and led drivers to alter their driving behavior before the mobilizations began. This latter effect seems less likely as it can be seen in Figure 1 that there was actually a small spike in accidents during the run-up week. Even so, using the run-up week as part of the control period may not be appropriate because of these potential confounding factors. Hence, I also estimate the model omitting the run-up week before each mobilization. The results from this test are presented in Table 6, panel B. The results remain reassuringly similar to the baseline estimation.
Finally, due to lingering effects and ongoing publicity, it is not clear that the short period between the November and December mobilizations may be an effec-tive control period. To address this, I treat the entire period from November 12 to December 22 in 2002 as a single continuous mobilization (Table 6, panel C).
11Since municipalities can also engage in local outreach efforts, one potential concern is that these efforts
vary systematically with ticket issuance across municipalities. In particular, if municipalities that actively ticketed also spent more on local campaigns, then the estimates in Table 5 would be downward biased (or upward biased in magnitude). However, given that funding is limited, we would see participating municipalities also spend more on local outreach efforts only if complementarities (in improving road safety) exist between local campaigns and ticketing. It seems more or just as likely that local outreach efforts and ticketing are substitutes, so that municipalities that actively ticket spend relatively less on local outreach efforts. Unfortunately, there are no available data on differences in media spending by municipality for the period, so the actual direction of bias is unclear.
Journal of Policy Analysis and Management DOI: 10.1002/pam
Table 6.Robustness checks.
(1) (2) (3) (4) (5)
Reduced form evidence IV estimates
Tickets Accidents Injuries Accidents Injuries
(A) Using November and December months only
CIOT 1.777***
(B) Omitting the run-up week to CIOT
CIOT 1.8430***
(C) Treating the mobilizations as continuous
CIOT 0.9589*** −0.1121*** −0.0471*** Tickets −0.1154*** −0.0485** (0.1110) (0.0251) (0.0180) (0.0273) (0.0204) Mean of dependent
variable
4.7780 0.8820 0.3809 0.8820 0.3809
(D) Using Memorial Day in 2001 as the comparison period
CIOT 1.4194***
Notes: The sample used in panel A includes observations from the months of November and Decem-ber only;N=42,700. The sample used in panel B excludes the week before the CIOT mobilizations; N=229,950. The full samples are used in panels C and D;N=234,580. Standard errors presented in parentheses are clustered by municipality. Regressions include dummies for month-by-year, day of week, holiday weekends, andTreatment Periods.Controls include daily municipality-specific measures of average snowfall, snow depth, rainfall, temperature, retail gas prices (plus squared terms), annual municipality-specific measures of population, unemployment rate, number of registered automobiles, trucks, motorcycles, and trailers per 100 miles.
*Significant at 10 percent; **significant at 5 percent; ***significant at 1 percent.
Interestingly, the magnitudes of the estimates from this exercise are considerably larger, suggesting that the period between the two mobilizations may indeed not be an appropriate control. However, it is not possible to tease out whether the effects are due to ongoing publicity campaigns or to lingering deterrence effects produced by the program.12
Using Different Comparison Periods
Another concern is that the relevant periods in 2001 (e.g., around the Thanksgiv-ing holiday) are not valid comparison groups since they occurred shortly after the September 11 terrorist attacks. Specifically, patterns of car travel in that particular holiday season may not have been representative. A priori, it seems reasonable to believe that the events on September 11 increased the amount of road traffic around the treatment periods—travelers may be more likely to drive rather than fly given
12I also experimented with treating the mobilizations as continuous and omitting the run-up week using
100/Do Traffic Tickets Reduce Motor Vehicle Accidents?
the circumstances. For example, individuals from states outside of Massachusetts who would have normally flown to Boston might have driven that year instead due to fears related to flying. If traffic increased to a new permanent level for holiday seasons post-9/11—so that traffic patterns for 2001 and 2002 are comparable—then estimates will remain unbiased. If traffic spiked in 2001 relative to 2002, that is, traffic increased in 2001 and returned to pre-9/11 levels in 2002, then estimates would actually be upward biased (or downward biased in magnitude). Hence, the estimates can be considered as an upper bound estimate.
Similarly, if traffic enforcement immediately after 9/11 was especially high in theTreatment Periods, then we may expect more tickets to be given out relative to the same period in other years before 9/11. This would again in effect lead to an upward bias in the estimates. According to Figure 2, however, the composition and daily number of tickets issued do not differ substantially between the comparison periods in 2001 and the control periods.
Regardless, the previous arguments hinge on a number of assumptions that are not directly testable using existing data. As such, I add a robustness check using the two weeks surrounding Memorial Day weekend in 2001 as the comparison period. While by no means a perfect substitute, Memorial Day weekend is a big travel weekend for many Americans and hopefully should capture the traffic patternssans9/11. In addition, CIOT mobilizations in recent years have taken place around Memorial Day weekend, which further supports the use of that period as a control. The results— reported in Table 6, panel D—remain very similar. Finally, all regressions include month-by-year fixed effects, which will help absorb state-wide trends in tickets and accidents, including any potential “9/11 effects.”
Using Averages
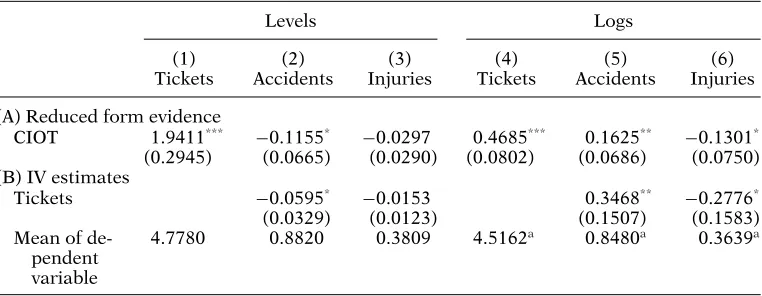
Although the number of tickets varies across days and municipalities, CIOT was a state-wide program and supposedly took place across the entire state of Mas-sachusetts, that is, the variation in CIOT participation was by day (although there are varying degrees of participation). While I group standard errors by municipality in all regressions, one may be concerned that failing to account for intraday corre-lation in errors could generate standard errors that are biased downwards.13I argue that it is more important to account for intramunicipality correlation than intraday correlation since Massachusetts has 350 municipalities with distinct variation in economic, weather, and traffic conditions across the state. Nonetheless, as a robust-ness check, I collapse the data by day into a simple time series (weighted by the number of road miles) to see if the results still hold. Table 7 reports the unadjusted means of tickets and accidents during the CIOT in 2002 and comparable periods in 2001, relative to the control periods using only November and December months. Table 8, panel A presents the reduced form estimates and panel B the IV results using the full time series.14The simple differences-in-differences estimate reported in Table 7 (row 6 column 3, in bold) is in line with the regression-adjusted estimates in Table 8, and the results in both tables are also consistent with those when using the full panel data set. Columns 4 to 6 of Table 8 report results using the logarithmic forms of accidents and tickets. The estimated elasticity is around−0.35, which is slightly higher than the elasticity of−0.28 estimated when using the full sample.15
13The main results on accidents are also robust to clustering by county instead of municipality. 14Results shown are unadjusted, but they are robust to using Newey–West estimation to account for
serial correlation and potential.
15Results are robust to treating the week surrounding Memorial Day weekend as an actual mobilization.
A falsification exercise of randomly choosing 100 “placebo” treatments (excluding actual CIOT periods)
Journal of Policy Analysis and Management DOI: 10.1002/pam
Table 7. Means of tickets and accidents by year and period, using time-series data from November and December months, 2001 and 2002.
(1) (2) (3)
Year Control periods Treatment periods Difference (2) – (1)
(A) Means of tickets, by year and period
(1) 2001 3.824 3.857 0.032
(0.140) (0.258) (0.239)
(2) 2002 3.237 5.320 −0.587***
(0.189) (0.316) (0.322)
(3) Difference −0.587***
−1.463*** 2.265***
(2)−(1) (0.219) (0.365) (0.500)
(B) Means of accidents, by year and period
(4) 2001 0.913 0.91 0.002
(0.045) (0.060) (0.075)
(5) 2002 0.894 0.795 −0.098
(0.045) (0.052) (0.062)
(6) Difference −0.019 −0.115*
−0.096*
(2)−(1) (0.063) (0.071) (0.055)
Notes: Sample includes time-series data from November and December months in 2001 and 2002 only; N=122. Standard errors clustered by municipality are presented in parentheses.Treatment Periodsare defined as November 12 to 25, 2001, December 17 to 23, 2001, November 18 to December 1, 2002, and December 16 to 22, 2002. The control periods are defined as the rest of the days in the sample period. *Significant at 10 percent; **significant at 5 percent; ***significant at 1 percent.
Table 8. The impact of CIOT and tickets on motor vehicle accidents and injuries using time-series data.
Levels Logs
(1) (2) (3) (4) (5) (6)
Tickets Accidents Injuries Tickets Accidents Injuries
(A) Reduced form evidence CIOT 1.9411***
−0.1155*
−0.0297 0.4685*** 0.1625**
−0.1301* (0.2945) (0.0665) (0.0290) (0.0802) (0.0686) (0.0750) (B) IV estimates
Tickets −0.0595* −0.0153 0.3468** −0.2776* (0.0329) (0.0123) (0.1507) (0.1583) Mean of
de-pendent variable
4.7780 0.8820 0.3809 4.5162a 0.8480a 0.3639a
Notes: Samples in panels A and B includes the complete time series from April 1, 2001 to January 31, 2003;N=671. Regressions include dummies for month-by-year, day of week, holiday weekends, and Treatment Periods.Controls include daily averages of snowfall, snow depth, rainfall, temperature, retail gas prices (plus squared terms), annual averages of population, unemployment rate, number of registered automobiles, trucks, motorcycles, and trailers per 100 miles.
aGeometric means are reported.
*Significant at 10 percent; **significant at 5 percent; ***significant at 1 percent.
102/Do Traffic Tickets Reduce Motor Vehicle Accidents?
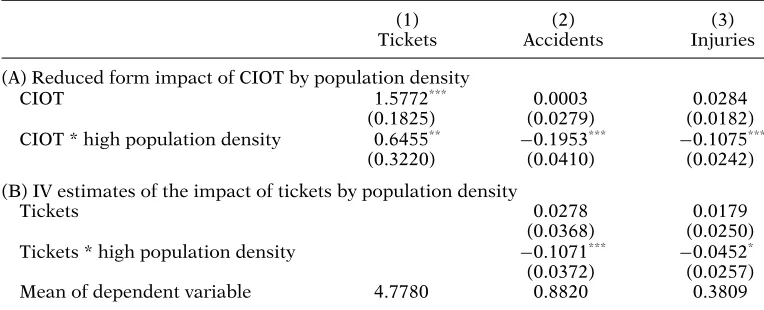
Table 9.Heterogeneous effects by population density.
(1) (2) (3)
Tickets Accidents Injuries
(A) Reduced form impact of CIOT by population density
CIOT 1.5772*** 0.0003 0.0284
(0.1825) (0.0279) (0.0182) CIOT * high population density 0.6455**
−0.1953***
−0.1075*** (0.3220) (0.0410) (0.0242)
(B) IV estimates of the impact of tickets by population density
Tickets 0.0278 0.0179
(0.0368) (0.0250) Tickets * high population density −0.1071*** −0.0452* (0.0372) (0.0257) Mean of dependent variable 4.7780 0.8820 0.3809
Notes: Standard errors clustered by municipality are presented in parentheses.N = 235,521. High Population Densityis a dummy variable equal to 1 if the municipality population is above the mean municipality population across Massachusetts. Regressions include dummies for month-by-year, day of week, holiday weekends, andTreatment Periods.Controls include daily municipality-specific measures of average snowfall, snow depth, rainfall, temperature, retail gas prices (plus squared terms), annual municipality-specific measures of population, unemployment rate, number of registered automobiles, trucks, motorcycles, and trailers per 100 miles.
*Significant at 10 percent; **significant at 5 percent; ***significant at 1 percent.
HETEROGENEOUS EFFECTS
When are tickets most effective in reducing accidents? What kind of driver do tickets affect most? From a policy perspective, it is important to understand these issues in order to efficiently allocate enforcement efforts. To my knowledge, this is the first paper to attempt to explore heterogeneous effects of traffic law enforcement.
By Municipality Population Density
It may be useful to examine whether the CIOT program had heterogeneous effects by municipality characteristics. A priori, one may expect CIOT to have a larger impact in municipalities with higher population relative to road miles, that is, on average such municipalities will have more motorists on the road. Intuitively, it may be easier for municipalities with higher population densities (measured as population/road miles) to facilitate the CIOT program because of lower marginal costs of issuing tickets. For example, it may be more difficult for law enforcement officers to find an offending motorist to ticket with few drivers on the road, and the visual deterrence effect of tickets may be weaker in municipalities where there are fewer drivers on the road as well. Municipalities with higher population densities may therefore issue more tickets and experience a larger decline in accidents during the CIOT campaign.
I examine the differential effects of the CIOT program by population density (Ta-ble 9). I group municipalities by whether their population density is above or below the mean municipality population density across Massachusetts. Consistent with the hypothesis, municipalities with above-mean population densities issue more tickets during CIOT mobilizations, relative to municipalities with below-mean population densities. Further, municipalities with higher population densities experienced a larger decline in accidents and injuries during CIOT (Table 9, panel A). Tickets also have a larger effect in municipalities with higher population densities, which may be due to the increased visual deterrence effect when more motorists are on the road
Journal of Policy Analysis and Management DOI: 10.1002/pam
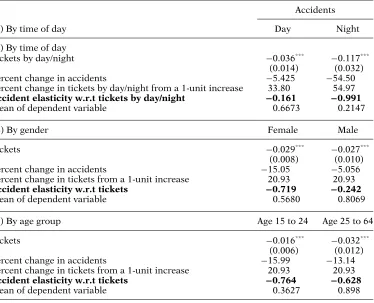
Table 10.Heterogeneous effects by time of day, gender, and age group.
Accidents
(A) By time of day Day Night
(A) By time of day
Tickets by day/night −0.036***
−0.117*** (0.014) (0.032)
Percent change in accidents −5.425 −54.50
Percent change in tickets by day/night from a 1-unit increase 33.80 54.97
Accident elasticity w.r.t tickets by day/night −0.161 −0.991
Mean of dependent variable 0.6673 0.2147
(B) By gender Female Male
Tickets −0.029*** −0.027***
(0.008) (0.010)
Percent change in accidents −15.05 −5.056
Percent change in tickets from a 1-unit increase 20.93 20.93
Accident elasticity w.r.t tickets −0.719 −0.242
Mean of dependent variable 0.5680 0.8069
(C) By age group Age 15 to 24 Age 25 to 64
Tickets −0.016***
−0.032*** (0.006) (0.012)
Percent change in accidents −15.99 −13.14
Percent change in tickets from a 1-unit increase 20.93 20.93
Accident elasticity w.r.t tickets −0.764 −0.628
Mean of dependent variable 0.3627 0.898
Notes: For panel A,N=234,850. For panels B and C, sample period is from January 1, 2002 to January 31, 2003;N=138,204. Regressions include dummies for month-by-year, day of week, holiday weekends, andTreatment Periods.Controls include daily averages of snowfall, snow depth, rainfall, temperature, retail gas prices (plus squared terms), annual averages of population, unemployment rate, number of registered automobiles, trucks, motorcycles, and trailers per 100 miles.
*Significant at 10 percent; **significant at 5 percent; ***significant at 1 percent.
(Table 9, panel B). This exercise helps both to explain why the CIOT program has differential effects on ticket issues across municipalities (even after adjusting for common time trends and municipality fixed effects), and also serves as a robustness check to determine whether we see a larger impact on accidents in municipalities where CIOT had a stronger “bite.”
By Time of Day
104/Do Traffic Tickets Reduce Motor Vehicle Accidents?
2009). Driving at night could be potentially more dangerous because of poorer light conditions and more dangerous drivers (e.g., drunk or fatigued drivers) on the road.
By Gender
The Massachusetts Highway Safety Department did not start collecting demo-graphic data of the drivers involved in motor vehicle accidents until the beginning of 2002, so unfortunately the comparable treatment periods in 2001 cannot be in-cluded in the analyses by gender and age groups. To ensure the results would not be completely discredited without using the control periods in 2001, I run the ba-sic IV regression of accidents on tickets using only data from 2002 onwards. The coefficient on tickets is slightly smaller at−0.369 (SE=0.008), but not statistically different from using the entire sample.
Since it is likely difficult for a driver to ascertain whether a fellow driver on the road being pulled over is male or female, I choose to use the overall number of tickets as the main independent variable of interest (instead of the number of tickets issued to male and female drivers). Table 10, panel B presents the coefficient on tickets using the number of male and female drivers involved in motor vehicle accidents per 100 miles as the dependent variables. While the estimated coefficients on tickets for males and females are close, the implied elasticities are very different. This is because females are involved in much fewer accidents overall (presumably because there are fewer female drivers or because they are more careful drivers). The accident elasticity with respect to tickets for females is−0.72 and−0.24 for males, a striking threefold difference. Given the extensive literature within psychology and sociology that show women tend to be more risk adverse than men (see Croson & Gneezy, 2009, for a review), it is plausible that women are more deterred by traffic law enforcement than men.
By Age Group
Finally, I investigate whether there are heterogeneous impacts of tickets by age group in panel C of Table 10. This is of particular interest to policymakers because young drivers under 25 years old tend to be at most risk on the road (Center for Disease Control, 2009). Again, because it would be difficult for the driver to determine the age of another driver being pulled over, I use the overall number of tickets as the main independent variable. The results imply that the elasticities with respect to tickets are−0.76 and−0.62, for 15 to 24 year olds and 25 to 64 year olds, respectively, and these are not statistically differentiable from one another. Interest-ingly, there does not seem to be marked differences in how tickets affect the two age groups.
CONCLUSION
This paper examines whether traffic tickets affect road safety as measured by motor vehicle accidents. A na¨ıve OLS regression of accidents on tickets suggests that there is no impact of tickets on accidents. However, an analysis using exogenous variation in the number of tickets issued to identify the causal effect of tickets on road safety gives rise to distinctly different results—tickets in fact lead to fewer motor vehicle accidents. Further, tickets help to reduce nonfatal injuries stemming from motor vehicle accidents. In addition, the heterogeneous impact of tickets suggests that there is scope for intervention, for example, by allocating more resources toward municipalities with higher population densities and increase traffic enforcement at night since tickets have a larger impact during nighttime. Also, females appear
Journal of Policy Analysis and Management DOI: 10.1002/pam
to be more deterred by traffic law enforcement than men. However, there do not appear to be differences in the impact of tickets on different age groups. Overall, the findings of this paper suggest that as unpopular as traffic tickets are among drivers, motorist behavior does respond to tickets.
DARA LEE LUCA is an Assistant Professor in the Department of Economics at the University of Missouri and a Visiting Assistant Professor of Public Policy at the Har-vard Kennedy School, 79 John F. Kennedy Street, Cambridge, MA 02138 (e-mail: [email protected]).
ACKNOWLEDGMENTS
I thank Tom Garrett, Michael Luca, Claudia Olivetti, Daniele Paserman, as well as several anonymous referees, for helpful comments and suggestions. I am grateful to Bill Dedman for sharing the tickets data, multiple sources at the Massachusetts Department of Transporta-tion Highway Division for providing the accidents and fatalities data, as well as Barbara Rizutti at the Massachusetts Executive Office of Public Safety and Security for providing the demographic breakdown of accident victims.
REFERENCES
Anbarci, N., & Lee, J. (2008). Speed discounting and racial disparities: Evidence from speed-ing tickets in Boston. IZA Discussion Paper No. 3903. Institute for the Study of Labor, IZA. Retrieved from http://ftp.iza.org.
Antonovics, K., & Knight, B. (2009). A new look at racial profiling: Evidence from the Boston Police Department. Review of Economics and Statistics, 91, 163–177.
Becker, G. (1968). Crime and punishment: An economic approach. Journal of Political Econ-omy, 76, 169–217.
Beenstock, M., Gafni, D., & Goldin, E. (2001). The effect of traffic policing on road safety in Israel. Accident Analysis and Prevention, 33, 73–80.
Bound, J., Jaeger, D., & Baker, R. (1995). Problems with instrumental variables estimation when the correlation between the instruments and the endogenous variable is weak. Journal of the American Statistical Association, 90, 443–450.
Braver, E., Ferguson, S., Greene, M., & Lund, A. (1997). Reductions in deaths in frontal crashes among right front passengers in vehicles equipped with passenger air bags. Journal of the American Medical Association, 278, 1437–1439.
Carpenter, C., & Stehr, M. (2008). The effects of mandatory seat belt laws on seat belt use, motor vehicle fatalities, and crash-related injuries among youths. Journal of Health Eco-nomics, 27, 642–662.
Carr, A. F., Schnelle, J. F., & Kirchner Jr., R. E. (1980). Police crackdowns and slowdowns: A naturalistic evaluation of changes in police traffic enforcement. Behavioral Assessment, 2, 33–41.
Center for Disease Control and Prevention. (2011). Web-based Injury Statistics Query and Reporting System. Atlanta, GA: National Center for Injury Prevention and Control, Centers for Disease Control and Prevention.
Croson, R., & Gneezy, U. (2009). Gender differences in preferences. Journal of Economic Literature, 47, 448–474.
DeAngelo, G., & Hansen, B. (2014). Life and death in the fast lane: Police en-forcement and traffic fatalities. American Economic Journal: Economic Policy, 6, 231–257.
106/Do Traffic Tickets Reduce Motor Vehicle Accidents?
Elder, R. W., Shults, R. A., Sleet, D. A., Nichols, J. L., Thompson, R. S., & Rajab, W. (2004). Effectiveness of mass media campaigns for reducing drinking and driving and alcohol-involved crashes: A systematic review. American Journal of Preventive Medicine, 27, 57–65.
Elliott, H. (2009). Most dangerous times to drive. Forbes.com, January 21. Retrieved August 27, 2014, from http://www.forbes.com/2009/01/21/car-accident-times-forbeslife-cx_he_0121driving.html.
Foss, R. D. (1989). Evaluation of a community-wide incentive program to promote safety restraint use. Australian Journal of Public Health, 79, 304–306.
Garrett, T. A., & Wagner, G. A. (2009). Red ink in the rearview mirror: Local fiscal conditions and the issuance of traffic tickets. Journal of Law and Economics, 52, 71–90.
Levitt, S. (2008). Evidence that seat belts are as effective as child safety seats in preventing death for children aged two and up. Review of Economics and Statistics, 90, 158–163. Makowsky, M., & Stratmann, T. (2009). Political economy at any speed: What determines
traffic citations? American Economic Review, 99, 509–527.
Makowsky, M., & Stratmann, T. (2011). More tickets, fewer accidents: How cash-strapped towns make for safer roads. Journal of Law and Economics, 54, 863–888.
National Highway Traffic Safety Administration (NHTSA). (2014). 2012 Traffic Safety Facts Annual Report. Washington, DC: U.S. Department of Transportation.
Soloman, M., Ulmer, R., & Preusser, D. (2002). Evaluation of Click It or Ticket Model pro-grams. Washington, DC: Department of Transportation National Highway Traffic Safety Administration Technical Summary.
Tison J., Solomon, M., Nichols, J., Gilbert, S., Siegler, J., & Cosgrove, L. (2006). May 2006 Click It or Ticket seat belt mobilization evaluation: Final Report. Washington, DC: National Highway Traffic Safety Administration.
Williams, A., Preusser, D., Bloomberg, R. & Lund, A. (1987). Safety belt use law enforcement in Elmira, New York: A reminder campaign. American Journal of Public Health, 77, 1450– 1452.
Wintemute, G. J. (1992). From research to public policy: The prevention of motor vehicle in-juries, childhood drownings, and firearm violence. American Journal of Health Promotion, 6, 451–464.
Journal of Policy Analysis and Management DOI: 10.1002/pam