Published by:
The National Renal Registry
2
ndFloor, MMA House
124, Jalan Pahang
50286 Kuala Lumpur
Malaysia
Tel.
: (603) 4045 8636
Fax
: (603) 4042 7694
e-mail :
[email protected]
Web site: http://www.msn.org.my/nrr
This report is copyrighted. However it may be freely reproduced without the permission
of the National Renal Registry. Acknowledgment would be appreciated. Suggested
citation is: YN Lim, TO Lim (Eds). Twelfth Report of the Malaysian Dialysis and
Transplant Registry 2004. Kuala Lumpur 2005
This report is also published electronically on the website of the National Renal Registry
at: http://www.msn.org.my/nrr
Funding:
The National Renal Registry is funded with grant s from:
Malaysian Society of Nephrology
The Ministry of Health Malaysia
Baxter Healthcare Asia
Fressenius Medical Care
Roche Malaysia
ACKNOWLEDGEMENTS
The National Renal Registry would once again like to thank the following:
All the nephrologists, physicians and staff of the dialysis and transplant centres for their
continued participation and hard work
Staff of the Clinical Research Centre, in particular Ms Teh Poh Geok for most of the
statistical analysis and Azizah Alimat for the layout and formatting of this report
The Ministry of Health, Malaysia
Our Industry sponsors: Baxter Healthcare (Asia), Fresenius Medical Care and Roche for
their generous support
&
All who have in one way or another supported and/or contributed to the success of the
NRR and this report.
Dr. Zaki Morad
Chairman
National Renal Registry
Malaysia Society of Nephrology
NRR Advisory Committee Members
2004 to 2006
CHAIRMAN:
Dr. Zaki Morad B Mohd Zaher
MEMBERS:
Dr. Lim Teck Onn
Dr. Lim Yam Ngo
Dr. T. Thiruventhiran
Dr. Tan Hee Wu
Dr. Wong Hin Seng
Mr. Tam Chong Chiang
Ms. Norlida Omar
Secretariat
Ms. Lee Day Guat
NRR Office Staff
Clinical Registry
Manager
Ms. Lee Day Guat
Clinical Research
Assistants
Ms. Mardhiah Arifin
Ms. Nor Azliana Ramli
CRC Technical Support Staff
Director
Dr. Zaki Morad B Mohd Zaher
Head
Dr. Lim Teck Onn
Epidemiologist
Dr. Jamaiyah Haniff
Dr. Anita Das
IT Manager
Ms. Celine Tsai Pao Chien
Database Administrator
Ms. Lim Jie Ying
Mr. Sebastian Thoo
Network Administrator
Kevin Ng Hong Heng
Mr. Adlan Ab Rahman
Desktop Publisher
Ms. Azizah Alimat
Statistician
Ms. Teh Poh Geok
Webmaster
Mr. Patrick Lum See Kai
Advisory Committee
Sponsors
NRR Coordinating Office
Source Data Providers
Target groups or Users
About the National Renal Registry………
The National Renal Registry (NRR) has its origin in the Dialysis and Transplant Registry
established by the Department of Nephrology in 1992. The sponsors of NRR are the
Malaysian Society of Nephrology (MSN) and Association of Dialysis Medical Assistants
and Nurses (ADMAN).
The objectives of NRR are to
:
1.
Determine the disease burden attributable to End Stage Renal Disease (ESRD), and its
geographic and temporal trends in Malaysia.
2.
Determine the outcomes, and factors influencing outcomes of Renal Replacement
Therapy.
3.
Evaluate the RRT program.
4.
Stimulate and facilitate research on RRT and ESRD.
5.
Maintain the national renal transplant waiting list.
The NRR organization is as follows:
(NRR) and Malaysian Organ Sharing System (MOSS) and the co-sponsor is the
Association of Dialysis Medical Assistants and Nurses.
Advisory Committee
.
This is the committee established by the sponsors to oversee the operations of the
registry.
National Rena Registry Office
The NRR office is the coordinating center that collects and analyses the data. It publishes
the annual report of Malaysian Dialysis & Transplant Registry and the Directory or
Dialysis Centres in Malaysia. The Clinical Registry Manager (CRM) oversees the daily
operation of the NRR. The Clinical Research Centre of Hospital Kuala Lumpur provides
the epidemiology, statistic and information technology support to NRR.
Source Data Producers
These are the dialysis centres that collect the required data. It is the most critical and yet
difficult element of the system. It has to be systematic and uniform, and producers of
source data need to be trained and motivated to ensure high data quality.
Users or Target groups
These are the individuals or institutions to whom the regular registry reports are
addressed. It is their needs for information to assist in the planning and implementing
disease treatment, control and prevention activity that justify the investment in the
registry. They include:
1.
the Renal community
2.
the RRT provider
3.
the Public health practitioner
4.
the Decision maker in various government and non-government agencies who
have responsibilities for any aspects of ESRD treatment, prevention and control
5.
the Researcher with an interest in ESRD and RRT.
About MOSS………
Cadaver organ transplantation activity has noticeably increased in the last decade in
Malaysia. A recurring issue of concern was how and to whom cadaver organs are
allocated. In 1999, the Malaysian Society of Nephrology (MSN) had established a
committee, which was tasked to initiate the development of a national organ-sharing
network. The network was referred as the Malaysian Organ Sharing System or MOSS in
short, and the committee was thus named MOSS committee
The functions of the MOSS committee thus established then under MSN were to:
1.
Make policy decision concerning MOSS.
2.
Secure funding from various sources to support MOSS operation.
3.
Designate a place to be the coordinating centre for the operation of MOSS.
4.
Canvass the views of nephrologist and other clinical staff involved concerning the
policy and operation of MOSS.
5.
Oversee the operation of the MOSS.
6.
Employ a manager and other necessary support personnel to manage the day-to-day
operation of the MOSS.
7.
Appoint panel of nephrologist to examine eligibility of potential recipients
The objectives of MOSS in turn as established by MOSS Committee were:
1.
To maintain a list of patients who have voluntarily enrolled as potential recipients in
the cadaveric kidney transplantation program
2.
To prioritise the waiting list according to an agreed criteria and scoring system
3.
To update the waiting lists at periodic intervals according to specified criteria
4.
To provide a list of suitably matched potential recipients based on agreed criteria
when a cadaver organ is available
5.
To prepare an annual report of the status of the cadaveric kidney transplantation
program including the waiting list, donor status and outcomes
The National Renal Registry (NRR), which was then sponsored by MSN, was directed to
assist in the setting up of MOSS and to make available its database to support MOSS
operations. From this database, a transplant waiting list was generated and indeed was in
use.
However, the subsequent operations of MOSS such as in entering new patients into the
list, maintaining and updating the list, updating patient’s information and so on, turned
out to be logistically more difficult than had been expected. Over the years, various
manual systems and procedures had been tried to coordinate and support the activities of
the various parties involved in the transplantation process. In particular:
1.
The nephrologist caring for dialysis patients who are potential recipients need to be
able to efficiently put their patients on the list, update their patients’ data, and take
them off the list temporarily or otherwise when necessary.
surgeon will want to review the selected patients’ clinical information relevant to the
transplant surgery.
3.
The National Renal Registry is the channel through which nephrologists or dialysis
centres notify patients in order to put patients on the wait list.
4.
And finally, the MOSS Committee needs to be able to convey its policy and
operational decisions to users, such as on assigning patients to nephrologist for
purpose of managing their wait list status, adjudication on patient eligibility for
transplant and their ranking on the list, final decision on entry into the SOS list.
In early 2004, the MOSS Committee proposed to MSN council to support the
development of a web based system, named eMOSS, to support the operations of MOSS.
The nature of MOSS operations, involving multiple parties spread throughout the country
was ideally suited for web-based automation. The proposal was accepted and funds
allocated for the development. The NRR and the Clinical Research Centre (CRC) were
tasked with undertaking this project, and also to help fund it in part.
Contributing Editors
Chapter Title
Editors
Institution/company
Lim Yam Ngo
Kuala Lumpur Hospital
Chapter 1: Renal
Replacement Therapy in
Malaysia
Lim Teck Onn
Clinical Research Centre, KL
Lim Yam Ngo
Kuala Lumpur Hospital
Chapter 2: Dialysis in
Malaysia
Lim Teck Onn
Clinical Research Centre, KL
Wong Hin Seng
Kuala Lumpur Hospital
Ong Loke Meng
Penang Hospital
Chapter 3: Death and
Survival on Dialysis
Wan Shaariah Bt Md Yusuf
Seremban Hospital
Liu Wen Jiun
Sultanah Aminah Hospital,JB
Alinda Chiu Sze Fung
Kuala Lumpur Hospital
Chew Thian Fook
Seremban Hospital
Chapter 4: Quality of Life
and Rehabilitation Outcome
of Dialysis Patients
Zaki Morad B Mohd Zaher
Kuala Lumpur Hospital
Lee Ming Lee
Seremban Hospital
Susan Pee
Sultanah Aminah Hospital, JB
Lynster Liaw
Penang Hospital
Wan Jazilah Wan Ismail
Selayang Hospital
Chapter 5: Paediatric Renal
Replacement Therapy
Lim Yam Ngo
Kuala Lumpur Hospital
Philip N. Jeremiah
Ampang Puteri Hospital, KL
Chapter 6: Management of
Anaemia in Dialysis Patients Bee Boon Cheak
Selayang Hospital
Ahmad Fauzi Abdul Rahman
Puteri Specialist Hospital, JB
Chapter 7: Nutritional Status
on Dialysis
Tilakavati Karupaiah
Universiti Kebangsaan Malaysia
S. Prasad Menon
Chapter 8: Blood Pressure
Control and Dyslipidaemia
Lee Wan Tin
Subang Jaya Medical Centre
Fan Kin Sing
Gleneagles Intan Medical Centre, KL
Rozina Bt Ghazalli
Penang Hospital
Chapter 9: Management of
Renal Bone Disease in
Dialysis Patients
Claire Tan Hui Hong
Sarawak Hospital
Foo Sui Mei
Ipoh Hospital
Dialysis
Indralingam Vaithiligam
Taiping Hospital
Tan Chwee Choon
Tharmaratnam A/L Rasanayagam
Chapter 11 Haemodialysis
Practices
Shahnaz Shah Firdaus Khan
Tg. Ampuan Rahimah Hospital, Klang
Chapter 12: Chronic
Peritoneal Dialysis Practices
Chang Sean Haw
University Malaya Medical Centre
Goh Bak Leong
Serdang Hospital
Zaki Morad B Mohd Zaher
Kuala Lumpur Hospital
Rohan Malek
Selayang Hospital
Fan Kin Sing
Gleneagles Intan Medical Centre, KL
Prasad Menon
Subang Jaya Medical Centre
Tan Si Yen
University Malaya Medical Centre
Chapter 13: Renal Transplant
FOREWORD
This report of the National Renal Registry continues to document the growth in the dialysis
population. This growth has been contributed by providers from three sectors almost equally ie
the public sector, the private sector and the non governmental organisations which are in the main
charitable organisations. The government has remained the main funding agency for dialysis
treatment. This unique arrangement is seen only in a few countries and in this country has served
us well.
The most consistent growth has been with Hemodialysis (HD) treatment. Continuous Ambulatory
Peritoneal Dialysis (CAPD) which has been available in this country for more than 20 years has
yet to find its optimal position in the overall provision of renal replacement therapy (RRT).
Many nephrologists feel that CAPD should have a greater share of the “RRT market”. Presently
CAPD is available only in public sector institutions. A cost effectiveness study reported in the last
issue of the Registry’s report showed that there is no difference in the cost per life year saved
between HD and CAPD. In this report as was in the previous one, Quality of Life scores were
higher in CAPD compared to hemodialysis patients. The perception that CAPD is more expensive
than HD has led to many doctors not actively advocating this dialysis modality, despite its
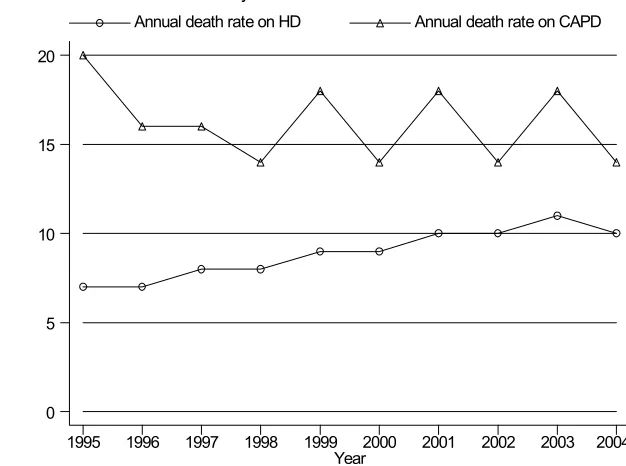
advantage as a home based self-care treatment. This report also showed that the death rate for
CAPD has levelled off in the last few years reflecting perhaps the use of better systems, greater
experience and expertise in the care of these patients.
Renal transplantation rate has remained low for many years. The easy accessibility to dialysis
may have worked against renal transplantation. In the early years of RRT program in this country
a patient did not get on to dialysis unless he has a potential living related donor. The easy access
to cadaveric transplantation in China has also served as a disincentive for the living related renal
transplantation program. The efforts to educate the public and healthcare givers will have to
continue. The nephrologists managing newly diagnosed ESRD patients should actively promote
kidney transplantation particularly among the younger patients.
While the growth has been laudable, a number of issues and challenges are seen as a result of the
rapid expansion. Significant variation in practices was noted and is of some concern as they can
lead to differing outcomes. Blood flow rates, frequency of dialysis and prescribed Kt/V are
amongst parameters shown to vary and all of these have an impact on the adequacy of dialysis.
The registry has undertaken to provide individual centre’s report which captures key parameters
in the provision of dialysis treatment. Centres can evaluate their performance and compare with
the national average and take steps to correct any deficiencies. Such a step hopefully will lead to
better outcomes in the future. Why does such a variation in practice occur? One possible
explanation is the heterogeneous background of the providers. Apart from large institutions like
the Ministry of Health, most of the other providers are stand-alone units. They may have different
approaches to treatment. A more likely reason is the many constraints faced by the NGO centres.
They include finance, expertise and other resources
Ms Lee Day Guat for their untiring efforts in ensuring the report is produced. We have
endeavoured to make the report a readable and informative one which will be of use to all parties.
Zaki Morad Mohd Zaher
Chairman,
National Renal Registry
CONTENTS
Page
Acknowledgements
ii
NRR Advisory Committee Members 2004 to 2006
iii
About
the
National
Renal Registry
iv
About
MOSS
vi
Participating
Haemodialysis Centres
vii
Participating
Peritoneal Dialysis Centres
x
Participating
Transplant follow-up Centres
xi
Contributing
Editors
xii
Foreword
xiii
Report
Summary
xxiv
Chapter
1
ALL RENAL REPLACEMENT THERAPY
1
1.1
Stock And Flow
2
1.2 Treatment
Provision
Rate
3
Chapter
2 DIALYSIS
IN
MALAYSIA
5
2.1
PROVISION OF DIALYSIS IN MALAYSIA (registry report)
6
2.1.1
Dialysis treatment provision
6
2.1.3 Geographic
distribution
(registry
report
6
2.2
DIALYSIS PROVISION IN MALAYSIA (Centre survey report)
7
2.2.1 Dialysis
provision
7
2.2.2
Geographic distribution (centre survey)
9
2.2.3
Growth in dialysis provision by sector
11
2.3
DISTRIBUTION OF DIALYSIS TREATMENT
12
2.3.1 Gender
distribution
12
2.3.2 Age
distribution
13
2.3.3
Method and Location of dialysis
15
2.3.4 Funding
for
Dialysis
Treatment
16
2.3.5
Distribution of dialysis patients by sector
17
2.4
PRIMARY RENAL DISEASE
18
Chapter
3
DEATH AND SURVIVAL ON DIALYSIS
19
3.1
Death On Dialysis
20
3.2
Patient Survival On Dialysis
22
3.2.1
Patient survival by Type of dialysis modality
22
3.2.2
Patient survival by year of starting dialysis
23
3.2.3
Patient survival by Age at starting dialysis
24
3.2.4
Patient survival by Diabetic status
25
Chapter
4
QUALITY OF LIFE AND REHABILITATION OUTCOMES OF
DIALYSIS PATIENTS
26
A
Quality of Life on Dialysis
27
B Work
Related
Rehabilitation 30
Chapter
5
PAEDIATRIC RENAL REPLACEMENT THERAPY
31
A
RRT Provision for Paediatric Patients (younger than 20 years of age)
32
B Distribution
of
Paediatric
Dialysis
34
C
Primary Renal Disease
36
D
Types of Renal Transplant
36
E Survival
Analysis
37
Chapter
6
MANAGEMENT OF ANAEMIA IN DIAYSIS PATIENTS
39
6.1
Treatment of Anemia in Dialysis patients
40
6.2
Iron Status on Dialysis
44
6.3
Haemoglobin Outcomes on Dialysis
52
Chapter
7
NUTRITIONAL STATUS ON DIALYSIS
57
7.1
Serum Albumin Levels on Dialysis
58
8.1
Blood Pressure Control on Dialysis
67
8.2 Dyslipidaemia
in
Dialysis
Patients
75
Chapter 9
MANAGEMENT OF RENAL BONE DISEASE IN DIALYSIS PATIENTS
82
9.1
Treatment of Renal Bone Disease
83
9.2
Serum Calcium and Phosphate Control
84
Chapter
10
HEPATITIS ON DIALYSIS
95
Chapter
11 HAEMODIALYSIS
PRACTICES
100
11.1
Vascular Access and Its Complications
101
11.2 HD
Prescription
103
11.3
Technique Survival on Dialysis
112
Chapter
12
CHRONIC PERITONEAL DIALYSIS PRACTICES
116
12.1
Mode of PD
117
12.2
Achievement of Solute Clearance and Peritoneal Transport
119
12.3
Technique Survival on PD
121
12.4 PD
Peritonitis
125
Chapter
13 RENAL
TRANSPLANTATION
127
13.0 Introduction
128
13.1
Stock And Flow
129
13.2 Recipients’
Characteristics
131
13.3 Transplant
Practices
133
13.4 Transplant
Outcomes
135
13.4.1 Post-transplant
complications
135
13.4.2 Death and Graft loss
136
13.4.3 Patient and Graft Survival
139
APPENDIX I
DATA MANAGEMENT
I
Tables
Table # Item Page
Table 1.01: Stock and Flow of RRT, Malaysia 1995 – 2004 2
Table 1.02: New Dialysis Acceptance Rate and New Transplant Rate per 3
Table 1.03: RRT Prevalence Rate per million population 1995 – 2004 4
Table 2.1.1: Stock and flow – Dialysis Patients 1995 – 2004 6
Table 2.1.2: Dialysis Treatment Rate per million population 1995 – 2004 6
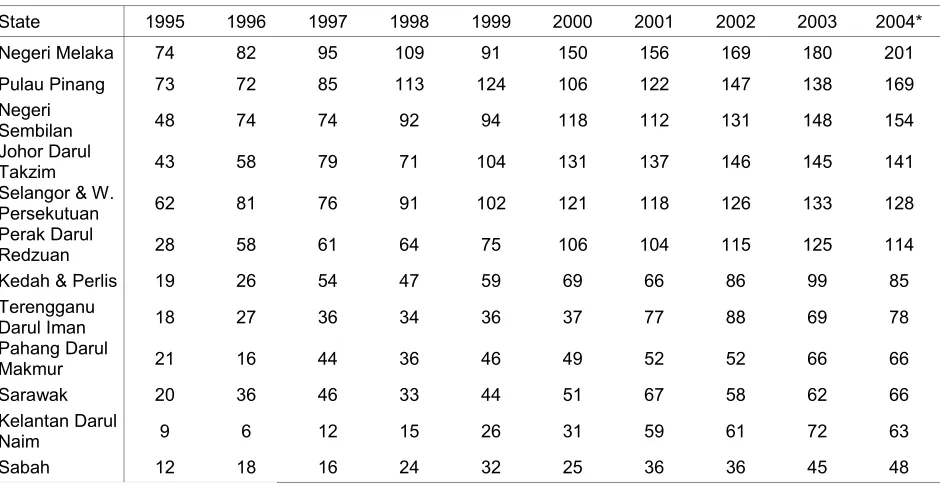
Table 2.1.3: Dialysis Treatment Rate by State, per million state population 1995-2004 6
Table 2.2.1:
Number of dialysis centres, HD machines and treatment capacity by sector, Dec
2004 7
Table 2.2.2:
Number of dialysis centres, number of HD machines and treatment capacity, HD
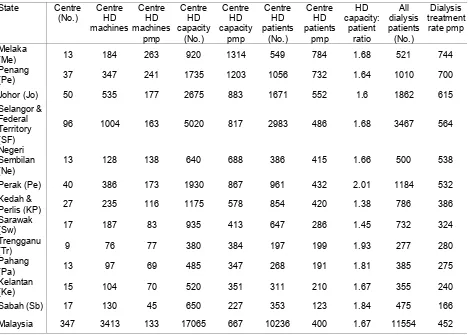
capacity to patients ratio and number of dialysis patients by state in Dec 2004 9
Table 2.2.3:
Growth in HD capacity and HD patients in Private, NGO and MOH sectors,
1999-2004 11
Table 2.3.1(a):
Dialysis Treatment Rate by Gender, per million male or female population 1995–
2004 12
Table 2.3.1(b): Gender distribution of Dialysis Patients 1995-2004 12
Table 2.3.2(a):
Dialysis Treatment Rate by Age Group, per million age group population 1995 –
2004 13
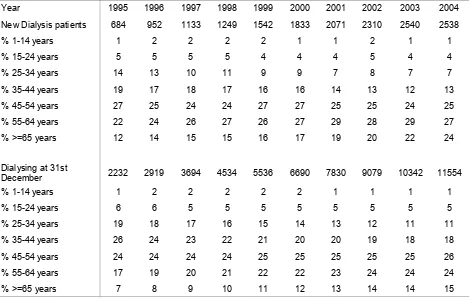
Table 2.3.2(b): Percentage Age Distribution of Dialysis Patients 1995 – 2004 14
Table 2.3.3: Method and Location of Dialysis 1995 – 2004 15
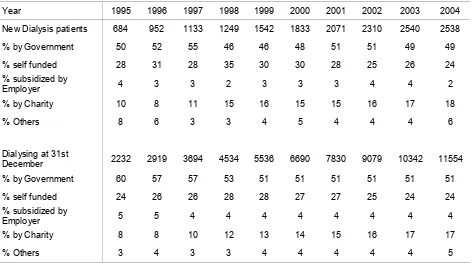
Table 2.3.4: Funding for Dialysis Treatment 1995 – 2004 16
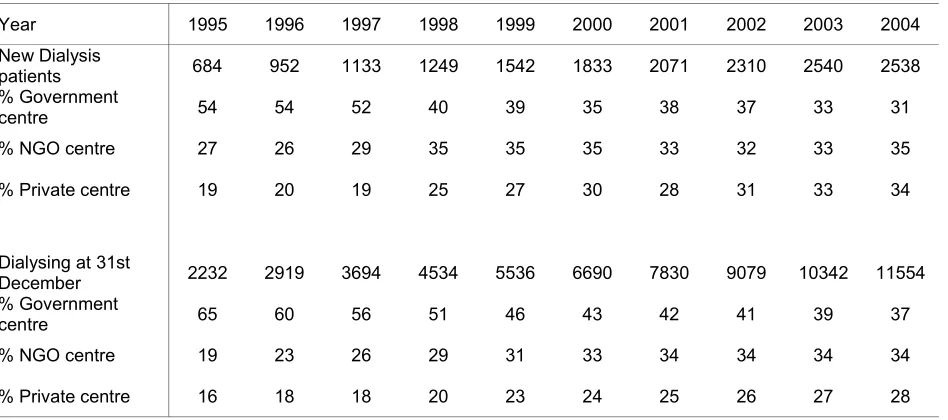
Table 2.3.5: Distribution of Dialysis Patients by Sector 1995 – 2004 17
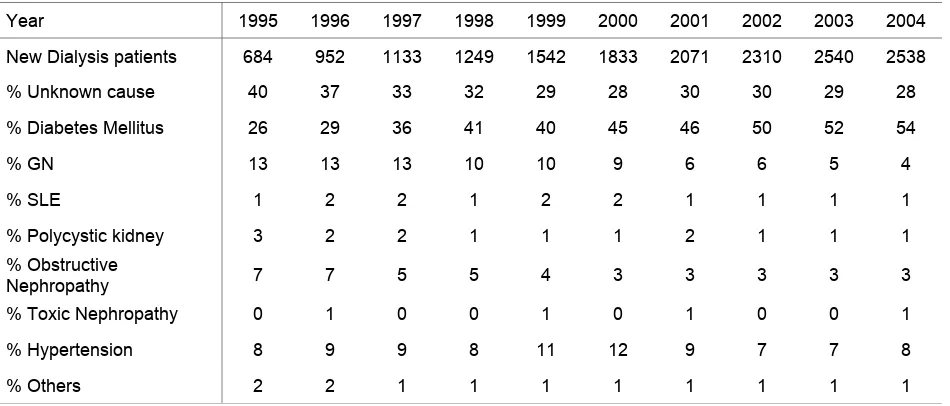
Table 2.4.1: Primary Renal Disease 1995– 2004 18
Table 3.1.1: Deaths on Dialysis 1995 – 2004 20
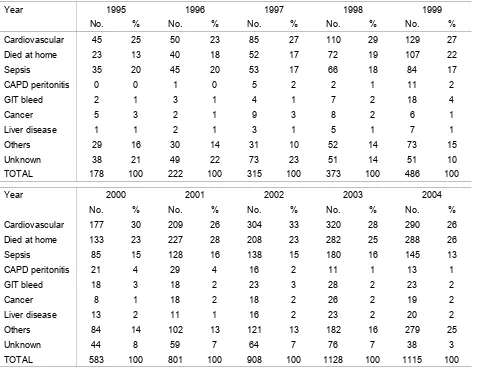
Table 3.1.2: Causes of Death on Dialysis 1995 - 2004 21
Table 3.2.1: Unadjusted patient survival by Dialysis modality, 1995-2004 22
Table 3.2.2: Unadjusted patient survival by year of entry, 1995-2004 23
Table 3.2.3: Unadjusted patient survival by age, 1995-2004 24
Table 3.2.4: Unadjusted patient survival by Diabetes status, 1995-2004 25
Table 4.1:
Cumulative distribution of QL-Index score in relation to Dialysis modality, All
Dialysis patients 1997-2004 27
Table 4.2:
Cumulative distribution of QL-Index score in relation to Diabetes mellitus, All
Dialysis patients 1997-2004 27
Table 4.3:
Cumulative distribution of QL-Index score in relation to Gender, All Dialysis
patients 1997-2004 28
Table 4.4:
Cumulative distribution of QL-Index score in relation to Age, All Dialysis patients
1997-2004 28
Table 4.5:
Cumulative distribution of QL-Index score in relation to Year of entry, HD patients
1997-2004 29
Table 4.6:
Cumulative distribution of QL-Index score in relation to Year of entry, CAPD
patients 1997-2004 29
Table 4.7: Work related rehabilitation in relation to Modality, Dialysis patients 1997-2004 30 Table 4.8: Work related rehabilitation in relation to Year of Entry, HD patients 1997-2004 30 Table 4.9: Work related rehabilitation in relation to Year of Entry, CAPD patients 1997-2004 30
Table 5.01: Stock and Flow of Paediatric Renal Replacement Therapy 1990-2004 32
Table 5.02:
Paediatric Dialysis and Transplant Treatment Rates per million age-group
population 1990-2004 33
Table 5.03:
Dialysis Treatment Rate by State, per million state age group population,
1990-2004 34
Table 5.08: Primary Renal Disease 1990-2004 36
Table 5.09: Types of Renal Transplant 1990-2004 36
Table 5.10: Patient Survival by Modality of RRT, 1990-2004 37
Table 5.11: Dialysis Technique Survival by Modality, 1990-2004 38
Table 5.12: Transplant Graft Survival 1990-2004 38
Table 6.1.1: Treatment for Anemia, HD patients 1997-2004 40
Table 6.1.2: Treatment for Anemia, CAPD patients 1997-2004 40
Table 6.1.3: Variation in Erythropoietin utilization (% patients) among HD centres, 2004 41 Table 6.1.4: Variation in Erythropoietin utilization (% patients) among CAPD centres, 2004 41 Table 6.1.5: Variation in median weekly Erythropoietin dose (u/week) among HD centres 2004 42
Table 6.1.6:
Variation in median weekly Erythropoietin dose (u/week) among CAPD centres
2004 42
Table 6.2.3: Distribution of Serum Ferritin on Erythropoietin, HD patients 1997 – 2004 45 Table 6.2.4: Distribution of Serum Ferritin on Erythropoietin, CAPD patients 1997 – 2004 45 Table 6.2.5: Distribution of transferrin saturation without Erythropoietin, HD patients 1997-2004 46
Table 6.2.6:
Distribution of transferrin saturation without Erythropoietin, CAPD patients
1997-2004 46
Table 6.2.7: Distribution of transferrin saturation on Erythropoietin, HD patients 1997 – 2004 47 Table 6.2.8: Distribution of transferrin saturation on Erythropoietin, CAPD patients 1997 – 2004 47
Table 6.2.9: Variation in iron status outcomes among HD centres 2004 48
(a) Median serum ferritin among patients on erythropoietin 48
(b) Proportion of patients on erythropoietin with serum ferritin > 100 ng/ml 48
(c) Median transferrin saturation among patients on erythropoietin 49
(d) Proportion of patients on erythropoietin with transferrin saturation > 20% 49
Table 6.2.10: Variation in iron status outcomes among CAPD centres 2004 50
(a) Median serum ferritin among patients on erythropoietin 50
(b) Proportion of patients on erythropoietin with serum ferritin > 100 ng/ml 50
(c) Median transferrin saturation among patients on erythropoietin 51
(d) Proportion of patients on erythropoietin with transferrin saturation > 20% 51
Table 6.3.1:
Distribution of Haemoglobin Concentration without Erythropoietin, HD patients
1997 – 2004 52
Table 6.3.2:
Distribution of Haemoglobin Concentration without Erythropoietin, CAPD patients
1997– 2004 52
Table 6.3.3:
Distribution of Haemoglobin Concentration on Erythropoietin, HD patients 1997 –
2004 53
Table 6.3.4:
Distribution of Haemoglobin Concentration on Erythropoietin, CAPD patients 1997
– 2004 53
Table 6.3.5: Variation in Haemoglobin outcomes among HD centres 2004 54
(a) Median haemoglobin level among patients on erythropoietin 54
(b) Proportion of patients on erythropoietin with haemoglobin level > 10 g/dL 54 (c) Proportion of patients on erythropoietin with haemoglobin level > 11 g/dL 55
Table 6.3.6: Variation in Haemoglobin outcomes among CAPD centres 2004 55
(a) Median haemoglobin level among patients on erythropoietin 55
(b) Proportion of patients on erythropoietin with haemoglobin level > 10 g/dL 56 (c) Proportion of patients on erythropoietin with haemoglobin level > 11 g/dL 56
Table 7.1.1: Distribution of serum Albumin (g/L), HD patients 1997-2004 58
Table 7.1.2: Distribution of serum Albumin (g/L), CAPD patients 1997-2004 59
Table 7.1.3:
Variation in Proportion of patients with serum albumin ≥ 40g/L among HD centres
2004 60
Table 7.1.4:
Variation in Proportion of patients with serum albumin ≥40g/L among CAPD
centres 2004 61
Table 7.2.1: Distribution of BMI, HD patients 1997-2004 62
Table 7.2.2: Distribution of BMI, CAPD patients 1997-2004 63
Table 7.2.3: Variation in Proportion of patients with BMI ≥ 18.5 among HD centres 2004 64 Table 7.2.4: Variation in Proportion of patients with BMI ≥ 18.5 among CAPD centres 2004 65
Table 8.1.1:
Distribution of Pre dialysis Systolic Blood Pressure (mmHg), HD patients
1997-2004 67
Table 8.1.2:
Distribution of Pre dialysis Systolic Blood Pressure (mmHg), CAPD patients
1997-2004 68
Table 8.1.3:
Distribution of Pre dialysis Diastolic Blood Pressure (mmHg), HD patients
1997-2004 69
Table 8.1.4:
Distribution of Pre dialysis Diastolic Blood Pressure (mmHg), CAPD patients
1997-2004 70
Table 8.1.5: Variation in BP control among HD centres 2004 71
(a) Median Systolic blood pressure (mmHg) among HD patients 71
(b) Median Diastolic blood pressure (mmHg) among HD patients 72
(c) Proportion of HD patients with Pre dialysis Blood Pressure ≤ 140/90 mmHg 72
Table 8.1.6: Variation in BP control among CAPD centres 2004 73
(a) Median Systolic blood pressure (mmHg) among CAPD patients 73
(b) Median Diastolic blood pressure (mmHg) among CAPD patients 74
(c) Proportion of CAPD patients with Pre dialysis Blood Pressure ≤ 140/90 mmHg 74
Table 8.2.2: Distribution of serum Cholesterol (mmol/L), CAPD patients 1997-2004 75
Table 8.2.3: Distribution of serum Triglyceride (mmol/L), HD patients 1997-2004 76
Table 8.2.4: Distribution of serum Triglyceride (mmol/L), CAPD patients 1997-2004 77
Table 8.2.5: Variation in dyslipidaemia among HD centres 2004 78
(a) Median serum cholesterol level among HD patients 78
(b) Proportion of patients with serum cholesterol < 5.3 mmol/L 78
(c) Median serum triglyceride level among HD patients 79
(d) Proportion of patients with serum triglyceride < 2.1 mmol/L 79
Table 8.2.6: Variation in dyslipidaemia among CAPD centres 2004 80
(a) Median serum cholesterol level among HD patients 80
(b) Proportion of patients with serum cholesterol < 5.3 mmol/L 80
(c) Median serum triglyceride level among CAPD patients 81
(d) Proportion of patients with serum triglyceride < 2.1 mmol/L 81
Table 9.1.1: Treatment for Renal Bone Disease, HD patients 1997-2004 83
Table 9.1.2: Treatment for Renal Bone Disease, CAPD patients 1997-2004 83
Table 9.2.1: Distribution of corrected Serum Calcium, HD patients 1997-2004 84
Table 9.2.2: Distribution of corrected Serum Calcium, CAPD patients 1997-2004 84
Table 9.2.3: Distribution of Serum Phosphate, HD patients 1997-2004 85
Table 9.2.4: Distribution of Serum Phosphate, CAPD patients 1997-2004 85
Table 9.2.5: Distribution of corrected calcium x phosphate product, HD patients 1997-2004 86 Table 9.2.6: Distribution of corrected calcium x phosphate product, CAPD patients 1997-2004 86
Table 9.2.7: Variation in corrected serum calcium levels among HD centres, 2004 87
(a) Median serum calcium level among HD patients 87
(b) Proportion of patients with serum calcium 2.2 to 2.6 mmol/L 88
Table 9.2.8: Variation in corrected serum calcium levels among CAPD centres, 2004 89
(a) Median serum calcium level among CAPD patients 89
(b) Proportion of patients with serum calcium 2.2 to 2.6 mmol/L 89
Table 9.2.9: Variation in serum phosphate levels among HD centres, 2004 90
(a) Median serum phosphate level among HD patients 90
(b) Proportion of patients with serum phosphate ≤ 1.6 mmol/L 90
Table 9.2.10: Variation in serum phosphate levels among CAPD centres, 2004 91
(a) Median serum phosphate level among CAPD patients 91
(b) Proportion of patients with serum phosphate ≤ 1.6 mmol/L 91
Table 9.2.11: Variation in corrected calcium x phosphate product among HD centres, 2004 92
(a) Median corrected calcium x phosphate product among HD patients 92
(b) Proportion of patients with corrected calcium x phosphate product < 4.5 mmol2/L2 92 Table 9.2.12: Variation in corrected calcium x phosphate product among CAPD centres, 2004 93
(a) Median corrected calcium x phosphate product among CAPD patients 93
(b) Proportion of patients with corrected calcium x phosphate product < 4.5 mmol2/L2 93
Table 10.1:
Prevalence of positive HBsAg and positive Anti-HCV at annual survey, HD
patients 1997-2004 96
Table 10.2:
Prevalence of positive HBsAg and positive Anti-HCV at annual survey, CAPD
patients 1997-2004 96
Table 10.3:
Variation in Proportion of patients with positive HBsAg at annual survey among
HD centres, 2004 97
Table 10.4:
Variation in Proportion of patients with positive HBsAg at annual survey among
CAPD centres, 2004 97
Table 10.5:
Variation in Proportion of patients with positive anti-HCV at annual survey among
HD centres, 2004 98
Table 10.6:
Variation in Proportion of patients with positive anti-HCV at annual survey among
CAPD centres, 2004 99
Table 11.1.1: Vascular Access on Haemodialysis, 1997-2004 101
Table 11.1.2: Difficulties reported with Vascular Access, 1997-2004 101
Table 11.1.3: Complications reported with Vascular Access, 1997-2004 102
Table 11.2.1: Blood Flow Rates in HD Units, 1997– 2004 103
Table 11.2.2: Number of HD Sessions per week, 1997 – 2004 104
Table 11.2.3: Duration of HD, 1997 – 2004 104
Table 11.2.4: Dialyser membrane types in HD Units, 1997 – 2004 105
Table 11.2.5: Dialyser Reuse Frequency in HD Units, 1997- 2004 106
Table 11.2.6: Dialysate Buffer used in HD Units, 1997 – 2004 107
(d) Median prescribed KT/V in HD patients 110
(e) Proportion of patients with prescribed KT/V >1.3 111
Table 11.3.1: Unadjusted technique survival by Dialysis modality, 1995-2004 112
Table 11.3.2: Unadjusted technique survival by year of entry, 1995-2004 113
Table 11.3.3: Unadjusted technique survival by age, 1995-2004 114
Table 11.3.4: Unadjusted technique survival by Diabetes status, 1995-2004 115
Table 12.1.1: Chronic Peritoneal Dialysis Regimes, 1997-2004 117
Table 12.1.2: CAPD Connectology, 1997-2004 117
Table 12.1.3: CAPD Number of Exchanges per day, 1997-2004 118
Table 12.1.4: CAPD Volume per Exchange, 1997– 2004 118
Table 12.2.1: Distribution of delivered KT/V, CAPD patients 2003-2004 119
Table 12.2.2:
Variation in proportion of patients with KT/V > 2.0 per week among CAPD centres
2004 119
Table 12.2.3:
Peritoneal transport status by PET D/P creatinine at 4 hours, new PD patients
2003-2004 120
Table 12.2.4:
Peritoneal transport status by PET D/P creatinine at 4 hours, prevalent PD
patients 2003-2004 120
Table 12.3.1: Unadjusted technique survival by Dialysis modality, 1995-2004 121
Table 12.3.2: Unadjusted technique survival by year of entry, 1995-2004 122
Table 12.3.3: Unadjusted technique survival by age, 1995-2004 123
Table 12.3.4: Unadjusted technique survival by Diabetes status, 1995-2004 124
Table 12.3.5: Unadjusted technique survival by Gender, 1995-2004 124
Table 12.4.1: Variation in peritonitis rate (pt-month/epi) among CAPD centres 2004 125
Table 12.4.2: Causative organism in PD peritonitis, 2000-2004 126
Table 12.4.3: Factors influencing peritonitis rate, 2000-2004 126
Table 13.1.1: Stock and Flow of Renal Transplantation, 1975-2004 129
Table 13.1.2: New transplant rate per million population (pmp), 1975-2004 130
Table 13.1.3: Transplant prevalence rate per million population (pmp), 1975-2004 130
Table 13.2.1: Renal Transplant Recipients’ Characteristics, 1975-2004 131
Table 13.2.2: Primary causes of end stage renal failure, 1975-2004 132
Table 13.3.1: Type of Renal Transplantation, 1975-2004 133
Table 13.3.2: Biochemical data, 2004 134
Table 13.3.3: Medication data, 2004 134
Table 13.4.1: Post transplant complications, 2004 135
Table 13.4.2: Transplant Patients Death Rate and Graft Loss, 1975-2004 136
Table 13.4.3: Causes of Death in Transplant Recipients, 1975-2004 137
Table 13.4.4: Causes of Graft Failure, 1975-2004 138
Table 13.4.5: Patient survival, 1993-2004 139
Table 13.4.6: Graft survival, 1993-2004 139
Table 13.4.7: Patient survival by type of transplant, 1993-2004 140
Table 13.4.8: Graft survival by type of transplant, 1993-2004 141
Figures
Figure # Item Page
Figure 1.01: Stock and Flow of RRT, Malaysia 1995 – 2004 2
* (a) New Dialysis and Transplant patients 2
* (b)
Patients Dialysing and with Functioning Transplant at 31st December 1995 –
2004 2
Figure 1.02: New Dialysis Acceptance and New Transplant Rate 1995 - 2004 3
Figure 1.03: Dialysis and Transplant Prevalence Rate per million population 1995 - 2004 4
Figure 2.2.1(a): Distribution of dialysis centres by Sector, December 2004 7
Figure 2.2.1(b): Distribution of HD capacity by Sector, December 2004 8
Figure 2.2.1(c): Distribution of dialysis patients by Sector, December 2004 8
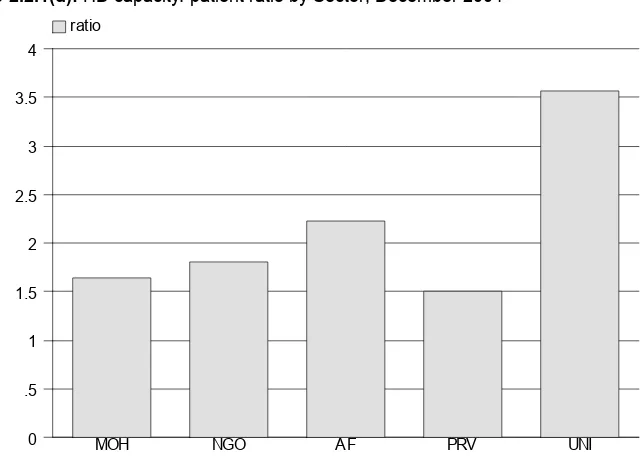
Figure 2.2.1(d): HD capacity: patient ratio by Sector, December 2004 8
Figure 2.2.2(a): Distribution of dialysis centres by State, December 2004 9
Figure 2.2.2(b): Distribution of dialysis patients by State, December 2004 10
Figure 2.2.2(c): Distribution of dialysis treatment by State, December 2004 10
Figure 2.2.2(d): HD capacity to patient ratio by State, December 2004 10
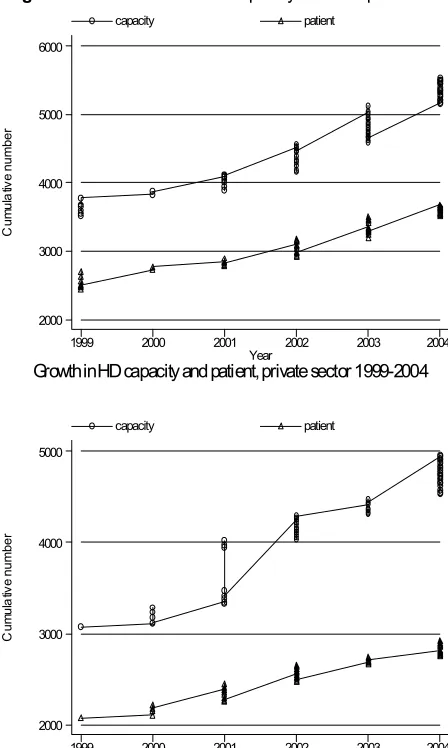
Figure 2.2.3:
Growth in HD capacity and HD patients in Private, NGO and MOH sectors,
1999-2004 11
Figure 2.3.1(a): Dialysis Treatment by Gender 1995 – 2004 12
Figure 2.3.1(b): Gender Distribution of Dialysis patients 1995 – 2004 13
Figure 2.3.2(a):
Dialysis Treatment Rate by Age Group, per million age group population
1995 - 2004 13
Figure 2.3.2(b): Age Distribution of New Dialysis patients 1995 – 2004 14
Figure 2.3.3: Method and Location of Dialysis Patients 1995 – 2004 15
Figure 2.3.4: Funding for Dialysis Treatment 1995 – 2004 16
Figure 2.3.5: Distribution of Dialysis Patients by Sector 1995 – 2004 17
Figure 2.4.1: Primary Renal Disease for New Dialysis Patients 1995– 2004 18
Figure 3.1.1: Death Rates on Dialysis 1995 – 2004 20
Figure 3.1.3: Variation in Death Rates among HD centres, year 2003 22
Figure 3.2.2: Unadjusted patient survival by year of entry, 1995-2004 23
Figure 3.2.3: Unadjusted patient survival by age, 1995-2004 24
Figure 3.2.4: Unadjusted patient survival by Diabetes status, 1995-2004 25
Figure 4.1:
Cumulative distribution of QL-Index score in relation to Dialysis modality, All
Dialysis patients 1997-2004 27
Figure 4.2:
Cumulative distribution of QL-Index score in relation to Diabetes mellitus, All
Dialysis patients 1997-2004 27
Figure 4.3:
Cumulative distribution of QL-Index score in relation to Gender, All Dialysis
patients 1997-2004 28
Figure 4.4:
Cumulative distribution of QL-Index score in relation to Age, All Dialysis
patients 1997-2004 28
Figure 4.5:
Cumulative distribution of QL-Index score in relation to Year of entry, HD
patients 1997-2004 29
Figure 4.6:
Cumulative distribution of QL-Index score in relation to Year of entry, CAPD
patients 1997-2004 29
Figure 5.01a: Incident cases of RRT by modality in children under 20 years old, 1990-2004 32
Figure 5.01b:
Prevalent cases of RRT by modality in children under 20 years old,
1990-2004 32
Figure 5.02:
Incidence and prevalence rate per million age related population years old on
RRT, 1990-2004 33
Figure 5.04: Number of New Dialysis and Transplant Patients by gender 1990-2004 34
Figure 5.05: Dialysis and Transplant Treatment Rate by Age group 1990-2004 35
Figure 5.06: New Dialysis by treatment modality 1990-2004 35
Figure 5.07: New Dialysis by sector 1990-2004 35
Figure 5.10: Patient Survival by Modality of RRT, 1990-2004 37
Figure 5.11: Dialysis Technique Survival by Modality, 1990-2004 38
Figure 5.12: Transplant Graft Survival 1990-2004 38
Figure 6.1.3: Variation in Erythropoietin utilization (% patients) among HD centres, 2004 41
Figure 6.1.4:
Variation in Erythropoietin utilization (% patients) among CAPD centres,
2004 41
Figure 6.1.5:
Variation in median weekly Erythropoietin dose (u/week) among HD centres
Figure 6.1.8:
Variation in use of blood transfusion (% patients) among CAPD centres,
2004 43
Figure 6.2.1:
Cumulative distribution of Serum Ferritin without Erythropoietin, HD patients
1997-2004 44
Figure 6.2.2:
Cumulative distribution of Serum Ferritin without Erythropoietin, CAPD
patients 1997-2004 44
Figure 6.2.3:
Cumulative distribution of Serum Ferritin on Erythropoietin, HD patients
1997-2004 45
Figure 6.2.4:
Cumulative distribution of Serum Ferritin on Erythropoietin, CAPD patients
1997-2004 45
Figure 6.2.5:
Cumulative distribution of transferrin saturation without Erythropoietin, HD
patients 1997-2004 46
Figure 6.2.6:
Cumulative distribution of transferrin saturation without Erythropoietin, CAPD
patients 1997-2004 46
Figure 6.2.7:
Cumulative distribution of transferrin saturation on Erythropoietin, HD
patients 1997-2004 47
Figure 6.2.8:
Cumulative distribution of transferrin saturation on Erythropoietin, CAPD
patients 1997-2004 47
Figure 6.2.9(a):
Variation in median serum ferritin among patients on erythropoietin, HD
centres 2004 48
Figure 6.2.9(b):
Variation in proportion of patients on erythropoietin with serum ferritin >100
ng/ml, HD centres 2004 48
Figure 6.2.9(c):
Variation in median transferrin saturation among patients on erythropoietin,
HD centres 2004 49
Figure 6.2.9(d):
Variation in proportion of patients on erythropoietin with transferrin saturation
>20%, HD centres 2004 49
Figure 6.2.10(a):
Variation in median serum ferritin among patients on erythropoietin, CAPD
centres 2004 50
Figure 6.2.10(b):
Variation in proportion of patients on erythropoietin with serum ferritin >100
ng/ml, CAPD centres 2004 50
Figure 6.2.10(c):
Variation in median transferrin saturation among patients on erythropoietin,
CAPD centres 2004 51
Figure 6.2.10(d):
Variation in proportion of patients on erythropoietin with transferrin saturation
> 20%, CAPD centres 2004 51
Figure 6.3.1:
Cumulative distribution of haemoglobin Concentration without Erythropoietin,
HD patients 1997-2004 52
Figure 6.3.2:
Cumulative distribution of haemoglobin concentration without Erythropoietin,
CAPD patients 1997-2004 52
Figure 6.3.3:
Cumulative distribution of Haemoglobin Concentration on Erythropoietin, HD
patients 1997-2004 53
Figure 6.3.4:
Cumulative distribution of Haemoglobin Concentration on Erythropoietin,
CAPD patients 1997-2004 53
Figure 6.3.5(a):
Variation in median haemoglobin level among patients on Erythropoietin, HD
centres 2004 54
Figure 6.3.5(b):
Variation in proportion of patients on erythropoietin with haemoglobin level >
10 g/dL, HD centres 2004 54
Figure 6.3.5(c):
Variation in proportion of patients on erythropoietin with haemoglobin level >
11 g/dL, HD centres 2004 55
Figure 6.3.6(a):
Variation in median haemoglobin level among patients on Erythropoietin,
CAPD centres 2004 55
Figure 6.3.6(b):
Variation in proportion of patients on erythropoietin with haemoglobin level >
10 g/dL, CAPD centres 2004 56
Figure 6.3.6(c):
Variation in proportion of patients on erythropoietin with haemoglobin level >
11 g/dL, CAPD centres 2004 56
Figure 7.1.1: Cumulative distribution of Albumin (g/L), HD patients 1997-2004 58
Figure 7.1.2: Cumulative distribution of Albumin (g/L), CAPD patients 1997-2004 59
Figure 7.1.3:
Variation in Proportion of patients with serum albumin >40g/L, HD centres
2004 60
Figure 7.1.4:
Variation in Proportion of patients with serum albumin >40g/L, CAPD centres
2004 61
Figure 7.2.1: Cumulative distribution of BMI, HD patients 1997-2004 62
Figure 7.2.2: Cumulative distribution of BMI, CAPD patients 1997-2004 63
Figure 7.2.3: Variation in Proportion of patients with BMI >18.5, HD centres 2004 64 Figure 7.2.4: Variation in Proportion of patients with BMI >18.5, CAPD centres 2004 65
Figure 8.1.1:
Cumulative distribution of Pre dialysis Systolic Blood Pressure (mmHg), HD
Figure 8.1.2:
Cumulative distribution of Pre dialysis Systolic Blood Pressure (mmHg),
CAPD patients 1997-2004 68
Figure 8.1.3:
Cumulative distribution of Pre dialysis Diastolic Blood Pressure (mmHg), HD
patients 1997-2004 69
Figure 8.1.4:
Cumulative distribution of Pre dialysis Diastolic Blood Pressure (mmHg),
CAPD patients 1997-2004 70
Figure 8.1.5(a):
Variation in median systolic blood pressure (mmHg) among HD patients, HD
centres 2004 71
Figure 8.1.5(b):
Variation in median diastolic blood pressure (mmHg) among HD patients, HD
centres 2004 72
Figure 8.1.5(c):
Variation in proportion of HD patients with pre dialysis blood pressure ≤
140/90 mmHg, HD centres 2004 72
Figure 8.1.6(a):
Variation in median systolic blood pressure (mmHg) among CAPD patients,
CAPD centres 2004 73
Figure 8.1.6(b):
Variation in median diastolic blood pressure (mmHg) among CAPD patients,
CAPD centres 2004 74
Figure 8.1.6(c):
Variation in proportion of CAPD patients with pre dialysis blood pressure ≤
140/90 mmHg, CAPD centres 2004 74
Figure 8.2.1: Cumulative distribution of Cholesterol (mmol/L), HD patients 1997-2004 75 Figure 8.2.2: Cumulative distribution of Cholesterol (mmol/L), CAPD patients 1997-2004 75
Figure 8.2.3:
Cumulative distribution of serum Triglyceride (mmol/L), HD patients
1997-2004 76
Figure 8.2.4:
Cumulative distribution of serum Triglyceride (mmol/L), CAPD patients
1997-2004 77
Figure 8.2.5(a):
Variation in median serum cholesterol level among HD patients, HD centres
2004 78
Figure 8.2.5(b):
Variation in proportion of patients with serum cholesterol < 5.3 mmol/L, HD
centres 2004 78
Figure 8.2.5(c):
Variation in median serum triglyceride level among HD patients, HD centres
2004 79
Figure 8.2.5(d):
Variation in proportion of patients with serum triglyceride < 2.1 mmol/L, HD
centres 2004 79
Figure 8.2.6(a):
Variation in median serum cholesterol level among CAPD patients, CAPD
centres 2004 80
Figure 8.2.6(b):
Variation in proportion of patients with serum cholesterol < 5.3 mmol/L,
CAPD centres 2004 80
Figure 8.2.6(c):
Variation in median serum triglyceride level among CAPD patients, CAPD
centres 2004 81
Figure 8.2.6(d):
Variation in proportion of patients with serum triglyceride < 2.1 mmol/L,
CAPD centres 2004 81
Figure 9.2.1: Cumulative distribution of corrected Serum Calcium, HD patients 1997-2004 84
Figure 9.2.2:
Cumulative distribution of corrected Serum Calcium, CAPD patients
1997-2004 84
Figure 9.2.3: Cumulative distribution of Serum Phosphate, HD patients 1997-2004 85
Figure 9.2.4: Cumulative distribution of Serum Phosphate, CAPD patients 1997-2004 85
Figure 9.2.5:
Cumulative distribution of corrected Calcium x Phosphate product, HD
patients 1997-2004 86
Figure 9.2.6:
Cumulative distribution of corrected Calcium x Phosphate product, CAPD
patients 1997-2004 86
Figure 9.2.7(a):
Variation in median serum calcium level among HD patients, HD centres
2004 87
Figure 9.2.7(b):
Variation in proportion of patients with serum calcium 2.2 to 2.6 mmol/L, HD
centres 2004 88
Figure 9.2.8(a):
Variation in median serum calcium level among CAPD patients, CAPD
centres 2004 89
Figure 9.2.8(b):
Variation in proportion of patients with serum calcium 2.2 to 2.6 mmol/L,
CAPD centres 2004 89
Figure 9.2.9(a):
Variation in median serum phosphate level among HD patients, HD centres
2004 90
Figure 9.2.9(b):
Variation in proportion of patients with serum phosphate ≤ 1.6 mmol/L, HD
centres 2004 90
Figure 9.2.10(a):
Variation in median serum phosphate level among CAPD patients, CAPD
centres 2004 91
Figure 9.2.10(b):
Variation in proportion of patients with serum phosphate ≤1.6 mmol/L, CAPD
centres 2004 91
Figure 9.2.11(a):
Variation in median corrected calcium x phosphate product among HD
patients, HD centres 2004 92
Figure 9.2.11(b):
Variation in proportion of patients with corrected calcium x phosphate product
Figure 9.2.12(b): < 4.5 mmol/L, CAPD centres 2004 93
Figure 10.3:
Variation in Proportion of patients with positive HBsAg among HD centres,
2004 97
Figure 10.4:
Variation in Proportion of patients with positive HBsAg among CAPD centres,
2004 97
Figure 10.5:
Variation in Proportion of patients with positive anti-HCV among HD centres,
2004 98
Figure 10.6:
Variation in Proportion of patients with positive anti-HCV among CAPD
centres, 2004 99
Figure 11.2.1: Blood Flow Rates in HD Units, 1997–2004 103
Figure 11.2.4: Dialyser membrane types in HD Units, 1997 – 2004 105
Figure 11.2.7: Cumulative distribution of prescribed KT/V, HD patients 1997-2004 107 Figure 11.2.8(a): Variation in median blood flow rates in HD patients among HD centres 2004 108
Figure 11.2.8(b):
Variation in Proportion of patients with blood flow rates > 250 ml/min among
HD centres 2004 109
Figure 11.2.8(c):
Variation in proportion of patients with 3 HD sessions per week among HD
centres 2004 110
Figure 11.2.8(d): Variation in median prescribed KT/V in HD patients among HD centres 2004 110
Figure 11.2.8(e):
Variation in proportion of patients with prescribed KT/V >1.3 among HD
centres 2004 111
Figure 11.3.1: Unadjusted technique survival by Dialysis modality, 1995-2004 112
Figure 11.3.2: Unadjusted technique survival by year of entry, 1995-2004 113
Figure 11.3.3: Unadjusted technique survival by age, 1995-2004 114
Figure 11.3.4: Unadjusted technique survival by Diabetes status, 1995-2004 115
Figure 12.2.1: Cumulative distribution of delivered KT/V, CAPD patients 2003-2004 119
Figure 12.2.2:
Variation in proportion of patients with KT/V > 2.0 per week among 121CAPD
centres 2004 119
Figure 12.3.1: Unadjusted technique survival by Dialysis modality, 1995-2004 121
Figure 12.3.2: Unadjusted technique survival by year of entry, 1995-2004 122
Figure 12.3.3: Unadjusted technique survival by age, 1995-2004 123
Figure 12.3.4: Unadjusted technique survival by Diabetes status, 1995-2004 124
Figure 12.3.5: Unadjusted technique survival by Gender, 1995-2004 124
Figure 12.4.1: Variation in peritonitis rate (pt-month/ epi) among CAPD centres 2004 125
Figure 13.1.1: Stock and Flow of Renal Transplantation, 1975-2004 129
Figure 13.1.2: New transplant rate, 1975-2004 130
Figure 13.1.3: Transplant prevalence rate, 1975-2004 130
Figure* 13.4.2(a): Transplant Recipient Death Rate, 1975-2004 136
Figure* 13.4.2(b): Transplant Recipient Graft Loss Rate, 1975-2004 136
Figure 13.4.5: Patient survival, 1993-2004 139
Figure 13.4.6: Graft survival, 1993-2004 139
Figure 13.4.7: Patient survival by type of transplant, 1993-2004 140
Figure 13.4.8: Graft survival by type of transplant, 1993-2004 141
Figure 13.4.9: Patient survival by year of transplant (Living related transplant, 1993-2004) 141 Figure 13.4.10: Graft survival by year of transplant (Living related transplant, 1993-2004) 142
Figure 13.4.11:
Patient survival by year of transplant (Commercial cadaver transplant,
1993-2004) 143
Figure 13.4.12:
Graft survival by year of transplant (Commercial cadaver transplant,
REPORT SUMMARY
12th Report of the Malaysian Dialysis and Transplant Registry 2004
REPORT SUMMARY
Dialysis and Transplant Registry 2004 12th Report of the MalaysianREPORT SUMMARY
•
Intake of new dialysis patients showed a linear increase over the years -from 684 in 1995 to 2538
in 2004 with corresponding treatment rates of 33 and 101 per million population.
•
Prevalent dialysis patients increased from 2232 (108 per million) in 1995 to 11554 (452 per
million) at year end 2004.
•
The number of new transplant patients increased from just above 100 in 1995 to 174 in 2004 but
transplant rates remain about 6 per million. Patients with functioning renal transplants increased
from 931(45 per million) to 1587 (61 per million) over the same period.
•
Dialysis treatment rates varied from about 63 per million state population in the economically
underdeveloped states to > 110 per million in the more economically advantaged states.
•
From the centre survey carried out at the end of 2004, there were a total of 11554 dialysis
patients, one third in the Ministry of Health (MOH) hospitals, another third in non-governmental
organization (NGO) centres and about 28% in the private sector.
•
The treatment gap between men and women has remained consistent over the years.
•
Dialysis treatment rates for those < 55 years of age had plateaued while those >65 years continue
to register rapid increase. 51% of new dialysis patients were at least 55 years old
•
At least 85% of new patients were accepted into centre haemodialysis
•
The government continued to fund about 50% of dialysis treatment, NGO funding increased to
18% in 2004, and self funding had decreased to 24%.
•
In 2003, intake of new dialysis patients was distributed equally between the 3 sectors.
•
Diabetes mellitus continues to be the commonest cause of ESRD accounting for 54% in 2004,
followed by hypertension at 8%.
•
The annual death rate for those on CAPD remained relatively unchanged over the last 10 years
while there was an upward trend in the annual death rate for those on haemodialysis.
•
Cardiovascular disease and death at home remained the commonest causes of death in 2004;
accounting for 26% each, sepsis 13%.
•
The unadjusted 5 and 10 year patient survival on dialysis were 59% and 35% respectively. HD
patient survival was superior to that on CAPD.
•
Older and diabetic patients had poorer survival on dialysis.
•
Median QoL index scores were satisfactory. HD patients achieved a lower score than CAPD
patients.
•
Diabetes mellitus and older age group were factors associated with lower median QoL index
scores.
•
Employment amongst HD patients appeared to be positively influenced by increasing years on
HD.
•
73% of HD patients compared to 62% on CAPD were on erythropoietin (EPO). Blood
transfusion rate in dialysis patients remained at 10 -15%.
•
There was decreasing use of oral iron supplements, use of IV Iron has increased.
•
There was variation in the use of EPO and blood transfusion among HD and CAPD centres.
•
Serum ferritin and transferrin saturation had increased over the years.
•
Most dialysis centres had majority of patients with serum ferritin and transferrin saturation above
the acceptable limit.
•
In 2004, the percentage of patients with the haemoglobin > 10 gm/dl varied between 45 to 58 %.
•
For the year 2004, mean serum albumin level was 40 g/L for HD patients and 33 g/L for CAPD
patients.
•
There were wide variations in the proportion of patients with serum albumin >40g/L in both HD
and CAPD centres.
•
There was some variation in proportion of patients with BMI > 18.5 in both HD and PD centres.
•
In 2004, the mean and median predialysis systolic BP in HD patients was 150 mm Hg
respectively. The mean and median predialysis systolic BP in CAPD patients was 141 mmHg.
•
The mean and median predialysis diastolic BP for HD patients were 80.3 mm Hg and 80.4 mm
Hg respectively, while that for CAPD patients were 82.2 mm Hg and 83 mm Hg respectively.
•
There was some variation noted in BP control between the various HD and PD centres.
•
71% of HD patients had total cholesterol level < 5.3 mmol/l versus 53% of CAPD patients. 30%
of HD patients compared to 27% of CAPD patients had elevated serum triglycerides.
•
Use of calcium based phosphate binders among dialysis patients increased with a marked
reduction in the use of aluminium based binders.
•
Serum calcium levels remained within normal levels among both HD and CAPD populations
•
CAPD centres had higher calcium levels compared to HD centres for the year 2004
•
The median serum phosphate levels were lower among patients on CAPD.
•
The mean serum calcium phosphate product was higher among HD patients compared to CAPD
patients. A higher number of centers on CAPD have a median serum calcium phosphate product
less than 4.5 as compared to HD centers (71-78% versus 51.5 –65%).
•
Prevalence of dialysis patients with HBsAg remained at about 4-5%.
•
The prevalence of HCV infection was much higher in HD compared to CAPD patients(5%) but
had decreased after 2001 from 23% to 17% in 2004.
•
There was wide variation in the prevalence of patients with anti HCV antibody among HD
centres.
•
Haemodialysis practices have changed since 1997 to 2004. There was increased use of
brachiocephalic fistulae as vascular access, higher blood flow rates, increased usage of synthetic
membranes , increased number of reuse and universal use of bicarbonate buffer. Median
prescribed KT/V had increased over the years but has plateaued over the last few years at 1.6.
•
There was wide variation in the proportion of patients with KT/V of >1.3 among centres ranging
from below 30% to 100%.
•
Unadjusted HD technique survival was significantly better than unadjusted CAPD technique
survival at 1 year, 5 years and 10 years.
•
Unadjusted HD technique survival was better in the younger age groups and the non diabetics but
was not related to year of starting HD.
•
In 2004, CAPD remained the commonest mode of PD. The Baxter disconnect system was the
commonest connectology used. Ninety-five percent of patients perform 4 exchanges a day, and
most (92%) use a fill volume of 2 L.
•
The median delivered weekly Kt/V was 2.1, with 61% achieving target of 2.0 with a 2-fold
variation between the highest- and the lowest-performing centres (85% vs 43%).
•
81% of prevalent patients had low-average or high-average PET status.
•
One- and 2-year technique survival for CAPD was 82% and 63%
•
Technique survival was better for younger patients, females and non-diabetics but was not related
to the year of starting dialysis.
REPORT SUMMARY
12th Report of the Malaysian Dialysis and Transplant Registry 2004
Chapter 13 Renal Transplantation
•
There were a total of 2650 renal transplantations reported to the Registry between 1975 and
2004; 1587 grafts were functioning at the end of 2004.
•
There were 42 new renal transplantations done in Malaysia in 2004 and 132 done overseas.
•
There were 57 centres of follow-up for renal transplant recipients in 2004.
•
Mean age of new transplant patients in 2004 was 41 + 13 years; 61% were male, 19% diabetic,
6% HbsAg positive and 8% anti-HCV positive at the time of transplantation.
•
In 2004, 98% of prevalent renal transplant recipients were on prednisolone, 80% cyclosporine,
12% tacrolimus, 43% azathioprine and 36% mycophenolate mofetil.
•
In 2004, 32 (2%) of prevalent transplant recipients died and 43 (3%) lost their grafts. Infection
and cancer were the commonest causes of death accounting for 29% and 17% respectively.
Cardiovascular disease was the third commonest cause at 11%. Renal allograft rejection
accounted for 70% of graft loss.
•
Overall transplant patient survival rate from 1993 to 2004 was 95%, 92%, 89% and 80% at 1
year, 3 years, 5 years and 10 years respectively, while the overall graft survival rate was 97%,
93%, 88% and 77% respectively.
Chapter 5: Paediatric Renal replacement therapy
•
Intake of new paediatric dialysis patients increased from 12 in 1990 to 74 in 2004 giving a
dialysis acceptance rate of 1 per million age related population to 7 per million age related
population (pmarp) respectively.
•
New renal transplant rate remained at only 1 pmarp over the last 15 years.
•
At the end of 2004 there were a total of 390 children under 20 on dialysis giving a dialysis
prevalence rate 36 pmarp.
•
The number of patients with functioning transplants in 2004 was 111 giving a prevalence rate of
10 pmarp.
•
Except for Perak, dialysis treatment rates were higher in the economically advantaged states of
Malaysia.
•
The number of 0-4 year olds provided RRT remained very low
.
•
CAPD was the preferred mode of initial dialysis modality.
•
The government provided almost 90% of dialysis funding.
•
Other glomerulonephritidis accounted for 29% of ESRD, focal segmental glomerulosclerosis
11%, and SLE 9%. 30% of patients had unknown primary renal disease.
•
Patient survival on HD was 95% for 1 year, 85% for 5 years and 82% for 10 years. CAPD
patient survival was 95% at 1 year, 81% at 5 years
•
CAPD had worse technique survival compared to HD 2 years after the start of dialysis.
•
Patient survival for renal transplantation was 97% for 1 year, 95% at 5 years and 95% at 10 years
CHAPTER 1
ALL RENAL
REPLACEMENT THERAPY
ALL RENAL REPLACEMENT THERAPY
Dialysis and Transplant Registry 2004 12th Report of the Malaysian1.1. Stock And Flow
Intake of new dialysis patients showed a linear increase over the years from 684 in 1995 to 2538 in 2004.
Prevalent dialysis patients increased from 2232 in 1995 to 11554 at year end 2004. The number of new
transplant patients increased from just above 100 in 1995 to 174 in 2004 and patients with functioning
renal transplants increased from 931 to 1587 over the same period. (table and figure 1.01)
Table 1.01: Stock and Flow of RRT, Malaysia 1995 – 2004
ALL RENAL REPLACEMENT THERAPY
Dialysis and Transplant Registry 2004 12th Report of the MalaysianYear 1995 1996 1997 1998 1999 2000 2001 2002 2003 2004* Functioning transplant at
31st Dec 931 1021 1080 1111 1172 1249 1333 1428 1501 1587 *preliminary results
Figure 1.01: Stock and Flow of RRT, Malaysia 1995 – 2004 (a) New Dialysis and Transplant patients
(b) Patients Dialysing and with Functioning Transplant at 31st December 1995 – 2004
N
Dialysing at 31st Dec
1995 1997 1999 2001 2003
N
Functioning transplant at 31st D
Dialysis acceptance rates showed a three-fold increase over the last 10 years - from 33 per million
population in 1995 to 101 per million population in 2003. (Data for 2004 are preliminary since at the time
preparation of this report there were still many new cases yet to be notified to registry.)
New transplant rates remained low over the years fluctuating between 5-7 per million population per year.
(table and figure 1.02)
1.2 Treatment Provision Rate
Table 1.02: New Dialysis Acceptance Rate and New Transplant Rate per million population 1995 – 2004
Acceptance rate 1995 1996 1997 1998 1999 2000 2001 2002 2003 2004*
New Dialysis 33 45 52 56 68 78 86 94 101 99
New Transplant 5 7 6 5 6 6 7 7 6 7
*preliminary results
ALL RENAL REPLACEMENT THERAPY
Dialysis and Transplant Registry 2004 12th Report of the MalaysianDialysis prevalence rate quadrupled over the last 10 years, increasing from 108 per million population in
1995 to 452 in 2004. The transplant prevalence rates however only increased by one and half times from
45 to 61 per million population over the same period. (table and figure 1.03)
Table 1.03: RRT Prevalence Rate per million population 1995 – 2004
Prevalence rate 1995 1996 1997 1998 1999 2000 2001 2002 2003 2004
Dialysis 108 138 171 204 244 285 326 370 413 452
Transplant 45 48 50 50 52 53 56 58 60 61