Assessment of Critical Coastal Habitats
of the Western Region, Ghana
July, 2011
THE
UNIVERSITY of Rhode Island GRADUATE SCHOOL OF OCEANOGRAPHY
Coastal Resources
This publication is available electronically on the Coastal Resources Center’s website at http://www.crc.uri.edu
For additional information on partner activities:
WorldFish: http://www.worldfishcenter.org Friends of the Nation: http://www.fonghana.org Hen Mpoano: http://www.henmpoano.org Sustainametrix: http://www.sustainametrix.com
For more information on the Integrated Coastal and Fisheries Governance project, contact: Coastal Resources Center, University of Rhode Island, Narragansett Bay Campus, 220 South Ferry Road, Narragansett, Rhode Island 02882, USA. Brian Crawford, Director International Programs at [email protected]; Tel: 401-874-6224; Fax: 401-874-6920.
Citation: Coastal Resources Center and Friends of the Nation. (2011). Assessment of Critical
Coastal Habitats of the Western Region, Ghana. Integrated Coastal and Fisheries Governance Initiative for the Western Region of Ghana. Narragansett, RI: Coastal Resources Center, Graduate School of Oceanography, University of Rhode Island. 132 pp..
Disclaimer: This publication is made possible by the generous support of the American people
through the United States Agency for International Development (USAID)/Ghana. The contents of this report are the responsibility of the Integrated Coastal and Fisheries Governance (ICFG) Program and do not necessarily reflect the views of the United States Government. Associate Cooperative Agreement No. 641-A-00-09-00036-00 for “Integrated Coastal and Fisheries Governance (ICFG) Program for the Western Region of Ghana,” under the Leader with Associates Award No. EPP-A-00-04-00014-00.
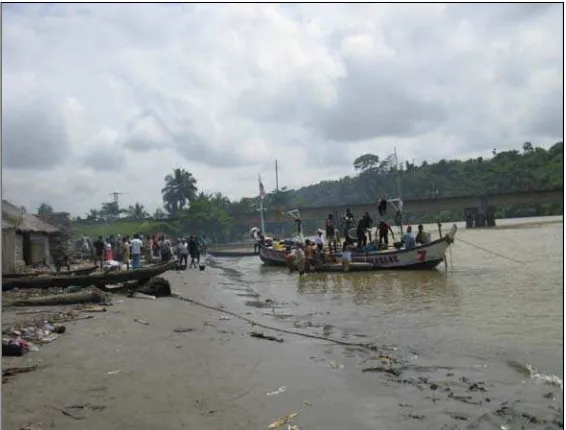
Cover Photo: Ankrobra town, at high tide. Western Region, Ghana.
Photo Credit: F. K. E. Nunoo List of contributors
Dr. F. K. E. Nunoo Prof. D. K. Attuquayefio Mr. B. Y. Ofori
Mr. F. O. Sekou
Table
#
of
#
Contents
#
#
1 INTRODUCTION... 14
1.1 Background ... 14
1.2 Justification ... 15
1.3 Biodiversity Threats in the Western Region – A Review ... 16
1.4 Macro-indicators of ecological health of coastal habitats ... 18
1.5 Water Quality ... 19
1.6 Biodiversity ... 19
1.7 Fisheries ... 20
1.8 Socio-Economic Information including Traditional Knowledge ... 20
1.9 GIS Mapping ... 21
1.10 Habitat classification scheme for the Western Region ... 22
1.10.1 Introduction... 22
1.10.2 Methodology for assessment of condition of coastal and marine habitats ... 23
2 APPROACH AND METHODOLOGY ... 26
2.1 Water Quality ... 26
2.1.1 CTD Deployment ... 26
2.1.2 Water Sampling ... 26
2.1.3 Water Analyses ... 26
2.2 Biodiversity ... 28
2.2.1 Rocky Shore Biota ... 28
2.2.2 Sandy Beach... 28
2.2.3 Shorebirds Enumeration... 28
2.2.4 Terrestrial Vegetation Assessment ... 28
2.2.5 Mammals... 29
2.3 Fisheries ... 31
2.4 Socio-economics including Traditional Knowledge ... 31
2.5 GIS Mapping ... 32
3 CURRENT STATE OF THE SELECTED KEY CRITICAL HABITATS OF THE WESTERN REGION ... 33
3.1 Introduction ... 33
3.2.1 Water quality... 35
3.2.2 Biodiversity... 36
3.2.3 Avifauna... 36
3.2.4 Fisheries ... 36
3.2.5 Fish Composition ... 37
3.2.6 Critical Features and Conservation Significance ... 37
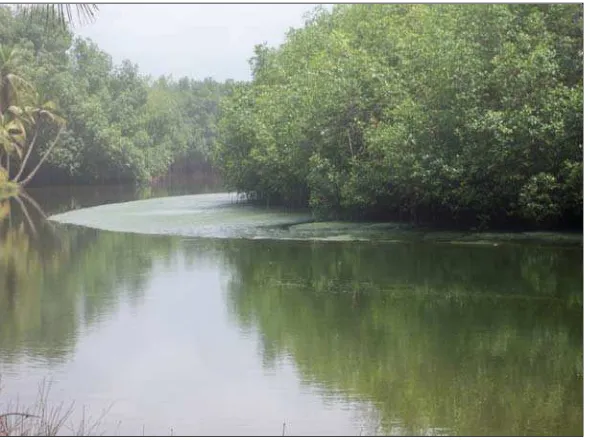
3.3 Domunli ... 38
3.3.1 Water quality... 38
3.3.2 Biodiversity... 39
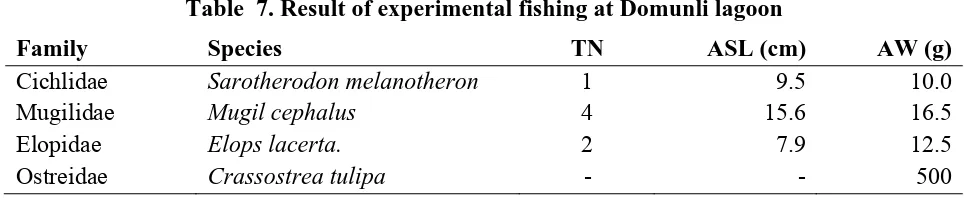
3.3.3 Fisheries ... 40
3.3.4 Critical Features and Conservation Significance ... 41
3.4 Amansuri Main ... 42
3.4.1 Water quality... 42
3.4.2 Biodiversity... 43
3.4.3 Fisheries ... 43
3.4.4 Critical Features and Conservation Significance ... 44
3.5 Azulenoano (Amansuri Outlet) ... 45
3.5.1 Water quality... 45
3.5.2 Biodiversity... 46
3.5.3 Fisheries ... 47
3.5.4 Terrestrial ecosystems... 48
3.5.5 Critical Features and Conservation Significance ... 49
3.6 Ankobra Estuary... 50
3.6.1 Water quality... 50
3.6.2 Biodiversity... 51
3.6.3 Fisheries ... 51
3.6.4 Terrestrial ecosystems... 53
3.6.5 Critical Features and Conservation Significance ... 53
3.7 Miamia ... 54
3.7.1 Biodiversity... 54
3.7.2 Fisheries ... 56
3.7.3 Critical Features and Conservation Significance ... 56
3.8 Kpani-Nyila... 57
3.8.2 Biodiversity... 57
3.8.3 Fisheries ... 59
3.8.4 Terrestrial ecosystems... 60
3.8.5 Critical Features and Conservation Significance ... 60
3.9 Princestown ... 61
3.9.1 Biodiversity... 61
3.9.2 Fisheries ... 62
3.9.3 Critical Features and Conservation Significance ... 62
3.10 Cape Three Points ... 64
3.10.1 Biodiversity... 64
3.10.2 Fisheries ... 66
3.10.3 Critical Features and Conservation Significance ... 67
3.11 Butre ... 69
3.11.1 Water quality... 69
3.11.2 Biodiversity... 70
3.11.3 Critical Features and Conservation Significance ... 71
4 COMPARATIVE ASSESSMENT OF KEY CRITICAL HABITATS AND RECOMMENDATIONS FOR MANAGEMENT ... 72
4.1 Overview of ecosystems of the Western Regions ... 72
4.1.1 Water quality... 72
4.1.2 Biodiversity... 73
4.1.3 Fisheries ... 83
4.1.4 Aquatic mammals ... 83
4.1.5 Floral ecosystems... 84
4.1.6 Socio-economics ... 85
4.1.7 Resource Use ... 87
4.1.8 Environmental issues ... 89
4.1.9 Traditional beliefs and resource management ... 90
4.2 Management Issues and Recommendations ... 92
4.3 Strategic Environmental Monitoring Methods of Critical Habitats ... 94
4.4 Weaknesses and Shortcomings of Survey ... 97
4.5 Conclusions ... 98
Appendix 1. Map of Belibangara Lagoon... 103
Appendix 2. Map of Domunli Lagoon... 104
Appendix 4. Map of Ankobra Estuary... 106
Appendix 5. Map of Miamia Beach ... 107
Appendix 6. Map of Kpani-Nyila and Princess Town beach ... 108
Appendix 7. Map of Cape Three Points... 109
Appendix 8. Map of Butre ... 110
Appendix 9. Results of water quality parameters measured at the various sites ... 111
Appendix 10. List of Terrestrial Avifauna... 113
Appendix 11. Photo Gallery of Common Waterbirds ... 122
Appendix 12. Results from Experimental Fishing ... 124
Appendix 13. Selected Results from Socio-Economic Survey ... 127
List
#
of
#
Figures
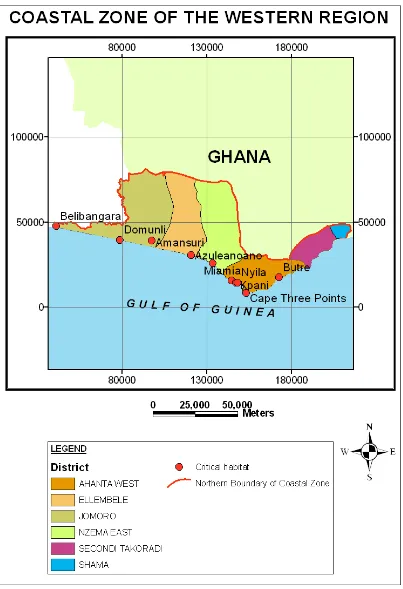
Figure 1. Map of the Western Region of Ghana ... 34Figure 2. Eastern portion of Belibangara ... 35
Figure 3. Domunli Lagoon with fringing mangroves and coconut trees ... 38
Figure 4. Algae clogging the meshes of a newly constructed cast net after a bout of fishing ... 40
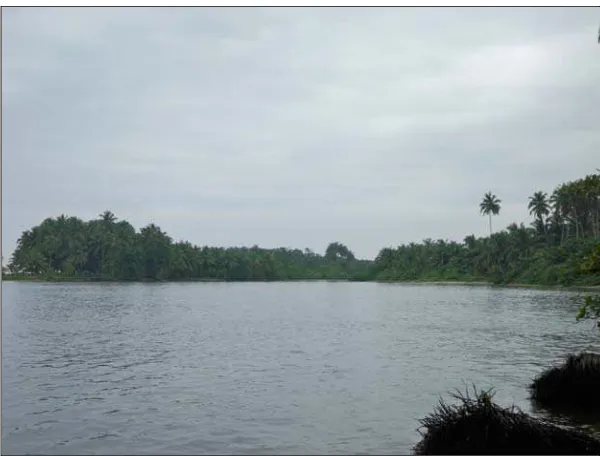
Figure 5. Amansuri wetland with Nzulezu village at the background ... 42
Figure 6. Amansuri outlet with fringing mangroves and coconut palm ... 45
Figure 7. Royal terns (Sterna maxima) in flight and Sanderlings (Calidris alba)... 47
Figure 8. Shorebirds (Sanderlings, rudy turnstones and grey plovers) ... 47
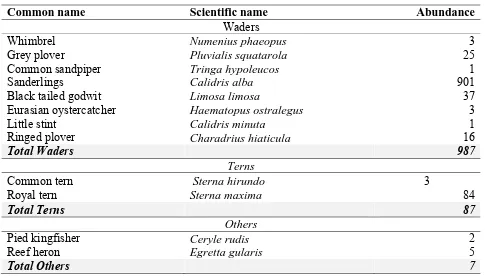
Figure 9. A typical crab trap found at Azulenoanu ... 48
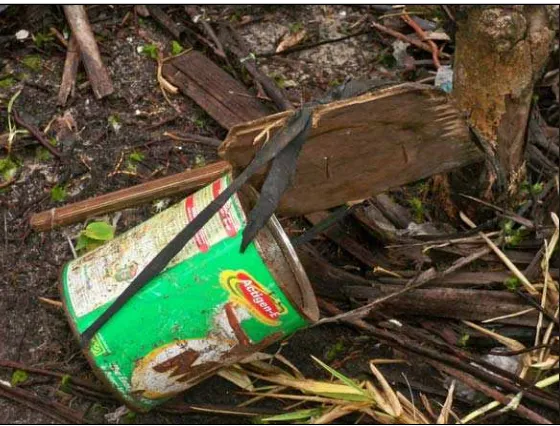
Figure 10. Ankobra Bay at the mouth of the estuary ... 50
Figure 11. Purse seine crew about to land marine fish catch at the estuary ... 52
Figure 12. Rocky (cobble) beach at Eastern Side of Miamia ... 54
Figure 13. Echinometra lucunter and Zanthid colony at Miamia sheltered rocky boulders ... 55
Figure 14. Under rock bivalve and Nudibrachs of the Miamia rocky beach. ... 55
Figure 15. (Left) Kpani-Nyila Estuary. (Right) Adjacent rocky beach (right). ... 57
Figure 16. Dominance of Echinolittorina pulchella and Chthamalus dentate ... 59
Figure 17. Dominance of Choospora minima of rocky outcrop of Kpani-Nyila outlet ... 59
Figure 18. View of beach at Princestown with settlement in background... 61
Figure 19. A Pseudotolithus senegalensis landed at Aketekyi beach... 62
Figure 20. Rocky shore at Cape Three Points... 64
Figure 21. Epibenthic fauna (left) and Thais spp. at Cape Three Points (right) ... 65
Figure 22. Sardinella sp... 67
Figure 23. (Left) Clymene dolphin; (Right) common dolphin and hammer-head shark ... 67
Figure 24. (Left) Butre estuary entering into the sea (Right) Rocky outcrops ... 69
Figure 25. Mouth of Butre estuary... 71
Figure 26. Mastomys sp. (Axim); Acomys sp. (Ankobra)... 78
Figure 28. Crocidura sp. (Axim) ... 78
Figure 29. Lophuromys sp. (Axim)... 78
Figure 30. Percentage composition of ethnic groups ... 86
Figure 32. Percentage composition of respondents’ levels of education... 87
Figure 33. Percentage composition of respondents’ occupations... 87
Figure 34. Percentage composition of respondents’ housing status ... 87
Figure 35. Percentage composition of types of housing roofs... 87
List
#
of
#
Tables
Table 1. Ranking of the various coastal areas along the Western Region of Ghana ... 24Table 2. Selected critical habitats in the Western Region ... 25
Table 3. Abundance of major macrobenthic faunal groups in Belibangara lagoon ... 36
Table 4. Results of experimental fishing at Belibangara ... 37
Table 5. Abundance of macrobenthic faunal groups in Domunli lagoon ... 39
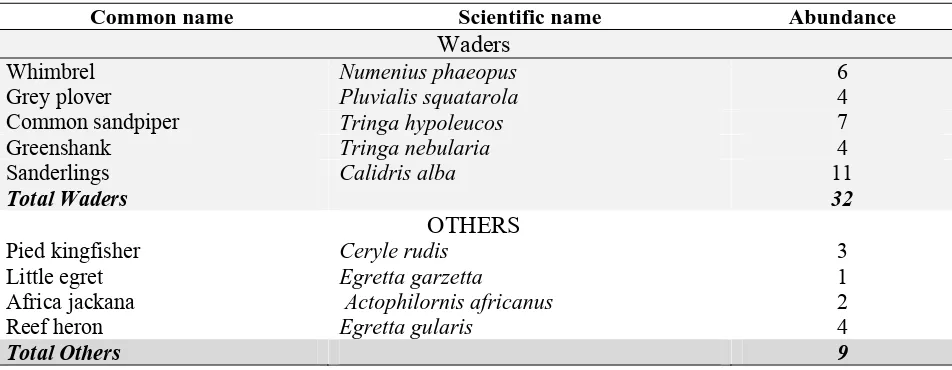
Table 6. Abundance of major shorebird groups recorded at Domunli lagoon. ... 39
Table 7. Result of experimental fishing at Domunli lagoon ... 41
Table 8. Abundance of shorebirds at Amansuri estuary ... 46
Table 9. Abundance of major macrobenthic faunal groups in Ankobra estuary ... 51
Table 10. Abundance of major macrobenthic faunal groups at Miamia ... 54
Table 11. Inventory of rocky shore fauna and macroalgae of the Miamia rocky beach... 55
Table 12. Number of species of fauna and macroalgae at Kpani-Nyila ... 58
Table 13. Inventory of rocky shore fauna and macroalgae of the Kpani-Nyila rocky outcrops .. 58
Table 14. Results of experimental fishing west of Kpani-Nyila ... 60
Table 15. Inventory of rocky shore fauna and macroalgae of the Cape Three Point ... 65
Table 16. Number of species of fauna and macroalgae at Cape Three Points ... 66
Table 17. Inventory of rocky shore fauna and macroalgae of the Butre rocky beach ... 70
Table 18. Number of species of fauna and macroalgae at Butre ... 71
Table 19. Abundance of the major macrobenthic fauna groups ... 74
Table 20. Small Mammal Capture Data from Seven Localities in the Western Region ... 76
Table 21. Checklist of Small Mammals at Seven Localities in the Western Region ... 79
Table 22. Checklist of Large Mammals at Seven Localities in the Western Region ... 79
Table 23. Checklist of Reptiles Recorded from Seven Localities in the Western Region ... 80
Table 24. Checklist of All Faunal Species Recorded and their Conservation Significance ... 81
Acknowledgements
#
Executive
#
Summary
#
Introduction
The Western Region of Ghana harbors several key ecosystems with high value biodiversity. The coastal area of the region is particularly diverse in habitats many of which are unique in terms of biodiversity and provision of ecosystem goods and services. The habitats comprise of lagoon-wetland systems, mangroves estuaries, sandy beaches and rocky beaches. These habitats are considered critical because of their high vulnerability to population growth, urbanization, industrialization and climate change vulnerability. Nonetheless, the main threats to terrestrial and marine biodiversity in the Region have been identified as overexploitation of marine fisheries resources, degradation of coastal habitats, pollution from land and sea based sources, algal blooms, accelerated coastal erosion, increasing population density, weak governance, legislation and institutional framework, potential conflicts and environmental degradation from oil and gas exploitation, climate change and sea level rise, spread of invasive species and acculturation of traditional knowledge. Additionally, these critical coastal areas are often the repositories for contaminants released in coastal areas including potential of oil spills from ongoing oil exploration and production activities in the offshore environment of the region.
Objective
In line with the objectives set out in the call for proposal by CRC_URI, this study aimed to identify, document, map out and analyze key critical coastal habitats in the Western Region. The study was intended to assess the environmental conditions of these habitats deemed crucial to biodiversity and sustenance or generation of ecosystem goods and services. The findings of the assessment will afford ICFG the opportunity of priority actions to undertake geared towards preserving, restoring impaired habitats or maintain/conserve quality habitats for the long-term sustainable benefit. Assessment Methodology
Recommendations and suggestions from the ICFG Biodiversity Threats Assessment report (CRC, 2010), Coastal Wetlands in Ghana (Armah, 1993), Environmental Sensitivity Map for Coastal Areas of Ghana (2004) and expert experiences of DOF/REDO team members enabled the selection of 20 top coastal habitats in the Western Region of Ghana. In essence, the selection of these habitats were informed by their inherent potential characteristics of high ecological diversity, habitat uniqueness, economic importance, current and future anthropogenic impacts, vulnerability to climate change and geographical representation. These habitats/sites were ranked based on cumulative points gained for each of the set criteria/categories. Congruently, the final 10 coastal/marine areas selected for assessment were rearranged according to the Coastal/Marine Ecological Classification Standard, classified as Level 4.
standard and accepted methods. The generated data were analyzed using basic statistics through graphical displays/plots,
Results/Findings
Water Quality
The suitability of the eight (8) selected water bodies for performing ecological and other functions have been assessed. Except for the levels of some trace metals, the water bodies are generally suitable for aquatic life. Currently, Belibangara and Amansuri-main are unsuitable for drinking without treatment. Amansuri outlet, Butre and Kpani-Nyila are suitable for recreational purposes while Ankobra estuary and Domunli lagoon are currently unsuitable for recreational purposes including bathing and swimming.
Benthic infauna
The isopoda and polychaeta were the two dominant groups of the macrobenthic infauna composition of the soft-bottom sandy intertidal habitats. Excirolana species is the dominant taxa,
with a 66.6% frequency of occurrence (F). None of the species observed spanned the whole
studied areas. There was a high proportion of rare species with about 55% of the organisms represented by one or two individuals. This indicates that the macrobenthic fauna within the studied area are in discrete communities and may be influence by a limited set of abiotic factors. The highest abundance of organisms was recorded at the Ankobra beach and Butre reported the lowest.
The polychaete, Capitella capitata and Chironomids were recorded mostly in Belibangara and Domunli lagoons. As Capitella capitata is an opportunistic polychaete, it is considered an important universal indicator of organic pollution in sediments. The presence of populations of C. capitata therefore represents an index of disturbance impact related to organical enrichment.
Rocky Shore Organisms
The abundance and species composition of rocky shore organisms varied between the studied sites. The epibenthic faunal diversity was highest at Cape Three Point area.
Shorebirds
Terrestrial Avifauna
A total of 236 species of terrestrial birds belonging to 46 avian families were recorded in the four study habitats (i.e., Cape Three Point Forest Reserve, Amansuri Wetland, Princess Town and Akatekyi), with the highest number of 168 species recorded at the Cape Three Point Forest Reserve. Eight (8) of the species are listed on the Vulnerable, Near Threatened and Data Deficient categories of the IUCN Red List of threatened species, and observed at the Cape Three Point Forest Reserve (8 species) and the Amansuri Wetland (2 species). Environmental parameters are more likely to remain relatively unchanged over time at the Amansuri Wetland the Cape Three Point Forest Reserve than at the two off-reserve areas. It is therefore recommended that any effort at long term monitoring of changes in environmental conditions with regards to terrestrial birds, should focus on the Cape Three Points Forest reserve and the Amansuri Wetland.
Mammals
There were 45 individual captures of nine species of small mammals belonging to two orders, Rodentia (eight species) and Insectivora (one species). A total captures of 45 individuals in 360 trap-nights indicate overall trapping success of 12.5 %, which is fairly high, given the short duration of the survey. The highest diversity of small mammal species occurred at Amansuri (H’ = 0.63) followed by Ankobra (H’ = 0.63), and Cape Three Points (H’ = 0.57) with two species each. The least diverse localities (H’ = 0.00) Belibangara, Princess Town, and Butre with one species each.
Interviews conducted revealed 14 species of reptiles occurring in the study localities, represented by four species of lizards: Agama agama (agama/rainbow lizard), Mabuya perottettii (orange flanked skink), M. affinis (skink), and Varanus niloticus (Nile monitor lizard). There were seven
snake species, Python regius (royal python), Philothamnus sp. (green tree snake), Dendroaspis
viridis (green mamba), Grayia smythii (water snake), Naja melanoleuca (black/forest cobra), Bitis gabonica (gaboon viper), B. arietans (puff adder). There was one crocodile (Crocodylus niloticus), and two chelonian species.
Fisheries
Vegetation types
In all ecotones, there exist environmental gradients which impose limitations on the spatial distribution of flora. The estuaries of Azulenoanu, Kpani/Nyila, and Ankobra are brackish water environments with mangrove vegetation dominating the saline soils of the estuaries while freshwater swamp forest/thicket vegetation where the soils are non saline. Three main types of vegetation were recognized in the study area as follows: Wet Evergreen Forest – Cape Three Points Forest Reserve (upland); Coastal forest/thicket – rocky terrain, Ankobra and Cape three points; and Freshwater swamp (peat) forest – Amansuri.
Habitat mapping
Digitized basemaps were produced from orthophotos acquired in 2005. The maps produced at various scales between 1:5000 and 1:25000 enabled the identification of features peculiar to each critical habitat, such as the extent of rocky and sandy beaches, vegetation, settlements, etc. Detailed geomorphic assessment at Miamia and Princestown revealed that the rocky beach at Princestown offers protection to the back beach along those sections of the coast, indicating that coastal erosion is not a major issue. Nonetheless, severe erosion at Princestown beach seems to be taking place. Previous interventions using groynes appears to not protect the shoreline. Analysis of 1974 and 2005 shoreline positions indicate that the entire Western Region is eroding at a rate of about 0.35 ± 0.22 m/yr. However, there are certain hotspots (e.g. Princestown) that might be eroding at a faster rate than this and will thus require intervention.
Conclusions & Recommendations
The overall selected habitat assessment of the region indicates important management issues related biodiversity and overall ecosystem integrity/health. Cape Three Points, Ankobra and Belibangara appear to be heavily impacted by humans and require restoration of habitat quality; while the greater Amansuri (Amansuri lagoon and Amansuri outlet), Cape Three Points and Dormunli are important for ecosystem goods and services and need to be protected. As Cape Three Points falls in both categories, it has priority importance for management actions.
The assessment suggests the wider Cape Three Points areas and the Amansuri Estuary as potential biodiversity hotspot that need urgent strategic management attention. These areas have not been significantly impacted by human activities and host huge biodiversity resources including avifauna, macrobenthic organisms, important terrestrial flora and fauna and unimpaired water quality. These areas may be accorded the status of MPAs after a detailed assessment has been carried out and mechanisms put in place. In order to ensure sustainability of the resources, these areas may be developed into biodiversity parks with to generate revenue that could be used for alternate source of livelihood in the area.
1
INTRODUCTION
1.1
Background
The Western Region of Ghana harbors several key ecosystems with high value biodiversity. The coastal area of the region is particularly diverse in habitats many of which are unique comprising of lagoon-wetland systems, mangroves estuaries, sandy beaches and rocky beaches. These habitats are considered critical because of their high vulnerability to population growth, urbanization, industrialization and expansion of settlements. In order to prevent further degradation of such critical habitats, it is highly desirable to determine their current status; including identifying and examining the key indicators that can be used to measure their ecological health and sustainability.
The coastal zone of Ghana spans approximately 550 km and is endowed with numerous living and non-living resources of socio-economic importance, and is characterized by sandy (70%) and rocky (30%) beaches along the entire stretch. The sandy beach stretches from the western portion close to Cote d’Ivoire to Axim and from Prampram to the border with Togo in the eastern part. It has been estimated that about 90 lagoons and associated wetlands are dotted along the entire stretch of the coastline of Ghana (Armah and Amlalo, 1998) of which many are found in the Western Region of the country. There are major rivers (e.g. Volta, Pra, Tano and Ankobra) which drain into the sea, and thus contribute to sediment replenishment in the coastal areas.
The Western Region covers about 10 per cent of Ghana’s total land area (approximately 21,391
km2) with a population of 1.92 million (Ghana Statistical Service, 2002). It is bordered on the
east by the Central Region, the west by Cote d’Ivoire, the north by Ashanti and Brong-Ahafo Regions, and the south by the Gulf of Guinea. There are six coastal Districts, namely Jomoro, Ellembelle, Nzema East Municipality, Ahanta West, Sekondi-Takoradi Metropolis, and Shama. With an average rainfall of 1,600 mm per annum, it is the wettest part of the country and thus has about 75 per cent of Ghana’s high forest vegetation. The Region also has an abundance and wide diversity of coastal habitats that include rocky shorelines, sandy beaches, estuaries, lagoons, mangroves, and inland wetlands. There are many wetland systems some of which are freshwater habitats, unlike the eastern coast of the country where the lagoons are typically brackish. Lagoons of importance in the Western Region are Tano/Aby/Ehy Lagoon at the coastal border between Ghana and Ivory Coast, and Amanzule Lagoon. While five wetlands in the country are designated as Ramsar Sites, none is located in the Western Region. However, the critical habitats in the Western Region of Ghana are an integral component of the coastal ecosystem serving as essential nursery and feeding grounds for numerous marine, avian and terrestrial species of high biodiversity significance.
environmental degradation from oil and gas exploitation, climate change and sea level rise, spread of invasive species and acculturation of traditional knowledge (CRC, 2010). Adding to the heightened sensitivity of coastal habitats is the fact that these areas are often the repositories for contaminants released in coastal areas.
Further, an important harbour in the Western region is the Takoradi port, which is the second largest commercial port in Ghana. The port is expected to receive very large crude carriers (VLCCs) due to development of oil and gas activities in the region. This has the potential for introducing invasive species from ballast water with associated concern of colonization and subsequent destruction of local species.
1.2
Justification
With rapidly evolving development along the coastline of the Western Region catalyzed by urban development, tourism and oil exploration, a thorough assessment of the coastal habitats is needed for both development and conservation planning purposes. This will help to reduce unplanned and chaotic development, especially in wetland areas. More information is therefore needed in the role they play in the fisheries sector, the provision of ecosystem services and functions, as well as in the sustainable development for the coastal communities.
Realizing the economic and ecological importance of the critical habitats in the Western Region and the imminent threats it faces, the Coastal Resource Centre of University of Rhode Island (CRC_URI) planned to carry out an assessment of the critical habitats of the Region among others to inventorize and map out biodiversity hot spots which will constitute an important
baseline information. On 20th July 2010, the Department of Oceanography and Fisheries (DOF)
in partnership with the Resource and Environment Development Organization (REDO) received a letter of award to conduct an assessment of the critical habitats of the coastal habitats of the Western Region.
In line with the objectives set out in the call for proposal by (CRC_URI), the DOF/REDO research group is to;
1. Identify and map the major terrestrial, coastal and marine habitats in the Western Region
2. Assess the condition of habitats considered to be of particular importance to the biodiversity
of the region and to the sustained generation of ecosystem goods and services, and
3. Recommend courses of action that could be undertaken by the ICFG Initiative that are most
likely to preserve and where possible restore the quality and functions of important habitats. Expected outputs from the assessment included the following;
1. Report with detailed information on the current status of coastal and marine habitats
2. Base maps of the coastal habitats, including data files in formats specified in the award; and
3. Recommended planning activities for priority interventions and investments for coastal
1.3
Biodiversity Threats in the Western Region – A Review
In acknowledgement of the vulnerability of the coastal habitats of the Western Region of Ghana, the Biodiversity Threats Assessment (CRC, 2010) carried out an extensive review of available published and unpublished literature, supported by a few site visits and interviews with stakeholders including individuals, public institutions, non-governmental organizations. This was to assess the extent of potential threats, such that a reference point for comparisons with future changes could be made. This report is one of the most comprehensive documentations that have attempted to identify and analyze significant biological areas and their assets, in order to recommend the prioritization of future research activities. However, with the general paucity of published data on floral and faunal biodiversity along the coast of Western Region, although some data may be found in unknown institutional reports, some of the data and statistics presented were out-dated.
The report highlighted important coastal and marine ecosystems found in the six districts of the Western region, and provided a general overview of the numbers and types of predominant floral and faunal biodiversity in the terrestrial, intertidal, marine, lagoonal and estuarine, and freshwater ecosystems. Some important wetlands that are not easily accessible such as Belibangara and Domunli were, however, not given needed prominence in the report. In addition, information on the areal estimates of these ecosystems was either absent or outdated, with minimal information provided on their importance and use to the local communities. The report could have also shown areal maps to illustrate the distribution of the mentioned ecosystems. Most of the data utilized e.g., size, depth and use of habitats, in the analyses were out of date. The current status, which the present study seeks to provide, will help capture any changes that may have occurred in recent years to help inform management and conservation planning. One major contribution of the present document is the provision of updated maps on the various critical habitats and quantification of indicators of their ecological health.
A review of biodiversity assets was made of the marine ecosystems (Madreporarian corals, sandy and rocky shores) and wetland ecosystems (i.e., shallow marine water, rocky marine shores, estuarine waters, salt marshes, mangrove tidal forest, brackish/saline lagoons, coastal freshwater lagoons), which mostly described its fisheries (marine fisheries production and fish species composition). No accounts were provided for water quality status in these ecosystems, an important aspect of any ecological system.
For the terrestrial vegetation types (wet evergreen, moist evergreen, moist semi-deciduous, dry semi-deciduous) and coastal vegetation (saline grassland and evergreen shrubs and thicket, and sand dune vegetation), inadequate information was provided for terrestrial fauna such as small mammals. The focus was mainly on floral biodiversity and birds, although the report also noted major types of invasive species found the coastal waters and gave a summarized account of species of special concern in the Western Region (i.e., marine turtles, manatees, dolphins and shore birds, including important bird areas and biodiversity ‘hotspots’).
species, coastal erosion, changes in species composition and trophic balances, high population growth and invasive species and algal blooms. The report indicated that these threats have been further intensified by weak institutional capacity. However, the issue of weakening traditional structures (such as superstitions and laws) that supported local conservation initiatives should have been included. One of the main contributions to environmental degradation is poor education and non-committal attitude of local communities to environmental protection and conservation. The report also indicated that with the discovery of offshore oil and gas reserves, concerns are being raised about potential conflicts over the use of marine space and environmental impacts. In addition, the global threat of climate change and sea level rise is most likely to severely impact the low-lying coastal areas of Ghana.
In meeting its objectives, the report effectively provided an extensive discussion on the existing institutional arrangements for biodiversity conservation in Ghana; assessed the effectiveness of governance, protected areas and international treaties on biodiversity conservation; enumerated the current priorities for terrestrial and marine biodiversity conservation; and made recommendations for terrestrial and marine biodiversity conservation in the Western Region. Some current priorities identified for terrestrial and marine biodiversity conservation in the Region include:
ク Establishing Marine Protected Areas and Coastal Ramsar Sites at the Amanzule wetlands
and Esiama beach, and the Ahunli and Belibangara lagoons, because of their special biodiversity features
ク Enactment of legislation for the complete protection and conservation of the Cape Three
Points Forest reserve because the “Hot Spot” is under severe threats from anthropogenic activities.
ク Addressing harmful algal blooms and invasive aquatic plants in wetlands and coastal
marine habitat
ク Undertaking fisheries management reform to ensure compliance with fisheries
regulations
ク Protecting endangered species such as marine turtles, cetaceans and manatees
ク Completion, adoption and implementation of Policies, and Strategies and Action Plans
for biodiversity conservation
CRC (2010) concluded by making the following recommendations for biodiversity conservation in the Western Region:
ク Coordinated planning and utilization of coastal zone and resources
ク Improved fisheries management and conservation
ク Protection of existing forest reserves
ク Protection of lagoons and wetlands
ク Awareness creation on habitats and biodiversity values
ク Mitigation and adaptation of Climate change
ク Strengthening relevant governmental and nongovernmental institutions through capacity
building, and
1.4
Macro-indicators of ecological health of coastal habitats
Coastal habitats are important in the provision of ecosystem goods and services to humans. The integrity of the ecosystem (ecological integrity) is measured by its structure and function. The concept of ecosystem health presupposes defining a normative state of natural systems and identifying limits of human intervention (e.g., Costanza et al., 1992). A healthy ecosystem prevents any shift toward a new mode of functioning, by reducing environmental stochasticity that could push the system away from its optimal state and cause undesirable economic or ecological effects. Also, a healthy ecosystem or community might be indicated by ranges of values considered to be normal, and by attributes that are regarded as stable and sustainable. Ostensibly, disruption/destruction of the ecosystem’s health (e.g., value, stability and resilience) due to critical environmental factors (mainly anthropogenic) affects the overall functioning of the system. Ecological indicators are used as a tool to assess the effectiveness of measures to conserve and sustainably use biodiversity. They play an important role in regard to ecological status assessment of critical habitats. The ecological indicators have been shown to detect anthropogenic perturbations on biological communities in critical ecosystems.
As regard ecosystem approach, indicators should be meaningful in terms of ecosystem processes and management. They should integrate information across sectors and thematic areas and be relevant to defined policy goals, thereby providing information essential for decision making. Indicators in general serve four basic functions: simplification, quantification, standardization and communication. They summarize complex and often disparate sets of data and thereby simplify information. They usually assess trends with respect to policy goals. They should provide a clear message that can be communicated to, and used by, decision makers and the general public. Indicators link monitoring, research and policy making. Indicators are capable of tracking changes over time by comparing measured values with a baseline.
An indicator is a measurable parameter whose numeric value reflects a range of conditions or some aspect of ecosystem structure and function that is of interest to scientists and resource managers (e.g., pH, incidence of fish lesions, species diversity, and reproductive success). The best indicators of ecosystem health are measurable features of animal and plant communities and their habitats, including their interactions with human environment. Ecological indicators can be used to assess the condition of the environment, to provide an early warning signal of changes in the environment, or to diagnose the cause of an environmental problem.
Ecological indicators should meet the following criteria: i) be easily measured, ii) be sensitive to stresses on the system, iii) respond to stress in a predictable manner, iv) be anticipatory, v) predict changes that can be averted by management actions, vi) be integrative, vii) have a known response to disturbances, anthropogenic stresses, and viii) changes over time, and have low variability in response. Ideally the suite of indicators should represent key information about structure, function, and composition.
habitats leading to loss in biodiversity, goods and services, among others. Accurate data on the dynamics of these four macro-indicators would therefore be desirable in determining the health status of the coastal habitats. For management purposes, such information would be invaluable in providing the basis for pragmatic decisions to be made by managers and planners. In conformity with current trend in information dissipation, spatial distribution of the habitats and other key indicators and parameters determined in the study will be presented in GIS formats. These in some respects, are also tools for gauging ecological health of habitats.
1.5
Water Quality
Water quality is the overall process of the evaluation of the physical, biological and chemical nature of water. Water quality of an aquatic system is determined by the physical, chemical and biological properties and processes that occur therein. These processes may occur on micro-, meso- or macro-scales and may impact different levels of the ecosystem at different spatial and temporal scales, both positively and negatively. Water quality is critical to the proper functioning of aquatic ecosystems. The number and diversity of organisms in an aquatic ecosystem can be influenced by the overall water quality status. Water quality studies in aquatic ecosystems are an important step towards understanding the processes and conditions that could lead to an improvement of, or deleterious effects, on the ecosystem.
Water quality studies in an aquatic ecosystem usually involve measurement of a number of parameters which is used to determine the suitability of water for performing its ecological functions. These include nutrients (e.g. nitrates and phosphates), chlorophyll ‘a’, temperature, salinity, pH, turbidity, total dissolved solids (TDS), dissolved oxygen (DO), biochemical oxygen demand (BOD), and trace metals concentrations (As, Mn, Cd, Pd, Cu, Fe, Hg and Zn). Microbial contents of the various water bodies are examined to assess total coliform, Escherichia coli (E. coli) and heterotrophic bacteria loads to ascertain its quality for purposes of drinking.
1.6
Biodiversity
The Convention on Biological Diversity (CBD) defines biodiversity in its Article 2 to mean ‘the variability among living organisms from all sources of including, inter alia, terrestrial, marine and other aquatic ecosystems and the ecological complexes of which they are part; this include diversity within species, between species and of ecosystem’ (UNEP, 1992). Biodiversity generally encompasses variety and variability. In other words, it refers to the differences within and between all living organisms at their different levels of biological organization – gene, individuals, species and ecosystem. It is through the myriad interactions among and between these organisms and the biotic environment that the possibility for adaptation arises. Maintaining the potential for adaptation is important because it allows organisms to adapt to modifications in the environment – such as climate change.
ecological balance of the habitat and promote biodiversity resilience over time. As development pressures grow, areas containing unique characteristics have become more vulnerable to pressures from commercial interests and local inhabitants. A good example is the rapid development anticipated in the Western Region of Ghana due to the recent oil discovery and its imminent exploitation by the end of year 2010.
1.7
Fisheries
Marine coastal waters, estuaries and coastal lagoons, as habitats, form an integral part of fisheries and provide important spawning and nursery grounds for many fish species. Fishing in the lagoons and estuaries is restricted to subsistence fishing by local residents in coastal Ghana. However, fishing pressure is high both in the offshore marine areas and in many coastal wetlands and estuaries.
Spatial and temporal gradients in fishing intensity and habitat quality have been used to demonstrate that both fishing and habitat quality are important determinants of fish abundance
(Wilson et al., 2008). The relative importance of these two processes is likely to depend on the
extent of fishing pressure compared to changes in habitat and will vary depending on species susceptibility to fishing versus habitat degradation.
Fishing can change the size distribution of fish communities directly, by decreasing abundance of large individuals, and indirectly, by increases in small individuals. Changes in habitat can also influence the size distribution of lagoon and estuarine fish communities, resulting in a decline in abundance of small size classes, and some increases in larger sizes. A reduction in human populations and shift to alternate sources of income may result in a decline in fishing pressure. However, a prudent and sustainable management of any fishery requires analyses of its nature and dynamics.
1.8
Socio-Economic Information including Traditional Knowledge
Socio-economics basically refers to the study of the relationship between economic activity and social life. There are several methodologies involved in socio-economic research including interviews, field surveys, desk-bound research, ethnography and comparative policy analysis. There are several approaches but in practice a combination that addresses issues relating the objectives of the study seems the best, which in this case, is a critical assessment of coastal habitats in Western Ghana.
The knowledge that an individual has as a result of personal observations, experiences, beliefs or perceptions is known as traditional knowledge. Traditional Ecological Knowledge is generally viewed as a cumulative body of knowledge and beliefs, handed down through generations by cultural transmission, about the relationship of living beings (including humans) with one another and with their environment. This knowledge guides an individual or community’s systems of classification, environmental observations and resource use/management. It includes various types of information such as technologies, skills, practices and beliefs that contributes towards a community achieving stable livelihoods in their unique environment.
Community perceptions about, and uses of, coastal resources have serious implications on the biophysical health of coastal ecosystems. Coastal resources should not be managed from only a biophysical focus, as management also has equally significant consequences on the socioeconomic health of the community.
This information is useful in that it provides historical data and further information on environmental issues that may not be assessed by biophysical data alone. For the purposes of management, indicators of change can be established for further monitoring, scientific findings consistent with community or individual perspectives can be validated, and local observations on temporal and spatial patterns of resource use can be obtained. The engagement with community members also means community perspectives and traditions are incorporated into any decision making process.
1.9
GIS Mapping
1.10
Habitat classification scheme for the Western Region
1.10.1 Introduction
The complexities of coastal and marine environments lead to difficulties in making effective decisions about habitat conservation and resource management. To develop appropriate strategies for coastal and ocean resource management and evaluating conservation priorities, there is the need for a habitat classification system. Ecological classification standards are necessary to address the increasing threats to coastal/marine habitats and resources. The management of single species or the regulation of separate habitats, without reference to the ecosystem, can result in unsuccessful resource protection. Important processes such as biological life cycles, energy flows, watershed linkages, migration patterns, food requirements and trophic dynamics must be considered in the development of management plans for estuarine, coastal and marine systems.
A standardized approach will take into consideration the interactions among all habitats, their biological associations, and the larger ecosystem context. This will provide systematic organization of key information about the system, its physical and biotic components, their relationships to internal and external forces, and the scales of spatial and temporal interactions. A suitable classification scheme should also be easy to use and implemented with existing data without the need for sophisticated tools in acquiring new data.
The Coastal/Marine Ecological Classification Standard (CMECS) (Madden et al., 2004) is a comprehensive framework that provides a structure to characterize habitats in a standard way. This allows for standardized evaluation of information across the national landscape. The hierarchical framework contains eight levels; each containing clearly defined classes and units. The linkages between levels of the hierarchy are defined by ecosystem processes and by spatial relationships.
The hierarchy extends from ecological regions at the largest spatial scale, to habitat and associated biotopes at the smallest, within the following structure:
Level 1 - Ecological Region: Large regions of the coasts and oceans defined by similar
physical and/or biological characteristics
Level 2- Regime: Areas defined by the presence or absence of fresh water
Level 3 - System: Areas that form estuaries, estuarine- influenced areas, or marine waters of shallow, deeper, or very deep water columns
Level 4 - Hydroform/Geoform: Large physical structures formed by either water or solid substrate within systems
Level 5 - Zone: The water column, littoral or sea bottom
Level 7 - Habitat: A specific combination of physical and energy characteristics that creates a suitable place for colonization or use by biota
Level 8 - Biotope: The characteristic biology associated with a specific habitat
1.10.2 Methodology for assessment of condition of coastal and marine habitats
Based on the recommendations from the ICFG Biodiversity Threats Assessment report (CRC, 2010), Coastal Wetlands in Ghana (Armah, 1993), Environmental Sensitivity Map for Coastal Areas of Ghana (2004) and experiences of DOF/REDO team members, a comprehensive list of the top 20 coastal sites and habitats found in the Western Region of Ghana was generated (Table 1). Each of these sites was characterized by its ecological diversity and uniqueness, current and possible anthropogenic impacts, economic importance, and its geographical representation. Based on cumulative points gained for each of these categories, the sites were ranked.
From the generated matrix, sites which fell within the Sekondi-Takoradi metropolis areas and ecosystems that have a considerable degree of research were not selected. The final 10 coastal/marine areas (Table 2) were selected to represent critical habitats found in the Western region of Ghana. Based on the Coastal/Marine Ecological Classification Standard, each of these critical areas was classified to Level 4. There was not much information on physical structures to classify further to Level 7, although a considerable amount of data was generated for Level 8, i.e., biological associations.
Table 1. Ranking of the various coastal areas along the Western Region of Ghana (* low, ** medium, *** high) Rank Name Type of ecosystem Unique Diversity Anthropogenic Economic benefits District
Present Future
Expansion in amenities, wildlife habitat, Fishing
flora and fauna, pristine environment
Ahanta West
6 Abby Lagoon Transboundary
Wetland * ** *** *** High productivity
Jomoro
7 Ankobra Estuary * ** *** *** Mangrove/Fishing/Wildlife habitat Nzema East
8 Dixcove Beach *** **
* ***
oil spill risk Fish landing site for large pelagic
Ahanta West
12 Ankasa Terrestrial/ National
park *** *** * * Tourism
Ellembele
13 Domuli Wetland
** *** ** * mangrove forest/estuary/ wildlife Jomoro
14 Efasu Depressional
wetland ** *** * **
Freshwater lagoon/ Wildlife habitat Jomoro
15 Egyambra Beach
* * *** *** Future Harbor site Ahanta West
16 Essikado Beach
* * *** *** Tourism Sekondi-
Takoradi 17 Essipon Beach
* * *** *** Tourism
Sekondi-Takoradi 18 Belibangara Depressional
wetland * ** ** ** Fishing/ Wildlife habitat 19 Adjoa Beach, near estuary
* * **
erosion
**
erosion Shrimp fishing
Ahanta West
Table 2. Selected critical habitats in the Western Region, classified using CMECS (Madden et al., 2004)
Name/Locality Level 1 – Ecoregion Level 2 – Regime Level 3 – Systems Level 4 – Hydroform/ Geoform
Belibangara
Domunli
Freshwater influenced
Estuarine system Lagoon
Freshwater influenced
Estuarine system Lagoon
Estuary Mangrove
Amansuri Freshwater Estuarine system Lagoon
influenced Estuary
Swamp peat forest
Ankobra Western Region of
Ghana, Gulf of
Freshwater influenced
Estuarine system Estuary
Mangrove
Miamia Guinea, Marine Near shore marine Sandy and rocky beach
Atlantic Ocean Coastal forest
Kpani-Nyila
Freshwater Estuarine system
Estuary
Sandy beach with rocky outcrop Mangrove
Princestown Marine Near shore marine Sandy and rocky beach
Coastal Forest Cape Three Points
Butre
Marine Near shore marine Rocky beach
Coastal Forest
Freshwater Estuarine system Lagoon
2 APPROACH AND METHODOLOGY
2.1
Water Quality
2.1.1 CTD Deployment
A CTD (model ACL 1180-PDK, Alec Elcetronics, Japan) was used in sampling in situ parameters (conductivity, temperature, salinity, turbidity and depth) at 3 different locations in the Belibangara and Amansuri lagoons to study the variations in conductivity, temperature, salinity and turbidity with depth in each lagoon. During deployment, the CTD was allowed to equilibrate
at the surface at each station and then was lowered at a drop rate of 0.5 ms-1 till the CTD touched
the bottom. The depth of the water was recorded with the aid of an on-board echo sounder. The data collected, which was logged in the CTD at every 0.1 m, was uploaded to a computer at the end of each sampling.
2.1.2 Water Sampling
Water samples were collected for dissolved oxygen (DO) and biochemical oxygen demand
(BOD5) determination using the iodometric (titrimetric) method (APHA, 1995). Water samples
for DO analysis were fixed in DO bottles on the field using the Winkler reagents (Winkler I and II). Both samples for DO and BOD were kept on ice and sent to the laboratory for analysis. For turbidity measurements, water samples were collected in 100ml plastic bottles and capped. For nutrients analysis, 100ml plastic bottles were filled with water samples, capped and kept on ice. For chlorophyll analysis, one litre (1L) water samples were filtered through a 0.45µm filter paper (47mm -diameter Whatman GFC) and the residue kept on ice. Water samples for trace metals (As, Cd, Cu, Pb, Hg, Fe, Mn and Zn) analysis were taken into 1L high-density polypropylene bottles previously washed and soaked in analytical grade nitric acid solution. The water samples were then fixed in situwith dilute analytical grade nitric acid to prevent metal oxidation and kept on ice. For microbial analysis, water samples were collected into 100ml sterile plastic containers, capped and placed on ice. All the samples were then transported to the laboratory for analysis. Prior to sampling, all sampling containers were pre-conditioned by rinsing three times with field water sample.
2.1.3 Water Analyses
2.1.3.1 pH, Temperature, Salinity and Total Dissolved Solids (TDS)
2.1.3.2 Turbidity
Turbidity in water samples were determined by the Nephelometric method (APHA, 1995). 2.1.3.3 Dissolved Oxygen (DO) and Biochemical Oxygen Demand (BOD5)
In the laboratory, DO samples were analyzed immediately, whiles BOD samples were
immediately incubated at a temperature of 20oC for five days after which the Winkler reagents
were added. Concentrated H2SO4 was added to both DO and BOD samples (250 ml sample: 2 ml
concentrated H2SO4) prior to analysis in order to dissolve precipitates. For each sample, 50 ml
aliquots were titrated against known concentrations of 0.025M sodium thiosulfate
(Na2S2O3.5H2O) solution using starch as indicator. The titration was repeated two more times
and the average titre value found. For a 200 ml sample, the volume of titrant added is directly proportional to the amount of DO in milligrams per litre (APHA, 1995).
2.1.3.4 Nitrates and Phosphates
Nitrates concentrations were measured using Hach DR/2010 Spectrophotometer according to the Hach Method 8039 (Hach, 2000), after sample treatment with Hach pre-packaged reagents (Nitra Ver 5 Nitrate reagent powder pillow). Phosphates concentrations were determined by the Hach DR/2010 Spectrophotometer according to the Hach method 8048, after sample treatment with Hach prepackaged reagents (Phos Ver 3 powder pillow reagent).
2.1.3.5 Chlorophyll
Chlorophyll pigments were extracted with acetone-water mixture (9:1 v/v). The extracts were then analyzed at 630 nm, 647 nm, 665 nm and 750 nm wavelengths using a Hach DR/2010 spectrophotometer. Using the appropriate formula, chlorophyll content was calculated.
2.1.3.6 Trace Metals
Fe and Pb were analyzed by flame atomic absorption spectrometry (AAS) while Mn, As, Hg, Cd, Cu, and Zn were analyzed using instrumental neutron activation analysis (INAA).
2.1.3.7 Total Coliform, E. coli and Total Heterophic Bacteria
The methods for analyses were the APHA 9222A for total coliform, APHA 9260F for E. Coli and APHA 9215B for total heterotrophic bacteria. Briefly, known quantities of the sample were
plated onto a non-selective agar medium. After pre-incubation at 20-25oC for-2 hours, a selective
medium containing lactose was poured on the agar and consequently incubated at 44oC for 24
2.2
Biodiversity
The methodology employed for the study varied from habitat to habitats and species to species. These methods are briefly described in the following sections.
2.2.1 Rocky Shore Biota
The flora and fauna on the rocky intertidal areas of Butre, Dixcove, Axim, Princess Town, Cape Three Points, and Miamia were assessed qualitatively and semi-quantitatively during periods of low tide. The species identification was carried out using taxonomic manuals and articles (e.g., Edmunds, 1978; John et al., 2003).
2.2.2 Sandy Beach
Quantitatively sampling of intertidal sandy macrobenthic infauna was carried out using a 30 x 30 box corer. Three replicates were taken from each site with the interval between each replicate location approximately 100 m.
2.2.3 Shorebirds Enumeration
Observations of the shorebirds were made using a Nikon 60 mm, 7-50x zoom binoculars in the mornings (06:30 GMT). The birds were either counted (small sized flock) or estimated (large flock). The enumeration was done within the 200 m radius and ensured that double counting was avoided. The social activities of the shorebirds were observed at each site. It should be indicated that each site was visited once.
2.2.3.1 Transect Counts of Terrestrial Birds
Terrestrial birds survey in the four study areas was carried out using mainly transect counts and opportunistic observations. Transect count was carried out along footpaths, trails and other access ways within each of the four study areas. Transects were selected to cover all the identifiable habitat fragments in each of the four study areas. Counts were usually carried out between 6:00 and 10:00 am and between 3.00 and 5.30 pm when birds were most active and usually over a transect distance of 3-5 kilometers. Transect count procedure involves slow attentive walks along transects during which any bird seen or heard is identified and recorded. With the primary purpose of identifying presence of species, no distance limit was set and hence any species seen or heard anywhere in and around any of the study sites was identified and recorded. Field data for each of the four study areas was complimented with data from existing previous ornithological work. Borrow and Demey (2001) was used as the main reference for confirming the identity of species encountered.
2.2.4 Terrestrial Vegetation Assessment
vegetation types were image-based coupled with ground-truthing. Species were surveyed within the identified vegetation types.
2.2.4.1 Field Sampling
Field sampling took place at preselected examples of each vegetation type. Selection of the units was based on unclassified polygon map produced during the initial classification of the vegetation units in the study area. Point locations in the study area were sampled to verify the vegetation type and identify dominant floristic groups. Quantitative information for plant diversity estimates was obtained by sampling in plots at a subset of these locations. The vegetation units sampled included representative examples of all vegetation types in the study site. Sampling locations or points were precisely geolocated with a GPS receiver. Species were
identified out to 20 meters in a 360o “sweep” around the sampling point. Plots of size 25 m x 25
m (Hall and Swaine, 1981) for forest and 10 m x 10 m for shrubs and grassland were established at sampling locations for quantifying diversity. Species of conservation concern in the vegetation types will be determined by making references to IUCN threat categories and the Star Rating system of Hawthorne, 1993.
2.2.5 Mammals
2.2.5.1 Direct/Opportunistic Observation
Direct opportunistic observation of large mammals and reptiles at the study sites, involved undertaking transect walks through walking trails or paths in various microhabitats in the seven survey sites, and recording any animal sightings or sounds (vocalizations).
2.2.5.2 Refuge Examinations
Refuge examinations/litter search involved visual scanning of terrains to record any mammals or reptiles seen hiding under rocks, in fallen logs, rotten tree stumps, and in leaf litter (litter search). 2.2.5.3 Animal Spoors
The spoor of animals (i.e. any sign left by a living animal, such as feeding sites, regular pathways, tracks, footprints, faecal pellets, nests, etc.) were also recorded as evidence of the existence of certain species in the survey area.
2.2.5.4 Interviews
2.2.5.5 Small Mammal Live-Trapping
Small mammals were live-trapped using standard Sherman Collapsible Traps (23 cm x 9 cm x 7.5 cm). Thirty traps were laid at 10-metre intervals along 300-metre transects cut through representative vegetation in each of the seven study sites. The traps were checked twice daily, early in the morning and late afternoon for two consecutive nights at five sites (Belibangara, Amansuri, Ankobra, Axim and Cape Three Points) and one night for two sites (Butre and Princes Town). The total number of trap-nights was therefore 360 (1 trap-night = 1 trap set for one night).
Captured animals were euthanized with chloroform, identified on the spot (if possible), sexed, aged, weighed, and examined for reproductive condition. Standard measurements (body, tail, ear, and hind limb lengths) of all the animal specimens were taken. All the captured specimens were serially labelled and preserved in formalin. Specimens that could not be immediately identified in the field were later identified in the vertebrate museum of the Zoology Department, University of Ghana, and with the help of Kingdon (1997). Small mammal field handling techniques were as outlined in Wilson et al. (1996).
Species of international Conservation Concern (i.e., species listed by IUCN and CITES) were identified and recorded.
2.2.5.6 Analysis of Data
Relative Abundance
This is the number of individuals of a particular species in a particular habitat per 100 trap-nights. Captured small mammal species in the various habitats will be estimated as follows:
Relative abundance (Ar) = Ni x 100 TN
Where, Ni = Number of individuals of a particular species in a particular habitat, TN = Number of
trap-nights in a particular habitat (1 trap-night = one trap set for one night) Species Diversity
Species diversities were estimated using the Shannon-Weiner index (H) as follows:
H = -Σ pi ln pi
where: H = Shannon-Wiener Diversity Index, pi = proportion of the ith species in the total
2.3
Fisheries
Ten (10) fish landing ports were selected in the study area for field visits (Annex 1). These were: Belibangara, Amansuri main, Domunli lagoon, Amansuri estuary at Azulenoanu, Ankobra estuary, Butre, Dixcove, Princess Town, Axim and Miamia.
Major activities undertaken were as follows:
ク Purchase of fish samples from artisanal fishers for collection of basic biological data,
ク Experimental fishing using hired local fishers utilizing diverse gears at designated coastal
areas,
ク Inspection and identification of gears deployed and catches by the fishers at the fish landing
ports in the study area
ク Enumeration of active canoes to provide information on the fishing effort
ク Interaction and interview of fishers.
2.4
Socio-economics including Traditional Knowledge
A one-time socio-economic assessment was carried out in the main town in selected study sites - Amansuri, Ankrobra, Butre, Cape Three Points, Dixcove, and Princestown. Data collection was based on a semi-structured questionnaire with a mix of specific and open-ended questions that allowed the respondents to expand on any other issues of importance. Individuals were approached and interviewed to assess their socio-economic status. Opinion leaders were targeted based on the fact that they would have access to more information and traditional knowledge of the area and its environs. The selected respondents were then invited to join other interviewed community members for a focal group discussion on the community’s environmental and traditional practices. In each town, between 10 and 15 individuals were interviewed.
The indicators selected reflect the general objectives of the study – to assess the condition and trends in changes of critical habitats, and to obtain traditional information on resource use and management. As little information is available or accessible, this study establishes baseline information that can be monitored for changes over time. A list of indicators was created (Tables 1 and 2) based on literature for socio-economic assessments of coastal communities and upgraded with additional indicators for the specific objectives of the study.
2.4.1.1 Data analysis
General Information Status
Sex Standard of living
Age Residential status
Ethnic group Social amenities
Language spoken Environmental awareness
Religion Marital status Children in school Occupation Level of education
Notes from the semi-structures component of the focal group discussions are presented according to the themes (with selected indicators) below:
Resources Environmental issues Traditional beliefs and
Resource collection Bush fires resource management
Farming Floods Culture
Fishing Erosion Natural/sensitive sites
Hunting Climate change Conservation practices
Water Resource degradation Regulatory measures
Energy Waste disposal
Health
Flora and fauna
2.5
GIS Mapping
3
CURRENT STATE OF THE SELECTED KEY CRITICAL HABITATS
OF THE WESTERN REGION
This chapter presents habitat-based findings of the field and laboratory survey. For each habitat data is presented on water quality, marine, coastal and terrestrial biodiversity, fisheries, socio economics of adjacent coastal communities, and digital maps provided. Issues of critical conservation significance are discussed and management strategies identified for each habitat.
3.1
Introduction
The habitats are presented geographically in their order of location along the coastline from west to east (Figure 1):
1. Belibangara
Coastal freshwater lagoon with no open link to the sea and serves as a wildlife habitat, fishing habitat, transportation means and for water abstraction for domestic usage.
2. Domunli
A small estuary, with an intact and rich mangrove forest.
3. Amansuri Main
Network of freshwater and brackish water lagoons with the only known intact swamp peat forest in Ghana
4. Azulenoanu (Amansuri Outlet)
An estuary lined by mangroves with significant submerged stands of the water lily plant, Nymphaea lotus
5. Ankobra
An estuary marked by degraded mangroves along the fringes.
6. Miamia
Sandy beach with rocky boulders at the eastern side, sheltered from the impact of the open sea waves by a coastal forest.
7. Kpani-Nyila
An estuary formed by the two rivers of Kpani and Nyila, has a breached sand bar and healthy mangroves on the fringes.
8. Princestown
Long stretch of sandy beach with some portions interspersed with submerged rock.
9. Cape Three Points
The only forest reserve of primary forest, located adjacent to a rocky beach.
10. Butre
3.2
Belibangara
The Belibangara habitat/site is located at New Town, which is the furthermost town in the Jomoro District of the Western Region and adjacent to Cote d’Ivoire (Appendix 1). It is a coastal freshwater lagoon with no open link to the sea and serves as a wildlife habitat, fishing habitat, transportation means and for water abstraction for domestic usage.
The water body has religious and traditional values to the community as they worship it as a deity. The local community believes the spirit of the Belibangara abhors dirt and filth, as such use of outboard motors and refuse dumping are not permitted in it. Significant portions of the lagoon are covered by aquatic weeds dominated by the water lily plant Nymphaea lotus (Figure 2). The observed deterioration of aquatic vegetation in the lagoon has perhaps given rise to eutrophication and siltation. This is, in no small way, contributing to the reduction in size of the lagoon.
Figure 2. Eastern portion of Belibangara lagoon showing excessive growth of aquatic vegetation
3.2.1 Water quality
The details of the water quality results (Appendix 2) of the Belibangara lagoon shows that dissolved oxygen (DO), pH and phosphate levels were within internationally acceptable limits. Mean nitrate concentration, however, exceeded the NOAA/USEPA recommended range for the avoidance of algal blooms in estuaries and coastal ecosystems (Appendix 9). The N:P ratio was approximately 44:1, which far exceeded the recommended N:P ratio limit of 10:1, indicating that the system can support less species diversity (NOAA/USEPA, 1988). For trace metals, Cd and Pb concentration in the lagoon were below laboratory detection limit. However, mean levels of Zn, Cu, Fe, Hg and As exceeded the WHO recommended limits for aquatic life (Appendix 2).
Standards GS 175 of zero tolerance for coliform bacteria. This suggests that the consumption of the water without treatment could pose serious health threats to the community who depend on the lagoon for drinking water.
3.2.2 Biodiversity
3.2.2.1 Macrobenthic fauna
The macrobenthic fauna composition within the lagoon comprised of only three taxonomic groups – Isopods, Polychaetes and ‘Other’ taxa (Table 3). Isopods were solely represented by Excirolana latipes, polychaetes by Capitella capitata, whilst chironomids constituted the ‘Other’ taxa.
Table 3. Abundance of major macrobenthic faunal groups in Belibangara lagoon
Taxa Abundance Percent Abundance (%)
Isopods 10 71.4
Polychaetes 2 14.3
Others' 2 14.3
Total 14 100
3.2.3 Avifauna
Shorebirds’ populations at Belibangara was relatively low, with only two species recorded (one bird each of Actophilornis africanus (Africa jackana) and Milvus migrans (Black kite)). This could possibly due to unreliable source of food items for these birds due to unexposed substrate as a result of high water level. Exposure of wetland substrate could lead to rapid exposure of fresh patches of unexploited feeding areas which would consequently attract foraging birds. Foraging waterbirds are uncertain about their chances of success on arrival at a patch and therefore sample their environment to get information on the presence of food so as to ‘make decisions’. Since the decision on whether to keep on feeding or leave a patch depends largely on prey encounter rates. It is therefore reasonable to assume that the low numbers of birds is related to low encounter rate of prey items (e.g. invertebrates) possibly due to organic pollution as indicated by high levels of nitrate. The observation is expected due to high residence time and low flushing rate of pollutants since the water body is an enclosed system.
3.2.4 Fisheries
3.2.4.1 Fishing Effort