ENTERPRISE SURVEY AND
INDICATOR SURVEYS
SAMPLING METHODOLGY
August 29th, 2009
INTRODUCTION
1. The World Bank’s Enterprise Surveys (ES) collect data from key manufacturing and service sectors in every region of the world. The Surveys use standardized survey instruments and a uniform sampling methodology to minimize measurement error and to yield data that are comparable across the world’s economies. Most importantly, the Enterprise Surveys are designed to provide panel data sets. Because panel data is one of the best ways to pinpoint how and which of the changes in the business environment affect firm-level productivity over time, the Enterprise Survey team has made panel data a top priority.
2. The use of properly designed survey instruments and a uniform sampling methodology provide a solid foundation for recommendations that stem from this analysis. The World Bank’s Enterprise Survey aims to achieve the following objectives:
• provide statistically significant investment climate indicators that are comparable across countries;
• assess the constraints to private sector growth and job creation;
• build a panel of establishment-level data that will make it possible to track changes in the business environment over time, thus allowing impact assessments of reforms; and
• stimulate dialogue on reform opportunities.
3. This note provides information on the sampling methodology for Enterprise Surveys and Indicators Surveys, which are lighter versions of the former. Two complementary documents, the Questionnaire Manual and the Technical Note on Weight Computation for Enterprise and Indicator Surveys complete the documentation. The Questionnaire Manual
1. SAMPLING METHODOLOGY
provides a detailed explanation of the questions contained in the questionnaire and how the questionnaire should be implemented. The weights note provides a technical explanation on how weights and adjustments are computed.
4. The sampling methodology of the World Bank’s Enterprise Survey generates sample sizes appropriate to achieve two main objectives: first, to benchmark the investment climate of individual economies across the world and, second, to conduct firm performance analyses focusing mainly on how investment climate constraints affect productivity and job creation in selected sectors.
5. To achieve both objectives the sampling methodology:
• generates a sample representative of the whole non-agricultural private economy that substantiates assertions about this part of the economy, not only about the manufacturing sector. The overall sample should include, in addition to selected manufacturing industries, services industries and other relevant sectors of the economy; and
• generates large enough sample sizes for selected industries to conduct statistically robust analyses with levels of precision at a minimum 7.5% precision for 90% confidence intervals about:1
i. Estimates of population proportions (percentages), at the industry level; and
ii. Estimates of the mean of log of sales at the industry level.
1
1.1. Stratification
6. The population of industries to be included in the Enterprise Surveys and Indicator Surveys, the Universe of the study, includes the following list (according to ISIC, revision 3.1): all manufacturing sectors (group D), construction (group F), services (groups G and H), transport, storage, and communications (group I), and subsector 72 (from Group K). Also, to limit the surveys to the formal economy the sample frame for each country should include only establishments with five (5) or more employees. Fully government owned firms are excluded as the Universe is defined as the non-agricultural private sector.
7. Enterprise Surveys and Indicator Surveys are stratified following 3 criteria: sector of activity, firm size, and geographical location. Stratification by firm size divides the population of firms into 3 strata: small firms (5-19 employees), medium firms (20-99 employees), and large firms (100 or more employees). Geographical distribution is defined to reflect the distribution of the non-agricultural economic activity of the country; for most countries this implies including the main urban centers or regions of the country. Around the world, most of the non-agricultural activity is clustered around the main centers of population.
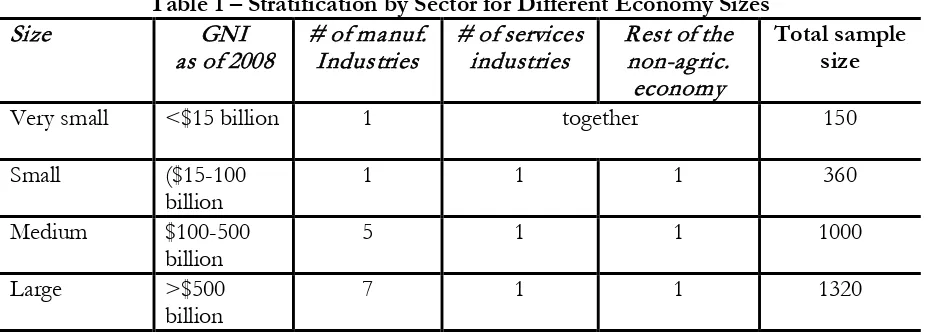
8. The stratification by sector of activity depends on the size of the economy as measured by the Gross National Income (GNI). As described in Table 1, very small economies (below $15 billion GNI of 2008) are surveyed using the Indicator Survey and are stratified into 2 groups: manufacturing and rest of the non-agricultural economy, with 75 interviews allocated to each group. For small economies, GNI between $15 billion and $100 billion, the universe of industries is stratified into manufacturing, retail, and the rest of the non-agricultural economy. Medium size economies single out the 4 most important manufacturing industries of the country, remaining manufacturing industries are grouped together into an additional strata, while retail and the rest of the non-agricultural economy compose the final 2 strata for the economy. Finally, for large economies 6 manufacturing sectors are selected as strata while remaining manufacturing industries are grouped into a residual sector; retail and the rest of the non-agricultural economy complete the overall sample.
Table 1 – Stratification by Sector for Different Economy Sizes
Size GNI
made for manufacturing, retail and the rest of the non-agricultural economy. For medium and large size economies, in addition, inferences can be made for selected manufacturing industries.
10. To keep comparability with previous surveys and across countries, two (2) manufacturing industries will be selected in all medium and large countries: manufacture of food products and beverages (ISIC 15), and manufacture of wearing apparel and fur (ISIC 18). Additional industries are chosen at the two-digit ISIC level depending on the characteristics of the economy as summarized in three variables: contribution to value added, employment, and number of firms. The final decision of industries will be made on a country by country basis trying to keep similar industries across countries to facilitate cross-country comparability.
2. SAMPLE SIZE
11. Overall sample sizes for both Enterprise Surveys and Indicator Surveys are determined by the degree of stratification of the sample. The overall sample size depends on the decision of the sample size for each level of stratification. In all ES and IS the objectives of stratification are to allow an acceptable level of precision for estimates, at, first, different first, within size levels (small, medium, and large), second, at the different levels of regional stratification, and third, for the different sectors of stratification (which, as explained before, are chosen depending on the size of the economy).
12. Given that both the Enterprise Survey and the Indicator Survey include more than 100 indicators the computation of the minimum sample size required is complicated since it depends on the variance of each indicator. However, many of the indicators computed from the survey are proportions, such as percentage of firms that engage in X activity or chose Y action. In this case the computation of the sample size is simplified by the fact that the variance of a proportion is bounded. Assuming the maximum variance (0.5) the minimum level of precision is guaranteed.
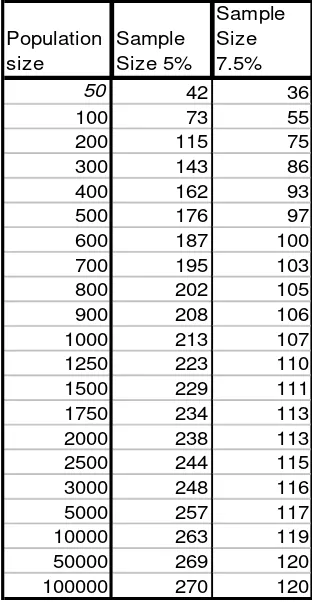
13. Table 2 exhibits minimum sample sizes for different population sizes for estimates of proportions with 5% and 7.5% precision in 90% confidence intervals, assuming maximum variance.2
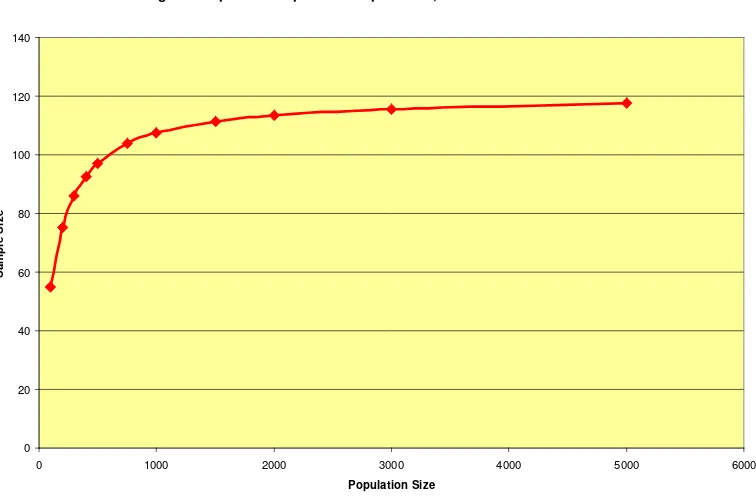
With 5% precision, the minimum sample size tends to a sample size of 270, as population size increases; with 7.5% precision the sample size tends to 120. Note that if the population size of an industry falls below 1,500, the required sample size for proportions may be reduced considerably (see figure 1 and 2). Although a 5% precision would be most desirable, a precision of 7.5% is in line with the budget constraints for the Enterprise Survey work around the world. Consequently, an operational 120 samples size per stratum was selected.
n where N=population size, P=population proportion, Q=1-P
Table 2 - Sample Sizes Required with 5% and 7.5% Precision and 90% Confidence
Population size
Sample Size 5%
Sample Size 7.5%
50 42 36
100 73 55
200 115 75
300 143 86
400 162 93
500 176 97
600 187 100
700 195 103
800 202 105
900 208 106
1000 213 107
1250 223 110
1500 229 111
1750 234 113
2000 238 113
2500 244 115
3000 248 116
5000 257 117
10000 263 119
50000 269 120
Figure 1: Optimal sample size 5% precision, 90% confidence interval
0 50 100 150 200 250 300
100 200 300 400 500 750 1000 1500 2000 3000 5000 10000 50000 100000
Population size
S
am
p
le si
z
e
Figure 2: Optimal Sample Size 7.5 precision, 90% confidence interval
0 20 40 60 80 100 120 140
0 1000 2000 3000 4000 5000 6000
Population Size
S
am
p
le S
iz
e
largely skewed distribution, the required sample size for inferences about its mean is typically too large.3 However, it is standard practice to work with sales in log form which takes away its large
variability.
The minimum sample size required for a 7.5% precision on estimates of log of sales was computed for each strata. This was compared to the minimum sample size for proportions under highest variance. For most strata, the minimum sample size for proportions was larger than the one required for the log of sales. Table 3 illustrates the sample sizes required for different industries in a medium size economy, Ukraine, using actual universe numbers of firms in manufacturing, services, and the rest of the economy.
Table 3 – Example of Sample Sizes required by Sector
N 7.5% precision, in most cases guarantees the minimum sample size required for inferences about the mean of log sales with a more demanding level of precision of 5%. In general, this result holds for large universe numbers as long as the coefficient of variation of the quantitative variables is less than 0.5. Checking on the existing survey information for around 50 countries, the coefficient of variation of log of sales for all industries is typically below 0.5 in all countries.
16. Note that by setting minimum sample sizes of 120 firms, the overall level of precision for the universe is likely much better than 7.5%. For example, with overall sample sizes 837, 593 and 438 for the countries included in the table, the overall precision levels on inferences about proportions for the whole economy, provided that observations are properly weighted, are 2.84, 3.37%, and 3.71%, respectively.
2.1. Additional Levels of Stratification and Sample Selection
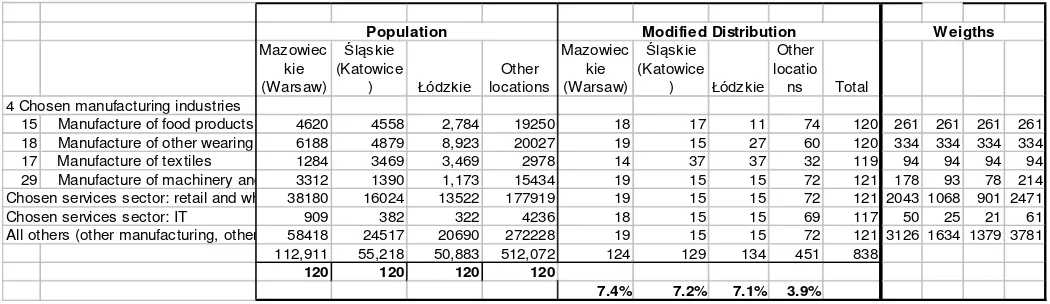
17. Having several criteria of stratification adds some complexity to the sample design and the optimal sample size. Adding a second dimension of stratification requires that sample sizes should be distributed along the second dimension in order to achieve the desired minimum level of precision. This must be done without compromising the minimum sample sizes required for the first dimension of stratification. A good starting point for such distribution is a proportional allocation of the optimal sample size for a first-level stratum across all second-level strata. Adjustments to the proportional allocation are then needed to reach the required level of precision for each stratum. An example of how to distribute the sample for a large economy is included in Table 5. This example also includes the computation of base weights which are indispensable to make assertions about the whole population.
2.2. Non-Response, Panel Data and Attrition
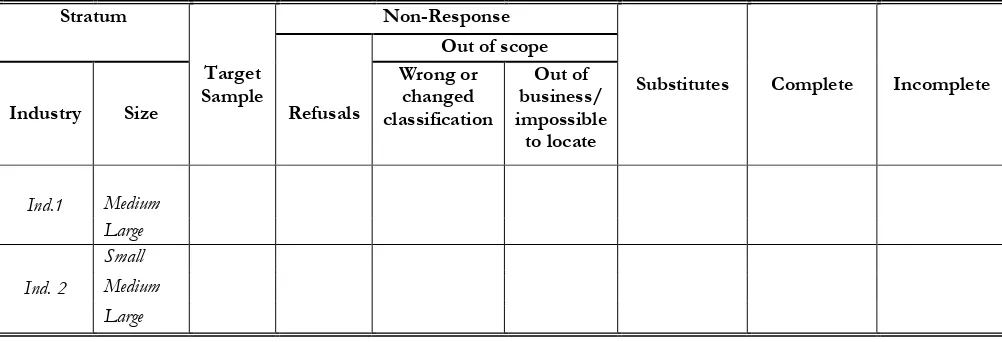
18. A potential problem of most Enterprise Surveys is that in the majority of the cases the resulting data sets represent only firms that were willing to participate in the survey. Firms’ systematic refusal to participate may compromise the random nature of the sample. In most cases, this problem has been tackled by substituting with willing participants. Regardless of the solution undertaken, it is important to determine the non-response rate from the overall population and to distinguish it from substitutions emerging from problems of the sample frame such as firms with unknown location and/or firms that have gone out of business. For this reason, it is crucial to prepare a field-work report containing the information included in Table 4:
Table 4 – Fieldwork Report on Non-Response
19. This report is essential not only to clearly state response rates per strata but also to identify problems with the sample frame in order to adjust the design weights. A separate technical note on weights computation explains in detail how this information is used (Technical Note on Weight Computation for Enterprise and Indicator Surveys).
20. Item non-response, questions with missing responses, is a particularly acute problem in Enterprise Surveys, especially when dealing with some of the accounting data used to assess establishment performance (sales, employment, cost of labor, cost of intermediate inputs and raw materials, net book value of fixed assets, and purchase value of fixed assets). To account for item non-response, the sampling strategy factors in up to a 25% non-response per stratum, so that there
Stratum
Target Sample
Non-Response
Substitutes Complete Incomplete
Out of scope
Industry Size Refusals
are enough valid responses to compute performance indicator with the precision indicated in this sampling methodology. This brings the total number of required interviews per stratum to 160. However, due to budget constraints and the fact that only medium and large economies have enough observations at the industry level to complete 160 interviews per industry this sample size adjustment is only implemented for these economies.
21. An additional objective of the global roll-out is to build a panel of firms by re-interviewing them at regular, periodic intervals of time. Every region is surveyed every 3 to 4 years to achieve this objective. For this reason, it is imperative that every implementing firm submits all the contact information of the participating firms to facilitate their location in future iterations of the survey. This information must be kept by the World Bank or an independent third party and not the implementing firm. If legal restrictions or internal bylaws require measures to guarantee the confidentiality of firms’ identities, names and addresses can be kept separately from the main data set.
22. For surveys beyond the first iteration attrition becomes a major concern. This problem compounds the non-response bias present in most firm-level surveys. It is important to allocate resources to minimize attrition. It is also important to identify attrition and differentiate it from non response emerging from firms going out of business. Observationally, both manifest themselves as a non response to the survey; in reality, one reflects a structural characteristic of the economy, firms dropping out of the market, and the other reflects a potentially endogenously defined reaction by firms’ managers: it could be that less productive firms systematically reject the survey, that firms more affected by negative features of the investment climate refuse to participate, or that refusals are the result of the previous experience with the survey. Econometric techniques allow to test and correct for this potential endogenous attrition.
Table 5 - Sample sizes to reach 7.5% precision by sector and location
15 Manufacture of food products and beverages 31,212 4620 4558 2,784 19250 18 17 11 74 120 18 17 11 74 120
18 Manufacture of other wearing apparel and acces 40,017 6188 4879 8,923 20027 19 15 27 60 120 19 15 27 60 120
17 Manufacture of textiles 11,200 1284 3469 3,469 2978 14 37 37 32 119 14 37 37 32 119
29 Manufacture of machinery and equipment 21,309 3312 1390 1,173 15434 19 8 7 87 120 19 15 15 72 121
Chosen services sector: retail and wholesale 245,644 38180 16024 13522 177919 19 8 7 87 120 19 15 15 72 121
Chosen services sector: IT 5,849 909 382 322 4236 18 8 6 85 118 18 15 15 69 117
All others (other manufacturing, other services, construc 375,852 58418 24517 20690 272228 19 8 7 87 120 19 15 15 72 121
TOTAL 731,083 112,911 55,218 50,883 512,072 124 100 101 512 837 124 129 134 451 838
Required sample for precision 7.5 120 120 120 120
Actual precision (second level of stratification) 7.4% 8.2% 8.2% 3.6% 7.4% 7.2% 7.1% 3.9%
Population Proportional Distribution Modified Distribution
Mazowiec
15 Manufacture of food products 4620 4558 2,784 19250 18 17 11 74 120 261 261 261 261
18 Manufacture of other wearing 6188 4879 8,923 20027 19 15 27 60 120 334 334 334 334
17 Manufacture of textiles 1284 3469 3,469 2978 14 37 37 32 119 94 94 94 94
29 Manufacture of machinery and 3312 1390 1,173 15434 19 15 15 72 121 178 93 78 214
Chosen services sector: retail and wh 38180 16024 13522 177919 19 15 15 72 121 2043 1068 901 2471
Chosen services sector: IT 909 382 322 4236 18 15 15 69 117 50 25 21 61
All others (other manufacturing, other 58418 24517 20690 272228 19 15 15 72 121 3126 1634 1379 3781
112,911 55,218 50,883 512,072 124 129 134 451 838
120 120 120 120
7.4% 7.2% 7.1% 3.9%
Modified Distribution