This art icle was dow nloaded by: [ Universit as Dian Nuswant oro] , [ Ririh Dian Prat iw i SE Msi] On: 29 Sept em ber 2013, At : 20: 11
Publisher: Rout ledge
I nform a Lt d Regist ered in England and Wales Regist ered Num ber: 1072954 Regist ered office: Mort im er House, 37- 41 Mort im er St reet , London W1T 3JH, UK
Accounting and Business Research
Publicat ion det ails, including inst ruct ions f or aut hors and subscript ion inf ormat ion: ht t p: / / www. t andf online. com/ loi/ rabr20
Value
‐
relevance of presenting changes in fair value
of investment properties in the income statement:
Evidence from Hong Kong
St ella So a & Malcolm Smit h b a
Depart ment of Account ancy and Law, Hong Kong Bapt ist Universit y b
Malcolm Smit h, School of Account ing, Finance & Economics, Edit h Cowan Universit y, West ern Aust ralia, 270 Joondalup Drive, Joondalup, WA, 6027 Phone: (08) 6304 5263 E-mail: Published online: 04 Jan 2011.
To cite this article: St ella So & Malcolm Smit h (2009) Value‐relevance of present ing changes in f air value of invest ment propert ies in t he income st at ement : Evidence f rom Hong Kong, Account ing and Business Research, 39: 2, 103-118, DOI: 10. 1080/ 00014788. 2009. 9663352
To link to this article: ht t p: / / dx. doi. org/ 10. 1080/ 00014788. 2009. 9663352
PLEASE SCROLL DOWN FOR ARTI CLE
Taylor & Francis m akes every effort t o ensure t he accuracy of all t he inform at ion ( t he “ Cont ent ” ) cont ained in t he publicat ions on our plat form . How ever, Taylor & Francis, our agent s, and our licensors m ake no
represent at ions or warrant ies w hat soever as t o t he accuracy, com plet eness, or suit abilit y for any purpose of t he Cont ent . Any opinions and view s expressed in t his publicat ion are t he opinions and view s of t he aut hors, and are not t he view s of or endorsed by Taylor & Francis. The accuracy of t he Cont ent should not be relied upon and should be independent ly verified w it h prim ary sources of inform at ion. Taylor and Francis shall not be liable for any losses, act ions, claim s, proceedings, dem ands, cost s, expenses, dam ages, and ot her liabilit ies w hat soever or how soever caused arising direct ly or indirect ly in connect ion w it h, in relat ion t o or arising out of t he use of t he Cont ent .
This art icle m ay be used for research, t eaching, and privat e st udy purposes. Any subst ant ial or syst em at ic reproduct ion, redist ribut ion, reselling, loan, sub- licensing, syst em at ic supply, or dist ribut ion in any
1. Introduction
This study examines the value-relevance of the ac-counting information reported as a consequence of Hong Kong Accounting Standard No. 40 ‘Investment Property’ (HKICPA, 2004), hereafter HKAS 40 (2004), on the presentation of changes in fair value of investment properties. The date 1 January 2005 marked the beginning of a new era when accounting standards in Hong Kong became fully converged with International Financial Reporting Standards (IFRS). As part of the final phase of the convergence, a number of new ac-counting standards which are word-for-word equivalents of the IFRSs were issued to replace the existing pronouncements. HKAS 40 (2004) is one of them. Following International Accounting Standards No. 40 ‘Investment Properties’ (2000) (IASC, 2000), hereafter IAS 40 (2000),1HKAS 40
(2004) requires that companies choosing to adopt the fair value model must present changes in the fair value of investment properties in the income statement. Previously under Statement of Standard
Accounting Practice No. 13 ‘Accounting for Investment Properties’ (HKSA, 2000), hereafter SSAP 13 (2000), such changes (labelled, however, as open market value2 changes) were presented
Value-relevance of presenting changes in fair
value of investment properties in the income
statement: evidence from Hong Kong
Stella So and Malcolm Smith*
Abstract—This study investigates the value-relevance of the revision introduced in HKAS 40 (2004) ‘Investment Property’ on the presentation of changes in the fair value of investment properties. The revision follows that introduced in IAS 40 (2000) as Hong Kong adopted the International Financial Reporting Standards in 2005. As introduced in IAS 40 (2000), HKAS 40 (2004) requires that companies choosing to adopt the fair value model have to present changes in the fair value of investment properties in the income statement. Previously under the Hong Kong account-ing standard SSAP 13 (2000), such changes were presented primarily in the revaluation reserve. Usaccount-ing both a three-day short window centred around the earnings announcement date and a 12-month long window, this study provides evidence that investors value the HKAS 40 (2004) revision in the presentation of the changes in fair value of invest-ment properties. Based on a sample of listed property companies in Hong Kong during 2004–2006, the results of this study show a significantly higher market price reaction and returns association when changes in fair value of invest-ment properties are presented in the income stateinvest-ment. The results of this study are of interest not only to academic researchers, but to practitioners and standard setters as they assess the decision usefulness of the revised presentation.
Keywords: financial reporting; Hong Kong; investment; property; fair value
*Stella So is in the Department of Accountancy and Law at Hong Kong Baptist University and Malcolm Smith is at the School of Accounting, Finance & Economics at Edith Cowan University, Western Australia.
Correspondence should be addressed to: Professor Malcolm Smith, School of Accounting, Finance & Economics, Edith Cowan University, 270 Joondalup Drive, Joondalup WA 6027, Western Australia. Tel: (08) 6304 5263. E-mail: [email protected].
This paper was accepted for publication in November 2008.
1The fair value model discussed in this paper is introduced
in IAS 40 (2000). Although it had been revised in 2003 and su-perseded by IAS 40 (2003) (IASCF, 2008a), the revision in 2003 is related to clarification of aspects of property interest that are held under an operating lease and is therefore of no relevance to this study. Of relevance to this study are the fair value model and the required presentation of fair value changes of investment properties in the income statement under the fair value model, which were introduced in IAS 40 (2000). Throughout this paper, reference is therefore made to IAS 40 (2000) and not to IAS 40 (2003).
2SSAP 13 (2000) adopted the definition of open market
value from the Hong Kong Institute of Surveyors which de-fined it as the best price at which an interest in a property might reasonably be expected to be sold at the date of valua-tion assuming a willing seller, a reasonable period in which to negotiate the sale taking into account the nature of the proper-ty and the state of market, that values will remain static during that period, that the property will be freely exposed to the open market, and that no account will be taken of any additional bid by a purchaser with a special interest (HKSA, 2000). The IASB defines fair value as the amount for which an asset could be exchanged between knowledgeable, willing parties in an arm’s length transaction (IASCF, 2008a). The former IASC, in its Basis for Conclusions on IAS 40 (2000), states that its con-cept of fair value for investment properties is similar to the International Valuation Standards Committee (IVSC) concept of market value. IVSC defines market value as the estimated amount for which an asset should exchange on the date of val-uation between a willing buyer and a willing seller in an arm’s length transaction after proper marketing wherein the parties had each acted knowledgeably, prudently and without compul-sion (IASCF, 2008c).
primarily3 in a different location, the revaluation
reserve.
Changes in the fair value of investment proper-ties, whether increases or decreases, represent gains or losses which are unrealised. There have been concerns that the inclusion and presentation of such unrealised gains and losses in the income statements might lead to undue increases in earn-ings volatility and investor confusion (HKSI, 2006). The former International Accounting Standards Committee (IASC) argues, however, in its Basis for Conclusions on IAS 40 (2000) that such presentation provides the most relevant and transparent view of the financial performance of investment properties (IASCF, 2008c). After all, the objective of financial statements is not to smooth profit figures (McBride, 2006), but to re-flect economic reality for economic decision mak-ing (IASCF, 2008b).
The replacement of SSAP 13 (2000) by HKAS 40 (2004) in Hong Kong thus provides a unique opportunity for this study to examine the issues re-lating to the impact of the presentation location, whether in the income statement or revaluation re-serve, for changes in fair value of investment prop-erties. The results of this study will have implications for companies around the world that prepare their financial statements using International Financial Reporting Standards.
Like all other value-relevance studies, this study use share prices and share returns to infer whether investors consider accounting information to be suf-ficiently relevant and reliable to be useful in making investment decisions (Maines and Wahlen, 2006; Landsman, 2007). Value-relevance tests are gener-ally joint tests of relevance and reliability4(Barth et
al., 2001), where reliability is more than agreement about a measure (measurement verifiability), but also involves the correspondence between descrip-tion, classification and presentation (representation-al faithfulness), of the phenomenon it purports to represent (IASCF, 2008b; Maines and Wahlen, 2006). This study examines the relevance and relia-bility of the HKAS 40 (2004) revision on the pres-entation of changes in fair value of investment properties, by evaluating the revision’s ability to im-pact upon the abnormal share returns to investors.
There are three distinct issues which motivate this study.
First, while the efficient market hypothesis sug-gests that the presentation location of accounting information is not valued by investors, results from prior research have shown otherwise (e.g. Hirst and Hopkins, 1998; Maines and McDaniel, 2000; Barth et al., 2003; Hirst et al., 2004; Chambers et al., 2006; and Lee et al., 2006). The presentation location of an accounting amount af-fects not only its relevance but also its reliability (IASCF, 2008b; Maines and Wahlen, 2006). Given
these prior findings and associated theory, it is sur-prising that Owusu-Ansah and Yeoh (2006) find no difference whether unrealised gains (losses were not studied) on investment properties in New Zealand are reported in the income statement or revaluation reserve. Further research is therefore needed to provide more evidence about the impact of presentation location generally, and of changes in fair value of investment properties in particular. Second, existing research (see Landsman (2007) for a detailed summary) focuses on financial assets and liabilities (Barth, 1994; Barth et al., 1995, 1996, 2006); Eccher et al., 1996; Nelson, 1996, Carroll et al., 2003; Hirst et al., 2004; Hodder et al., 2006; Danbolt and Rees, 2008) and employee share options (Espahbodi et al., 2002; Robinson and Burton, 2004). While there are studies on non-financial assets, for intangible assets and tangible long-lived assets (e.g. Barth and Clinch, 1998; Aboody et al., 1999; Muller and Riedl, 2002) and on investment properties (i.e. Dietrich et al., 2001; Owusu-Ansah and Yeoh, 2006), the empirical evi-dence is largely based on fair value disclosures in the notes to the accounts from the 1990s. More studies should be conducted using data after the implementation of the fair value accounting standards (e.g. IAS 39 ‘Financial Instruments: Recognition and Measurement’, and HKAS 40 ‘Investment Property’ studied in this study).
3Under SSAP 13 (2000), investment properties were to be
included in the balance sheet at their open market value and changes in the open market value were to be recognised pri-marily in the revaluation reserve, i.e. in the revaluation reserve unless (1) its balance was insufficient to cover a deficit, in which case the amount by which the deficit exceeded the revaluation reserve balance was to be charged to the income statement; and (2) a revaluation surplus subsequently arises, this surplus was to be credited to the income statement to the extent of the deficit previously charged (HKSA, 2000).
4This paper assumes the application of the Framework for
the Preparation and Presentation of Financial Statements pub-lished by the former International Accounting Standards Committee (IASC) in 1989 and re-adopted by the International Accounting Standards Board (IASB) in 2001 (hereafter Framework (1989), IASCF, 2008b). In Framework (1989), rel-evance and reliability are two of the four principal qualitative characteristics of decision-useful financial statements (IASCF, 2008b). Information is relevant if it influences the economic decisions of users by helping them evaluate past, present or fu-ture events or confirming, or correcting, their past evaluations. Information is reliable when it is free from material error and bias and can be depended upon by users to represent faithful-ly that which it purports to represent or could reasonabfaithful-ly be expected to represent. Of note is that the term reliability in Framework (1989) has been proposed to be replaced by ‘faith-ful representation’ in the Exposure Draft of an Improved Conceptual Framework for Financial Reporting, jointly pub-lished in May 2008 by the IASB and the US Financial Accounting Standards Board (FASB). The boards considered that faithful representation encompasses all the key qualities that Framework (1989) includes as aspects of reliability and therefore proposed the replacement. No attempt is however made in this paper to anticipate the outcome of the exposure draft, which is expected to be finalised in the first half of 2009.
Third, Hong Kong is a world-recognised centre for property construction, development and invest-ment (KPMG China and Hong Kong, 2004) and the total market capitalisation of its property in-dustry (conglomerates/consolidated enterprises excluded) in 2006 was HK$13,249bn, represent-ing 11% of the total market capitalisation of all Hong Kong Stock Exchange Main Board equities (HKSE, 2005, 2006). Investment property is a sig-nificant component of many company balance sheets in Hong Kong and the way it is accounted for has become an issue of prominent interest in Hong Kong in 2005–2006 (McBride, 2006).
This study employs a sample of listed companies from the Hong Kong property industry and exam-ines whether the relevance and reliability of disclosures are enhanced through the adoption of HKAS 40 (2004) and the reporting of changes in fair value of investment properties in the income statement. Only companies from the property indus-try are included because these companies are ex-pected to hold substantial levels of investment properties on their balance sheets and their earnings are thus likely to be more sensitive to the adoption of HKAS 40 (2004). Depending on the sample company’s accounting year-end, and the incidence of early adoption of HKAS 40 (2004), the sample period in this study extends from 2004 to 2006.
Using models adapted from Easton and Harris (1991), Amir et al. (1993) and Barth (1994), re-sults from this study provide evidence on the high-er value-relevance of presenting fair value gains or loss in the income statement versus presenting them in the revaluation reserve. The higher value-relevance is found to be evident in both the short-window market reaction to the release of annual earnings announcements and the long-window market-adjusted annual returns. Taken together, our results give support to the HKAS 40 (2004) presentation which investors appear to value more than previously under SSAP 13 (2000).
The paper proceeds as follows. Section 2 de-scribes related prior research and Section 3 details the research method employed. Section 4 discuss-es the empirical rdiscuss-esults, and the paper concluddiscuss-es in Section 5 with a summary and discussion of re-search opportunities.
2. Related prior studies
IAS 40 (2000) represents the first time that the IASB permits a fair value model for non-financial assets (IASCF, 2008c). Under the fair value model, investment properties are carried at fair values and changes in fair value, whether up or down, are in-cluded in the profit or loss for the period and pre-sented in the income statements. Supporters of the fair value model believe that fair values give users of financial statements more useful information than other measures, such as depreciated cost, and
changes in fair value are inextricably linked as in-tegral components of the financial performance of an investment property and are therefore presented in the income statements (IASCF, 2008c). Although IAS 40 (2000) permits entities to choose between a fair value model or a cost model, the Basis for Conclusions on IAS 40 (2000) states clearly that it is highly unlikely that a subsequent change from the fair value model to the cost model can be made on the grounds of more appropriate presentation (IASCF, 2008c).
However, Penman (2007) does not entirely agree; he evaluates historical cost and fair value accounting from two perspectives – equity valua-tion and stewardship and concludes that while fair value accounting is a plus at a conceptual level, the minuses add up with fair value implemented as exit price (whether estimated or observed in active markets) and the problems with historical cost ac-counting remains unresolved.
Singleton-Green (2007) summarises the prob-lems of fair value accounting as: (1) the lack of ac-tive markets for most assets and liabilities, which means that most fair value measurements are esti-mates and are highly subjective and potentially unreliable; (2) costly information, especially for smaller companies; and (3) the recognition of prof-its based on fair values, which mean that unre-alised profits or losses from changes in fair value are recognised, and result in greater volatility and unpredictability. This study focuses on the third issue, the presentation of changes in fair value of investment properties, in the income statement versus the revaluation reserve.
Empirical studies assessing the relevance and re-liability of fair value accounting versus historical cost-based accounting focus on financial instru-ments, and the results from these studies are gen-erally mixed. Barth (1994) finds that, for a sample of US banks with data from 1971–1990, disclosed fair value estimates of investment securities pro-vide significant incremental5 explanatory power
for bank share prices beyond that provided by his-toric costs. Fair value gains and losses of invest-ment securities (constructed from two annually disclosed fair value estimates) are, however, found to have no significant incremental explanatory power for annual returns (changes in share price), due to the increased measurement errors (Barth, 1994). Similar results are obtained in Barth et al. (1995), Barth et al. (1996), Eccher et al. (1996) and Nelson (1996), all using bank data. Results from Carroll et al. (2003) differ; instead of using bank data, they sample closed-end mutual funds which typically have investment securities
(report-5According to Biddle et al. (1995), an incremental
compar-ison determines whether one accounting measure provides in-formation content beyond that provided by another.
ed at fair values) comprising virtually all their as-sets and with negligible liabilities and other asas-sets. This is an advantage because the potential problem introduced by measuring some assets and liabili-ties at fair value but others at historical cost, is eliminated. Significant association between share prices and the fair value of investment securities, as well as between share returns and fair value se-curities gains and losses are found. To examine whether differences in the reliability of the fair value of investment securities affect investors’ as-sessments of the usefulness of the information, Carroll et al. (2003) examine the association be-tween share prices and fair values across different fund types and find that in all cases, including those traded in thin markets, there is a significant associ-ation between the share prices and fair values.
In contrast, Danbolt and Rees (2008), using UK data, report no support for full fair value account-ing. While fair value income is considerably more value-relevant than historic cost income, the higher relevance disappears in the presence of changes in fair value accounting balance sheet values. Danbolt and Rees (2008) interpret their results as evidence of the absence of an obvious advantage from adopt-ing fair value income accountadopt-ing if fair value bal-ance sheet values are available to the user.
Value-relevance research studies the association between fair value estimates and share prices or re-turns. Sloan (1999) comments that while this asso-ciation provides evidence that investors find fair value estimates to be relevant, the inferences re-garding reliability are indirect and limited by the fact that share prices reflect many factors other than the fair value estimates. Dietrich et al. (2001) subsequently use a direct approach to investigate the reliability of mandatory annual fair value ap-praisal estimates by chartered surveyors for UK in-vestment properties and find that appraisal estimates understate actual selling prices but are considerably less biased and more accurate
meas-ures of selling price than respective historical costs. Dietrich et al. (2001) also find that the relia-bility of appraisal estimates increases when moni-tored by external appraisers and Big Six auditors.
The New Zealand (hereafter NZ) SSAP No. 17 ‘Accounting for Investment Properties and Properties Intended for Sale’ (NZSA, 1989) previ-ously allowed NZ companies the choice of recog-nising unrealised gains or losses either in the income statement, or as movements in an invest-ment property revaluation reserve, unless the total of the reserve was insufficient to cover a deficit, in which case the amount of deficit was to be charged in the income statement as part of operating results. The NZ equivalent of IAS 40 came into effect on 1 January 2005, resulting in the elimination of the choice of recognising unrealised gains in the reval-uation reserve. Owusu-Ansah and Yeoh (2006) in-vestigate the relative value-relevance of the two alternative accounting treatments for unrealised gains on investment properties, based on a sample of NZ companies over the period 1990 to 1999, when the choice was still available. Their results show that recognition of unrealised gains in the in-come statement is not superior to recognition of un-realised gains in the revaluation reserve in terms of their value-relevance. However, Owusu-Ansah and Yeoh (2006) include only companies with positive changes in the value of their investment properties. Taken together, findings from prior studies of firms in the US, UK and Australian capital markets during the 1990s suggest that investors have been provided with fair value information (whether recognised or disclosed) that is generally reliable and relevant (whether fair value estimated by man-agement or independent valuer). More research should be undertaken to test empirically whether relevance and reliability improve after the imple-mentation of the fair value standards on financial instruments (e.g. IAS 39) and with the extension of fair value accounting to non-financial assets (i.e. IAS 40).
Like Owusu-Ansah and Yeoh (2006), this study examines the extension of fair value accounting to investment properties and the presentation of their fair value changes in the income statements (rather than in the revaluation reserve) in particular. Unlike Owusu-Ansah and Yeoh (2006), this study employs data from accounting periods when the related fair value accounting standard HKAS 40 is implemented. Comparison is then made with those from the immediate pre-implementation account-ing periods when SSAP 13 (2000) was in effect. Also, unlike Owusu-Ansah and Yeoh (2006), this study includes companies with both increases and decreases in fair values and uses a return model adapted from Easton and Harris (1991), Amir et al. (1993) and the earnings capitalisation approach6
from Barth (1994). 6Two approaches are developed and used in Barth (1994),
the market value approach and the earnings capitalisation ap-proach. The former examines balance sheet items, the latter examines income statement items. Owusu-Ansah and Yeoh (2006) use a modified version of the market value approach, which is however not considered in this study. The market value approach is based on a valuation model where the mar-ket value of equity equals a firm’s assets minus its liabilities on its balance sheet (Barth, 1994). The market value approach is useful if the asset being studied is reported differently in differ-ent balance sheets, for example, at historical cost or fair value because of the choice permitted for investment securities in Barth (1994). In this study, investment properties are reported in the balance sheet either under SSAP 13 (2000) at open mar-ket values or under HKAS 40 (2004) at fair values. Similar amounts will be reported in the balance sheets under SSAP 13 (2000) and HKAS 40 (2004). On the other hand, the earnings figures in the income statements are different, depending on which accounting standard is followed, which explains why this study has chosen to use the earnings capitalisation model.
3. Research method
Data for this study are collected from two sources. The financial statement data and results announcement dates are derived from the pub-lished financial statements downloaded from http://www.hkex.com.hk. The Morgan Stanley Capital International (hereafter MSCI) Equity Hong Kong Index is used in this study as the proxy for equity market return in Hong Kong. The equi-ty market data including the MSCI Equiequi-ty Hong Kong Index are obtained from Reuters 3000Xtra.
Companies are eligible for selection if through-out the sample period 2003–2006: (1) they are in the property industry; (2) they are listed in the Main Board of the Hong Kong Stock Exchange; (3) they report investment properties in their finan-cial statements; and (4) there is no change of ac-counting year-end. These sampling criteria yield an initial sample of 92 companies.
Each company in the sample is studied twice, first in its final accounting period using SSAP 13 (2000), and then in its first accounting period using HKAS 40 (2004).
Two approaches are used in this study, the short-window event study approach and the longer win-dow return-earnings associations approach.
In both approaches, three7 control variables are
added to control for their potentially confounding effects, including firm size and leverage which are commonly controlled for in value-relevance stud-ies (e.g. Fan and Wong, 2002). Market-wide prop-erty price level in Hong Kong as proxied by the Centa-City Index8is also included as the analysis
in this study involves comparison of data collected across different time periods.
3.1. Short-window event study
The short-window event study approach is based on the information or signalling perspective (Beaver, 1981) on the decision usefulness of finan-cial reporting, a perspective that has dominated
fi-nancial accounting theory and research since Ball and Brown (1968). The information perspective posits that investors, in response to the release of a company’s financial statements, will analyse the statements for new and unexpected information and revise their beliefs about the company’s future performance, causing movements in the compa-ny’s share prices and resulting in abnormal returns to investors (Ball and Brown, 1968). Thus finan-cial statement information is considered decision-useful if it is new and unexpected, and results in abnormal returns to the investors. Easton and Harris (1991) confine financial information to re-ported income or earnings from the income state-ment and develop a model relating earnings level and earnings change to abnormal return, as fol-lows:
Rjt– E[Rjt] = a1+ a2{Ajt/ Pjt-1} + a3{(Ajt– Ajt-1) / Pjt-1} + ejt
where:
Rjtis the return on security j at time t,
E[Rjt] is the expected return on security j at time t,
Ajtis the accounting earnings per share of firm j over the time period t-1 to t,
Ajt-1is the accounting earnings per share of firm j over the prior time period t-2 to t-1, and
Pjt-1is the beginning-of-period security price per share at t-1
To evaluate the value-relevance of the HKAS 40 (2004)’s revised presentation of gains and losses in fair value of investment properties in the income statement, earnings are partitioned into two com-ponents: (1) earnings before gains and losses in fair value of investment properties; and (2) gains and losses in fair value of investment properties, as in Barth (1994). Both components are then scaled by total market value. In this study, the gains and loss-es in fair value of invloss-estment propertiloss-es, as scaled by total market value, are assumed to have an ex-pectation of zero as changes in fair value general-ly arise from random walk processes,9 should be
transitory in nature (Barth, 1994; Chambers et al., 2006) and represent unexpected information.
An abnormal return in this study is measured by the difference between the company’s return dur-ing the period and the return on the market portfo-lio, i.e. Rjt– Rmt, where Rmtis the return based on the market portfolio at time t, also known as the market-adjusted rate of return (Amir et al., 1993). Market-wide return is removed and the abnormal return obtained thus represents company-specific returns. Brown and Warner (1980) find the market-adjusted rate of return to perform reasonably well under a wide variety of conditions when compared 7As HKAS 40 (2004) encourages, but does not mandate,
external independent valuation for investment properties, and SSAP 13 (2000) only requires such a valuation at least every three years, whether or not there is an independent valuation should therefore be controlled for in this study. However sub-sequent data analysis shows that all the companies sampled in this study engage an external independent valuation appraiser for their investment properties during all the sample year-ends regardless of whether SSAP 13 (2000) or HKAS 40 (2004) is adopted. There is therefore no such need to include a control variable for independent valuation in this study.
8The Centa-City Index is a monthly index based on all
transaction records as registered with the Land Registry in Hong Kong, to reflect market-wide property price levels dur-ing the month in Hong Kong.
9Changes in fair value of investment properties may behave
as a random walk with drift, resulting in a non-zero expected value. The drift may be reflecting the change in the market-wide property price levels, which is therefore controlled for in this study.
with the more conventional market model used in Ball and Brown (1968) and other studies (e.g. Ball and Kothari, 1991).
In order to evaluate the value-relevance of a company’s reporting of gains and losses in fair value of investment properties in the income state-ment, this study assesses how investors respond to such information when it first becomes publicly available, by observing the company’s share price movements during a short window of three days surrounding the company’s results announcement. In Hong Kong, the Hong Kong Stock Exchange Listing Rules require its Main Board listed compa-nies to publish preliminary results the next busi-ness day after approval by the board of directors and in any event not later than four months after the date upon which the financial period ended. The preliminary results include announcements of balance sheets and income statements together with most of the notes to the accounts which have been audited and agreed by the companies’ audi-tors and will be published in the annual reports. The preliminary results announcement day is therefore identified as the day when the informa-tion on the reporting of gains and losses in fair value of investment properties first becomes pub-licly available.
Because during a three-day short window there are relatively few company-specific events other than the results announcement, a three-day short-window association between the abnormal returns and accounting information released in the results announcement suggests that the accounting infor-mation is responsible for the abnormal return and provides new decision-useful information to in-vestors. Other information in the preliminary re-sults announcement might also be responsible for the abnormal return, for example, a change in com-pany strategy. However, by including only compa-nies from the property industry, where investment properties comprise a large proportion of company assets and fair value gains and losses, a large
earn-ings source, the effects from other information are therefore narrowed in this short-window analysis.
The regression equation (1) below is used to evaluate the differential value-relevance of the HKAS 40 (2004)’s required reporting of gains and losses in fair value of investment properties in the income statement, using a three-day short window approach as adapted from Easton and Harris (1991), Amir et al. (1993) and Barth (1994) (omit-ting company j and year t subscripts). A differen-tial intercept dummy variable AFTER is used to indicate whether HKAS 40 (2004) or SSAP 13 (2000) is adopted during the accounting year.
ARS= + α
ARS is the three-day buy-and-hold10 abnormal
return (adjusted for dividends and share splits), centred around the preliminary results an-nouncement day, calculated using the market-adjusted return.
AFTER is a dummy variable to indicate whether HKAS 40 (2004) or SSAP 13 (2000) is in effect during the accounting year. AFTER is set equal to one if HKAS 40 (2004) is adopted for the first time during the accounting year, and zero other-wise.
EARNB is the earnings before gains and losses. In the case of HKAS 40 (2004) this is measured as earnings before gains and losses in fair value of investment properties. In the case of SSAP 13 (2000) this is measured as the earnings before deficits in open market value of investment properties in excess of the revaluation reserve, or surpluses in open market value of investment properties in excess of any deficits previously charged to the income statement (see footnote 3). EARNB is scaled by the total market value at the first day of the fifth month after the beginning of the accounting year.
∆EARNB is the difference between EARNB in the current year and EARNB in the prior year, scaled by the total market value at the first day of the fifth month after the beginning of the accounting year.
IPVC is the gains and losses in fair value of investment properties recognised in the income statement as required by HKAS 40 (2004), or the investment properties’ open market value increases and decreases disclosed in the notes 10While there is disagreement in the literature regarding the
method for calculating long-run abnormal returns because of the inherent right-skewed non-normal distribution problem (Lyon et al., 1999), the choice of method is not so important for the measurement of short-run abnormal returns (Fama, 1998, Jakobsen and Voetmann, 2003). Because a horizon of three to five years is referred to in the literature as long-run, both the three-day short-window and 12-month long-window abnormal returns in this study provide short-run returns. Commonly used abnormal returns in event studies are buy-and-hold abnormal returns (BHAR) (monthly abnormal returns compounded) and cumulative abnormal returns (CAR) (monthly abnormal re-turns summed and averaged). Lyon et al. (1999) suggests BHAR is suitable in answering the question of whether sample firms earned abnormal returns over a particular period of time, while CAR is preferred where sample firms persistently earn abnormal monthly returns. Fewer data are collected for BHAR because the monthly returns compounded are simply the annu-al return; BHAR is therefore used in this study.
to the accounts, scaled by the total market value at the first day of the fifth month after the beginning of the accounting year.
FIRM SIZE is the natural logarithm of the book value of the total assets at the beginning of the accounting year.
LEVERAGE is the ratio of the book value of debt to the total assets at the beginning of the ac-counting year.
CCINDEX is the difference between the Centa-City Index at the end and the beginning of the accounting year, divided by the beginning index amount.
The focus of this study is on the significance of the differential slope coefficient α8of the interac-tion variable IPVC*AFTER which reflects the sig-nificance of the differential causal effect of the change in the accounting standard requirement. A positive and significant β8 gives support for the higher informativeness of the changes introduced by HKAS 40 (2004) in the presentation of changes in fair value of investment properties.
The coefficients α6and α7of EARNB*AFTER and ∆EARNB*AFTER reflect the differential causal effect of the HKAS 40 revision on earnings and earnings change amounts before the open mar-ket value/fair value change of investment proper-ties (i.e. EARNB and ∆EARNB). Because the HKAS 40 revision is not concerned with such earnings and earnings change, coefficients α6and α7should be of no significance. However, as a re-sult of the full convergence of HKFRS with IFRS in Hong Kong in 2005, there are other financial reporting requirement changes taking place con-currently with HKAS 40 (2004). These other re-porting changes may interact with EARNB and ∆EARNB to cause an effect on the abnormal turns. The sign and significance of a6 and a7 re-flect the differential causal value relevance of these other reporting changes. They are, however, outside the scope of this study and no prediction is made about them.
The coefficients α3and α4represent the effects of EARNB and ∆EARNB in three-day short win-dows when SSAP 13 (2000) is adopted in the fi-nancial statements (i.e. when AFTER equals zero). Although most related prior studies find earnings and/or earnings change to be significant in ex-plaining abnormal returns, they do not measure the effects over short windows. When short windows are used, the results are mixed. For example, Amir et al. (1993) finds no market reaction to either earnings or earnings change around five-day an-nouncement windows (and interprets this as re-flecting an inability to differentiate the news
clearly), while Haw et al. (1999) report significant price reaction using three-day windows. Also, be-cause EARNB and ∆EARNB in this study are earnings and earnings change before investment properties’ value change, they are less likely to be transitory (i.e. less likely to be ‘surprises’) and may show a weaker relationship with the abnormal returns. In contrast, α5 for IPVC may show a stronger relationship. Results from Barth et al. (1990 and 1994) give support to these predictions.
3.2. Long-window abnormal return – unexpected earnings association
This study also extends the returns window to a longer period of 12 months. While a three-day short window association between abnormal re-turn and accounting information suggests that the latter is causing the former, this is not a valid claim when the association is evaluated over a long win-dow. A longer window opens the returns up to a host of other value-relevant events. Share prices reflect all available information, not just the ac-counting information. As a result, it cannot be claimed that the reported accounting information causes the abnormal return during the 12-month-long window period. The most that can be claimed is that the reported accounting information and the abnormal return are associated.
The regression equation (2) for the long window is basically the same as equation (1) for the short window, except abnormal return is measured over 12 months rather than three days.
ARL= + β
ARL is the buy-and-hold11 abnormal return
(adjusted for dividends and share splits), for the 12 months beginning the first day of the fifth month after the beginning of the accounting year, calculated using market adjusted return.
The Hong Kong Stock Exchange Listing Rules allow the Hong Kong Main Board listers to pub-lish their annual financial statements (as part of the preliminary results announcements) at the latest by the last day of the fourth month after the account-ing year-end. The 12-month window in this study therefore corresponds to the 12 months ending on this day (i.e. 12 months beginning eight months prior to and ending four months after the account-ing year).
As with the short window regression, the higher value-relevance in the longer run of the HKAS 40 11See footnote 10.
(2004) presentation of gains and losses in fair value of investment properties in the income state-ment is assessed by a positive and significant value of β8.
Predictions similar to those for the earlier three-day short window (or no prediction) are made for the other variables, except stronger relationships are expected because association rather than cau-sation is studied in 12-month windows.
4. Empirical results
Although HKAS 40 (2004) allows a free choice between cost and fair value models, all 92 compa-nies in the initial sample chose to adopt the fair value model.
All the 92 companies are retained for data analy-sis, with extreme variable values verified against their sources. Since no procedural errors or ex-traordinary events are identified, all the data col-lected for the 92 companies are retained for the subsequent analysis.12
Each company is evaluated twice, in two consec-utive accounting years before and after the adop-tion of HKAS 40 (2004).
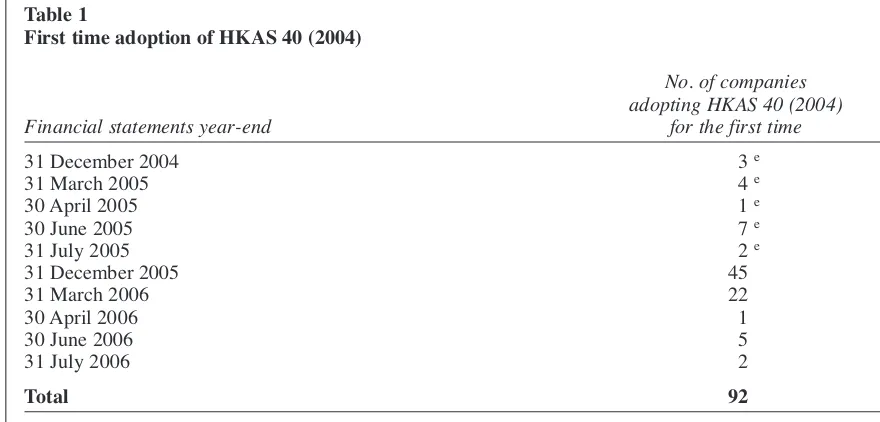
Table 1 describes the distribution of accounting year-ends, years of last-time following of SSAP 13 (2000) and years of first-time adoption of HKAS 40 (2004) for the 92 companies in this study. Appendix A details their identities. Most compa-nies have March 31 or December 31 accounting year-ends, and adopt HKAS 40 (2004) for the first time in 2005 or 2006. While HKAS 40 (2004) mandates adoption for annual periods beginning on or after 1 January 2005, 17 companies choose to adopt HKAS 40 (2004) early.13
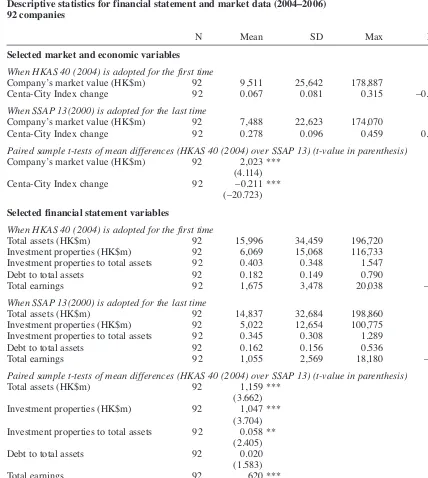
Tables 2A and 2B contain descriptive statistics for the 92 sample companies in the study during the year(s) when HKAS 40 (2004) is adopted for
the first time compared to the year(s) when SSAP 13 (2000) is adopted for the last time.
On the whole, when companies apply HKAS 40 (2004) for the first time, they are experiencing higher earnings and higher market values and of-fering their investors higher abnormal returns; this may be attributable to the strong economy in Hong Kong in 2005 and 2006. The Centa-City Index has indeed been increasing during the sample period, although at a significantly lower rate when HKAS 40 (2004) is applied for the first time. Firm size and Centa-City index changes are both controlled for in this study. Also all independent variables in this study are scaled by the company’s beginning market value. Results show a significant increase in the proportion of investment properties relative to total assets, from 0.345 when SSAP 13(2000) is applied to 0.403 when HKAS 40 (2004) is applied. There is also an indication of higher earnings volatility14 as a result of applying HKAS 40
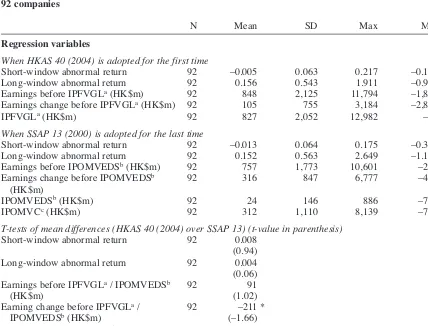
(2004). The mean gains and losses in fair value of investment properties are HK$827m which is al-most equal to the earnings before such gains and losses of HK$848m. In contrast, the mean invest-ment properties open market value excess deficits or surpluses of HK$24m amounts to only 3% of
Table 1
First time adoption of HKAS 40 (2004)
No. of companies adopting HKAS 40 (2004)
Financial statements year-end for the first time
31 December 2004 3e
31 March 2005 4e
30 April 2005 1e
30 June 2005 7e
31 July 2005 2e
31 December 2005 45
31 March 2006 22
30 April 2006 1
30 June 2006 5
31 July 2006 2
Total 92
eEarly adoption of HKAS 40 (2004)
12 Unreported findings show that similar results are
ob-tained if all extreme variable values are excluded.
13Unreported t-test results show early adopters to have
sig-nificantly higher mean amounts of total assets, investment properties, total earnings and market values. Unreported re-gression results show similar results when a dummy variable to indicate early adopters is included in the regression equa-tions.
14The increased volatility may be limited to our sample
pe-riod (2004–2006). As volatility should be a function of year-over-year change, we need to examine more years in order to conclude whether or not an increase in volatility has resulted from applying HKAS 40 (2004).
Table 2A
Descriptive statistics for financial statement and market data (2004–2006) 92 companies
N Mean SD Max Min
Selected market and economic variables
When HKAS 40 (2004) is adopted for the first time
Company’s market value (HK$m) 92 9,511 25,642 178,887 41 Centa-City Index change 92 0.067 0.081 0.315 –0.038
When SSAP 13(2000) is adopted for the last time
Company’s market value (HK$m) 92 7,488 22,623 174,070 21 Centa-City Index change 92 0.278 0.096 0.459 0.072
Paired sample t-tests of mean differences (HKAS 40 (2004) over SSAP 13) (t-value in parenthesis)
Company’s market value (HK$m) 92 2,023 *** (4.114) Centa-City Index change 92 –0.211 ***
(–20.723)
Selected financial statement variables
When HKAS 40 (2004) is adopted for the first time
Total assets (HK$m) 92 15,996 34,459 196,720 95 Investment properties (HK$m) 92 6,069 15,068 116,733 0 Investment properties to total assets 92 0.403 0.348 1.547 0 Debt to total assets 92 0.182 0.149 0.790 0 Total earnings 92 1,675 3,478 20,038 –571
When SSAP 13(2000) is adopted for the last time
Total assets (HK$m) 92 14,837 32,684 198,860 43 Investment properties (HK$m) 92 5,022 12,654 100,775 0 Investment properties to total assets 92 0.345 0.308 1.289 0 Debt to total assets 92 0.162 0.156 0.536 0 Total earnings 92 1,055 2,569 18,180 –213
Paired sample t-tests of mean differences (HKAS 40 (2004) over SSAP 13) (t-value in parenthesis)
Total assets (HK$m) 92 1,159 *** (3.662) Investment properties (HK$m) 92 1,047 ***
(3.704) Investment properties to total assets 92 0.058 **
(2.405) Debt to total assets 92 0.020 (1.583)
Total earnings 92 620 ***
(4.049)
aIPFVGL: Gains and losses in fair value of investment properties (reported in income statement under
HKAS 40 (2004))
bIPOMVEDS: Investment properties’ open market value excess deficits and surpluses (reported in income
statement under SSAP 13)
cIPOMVC: Investment properties’ open market value changes (disclosed in notes to the accounts under
SSAP 13)
* Significant at the 10% level ** Significant at the 5% level *** Significant at the 1% level
Table 2B
Descriptive statistics for regression variables (2004–2006) 92 companies
N Mean SD Max Min
Regression variables
When HKAS 40 (2004) is adopted for the first time
Short-window abnormal return 92 –0.005 0.063 0.217 –0.191 Long-window abnormal return 92 0.156 0.543 1.911 –0.997 Earnings before IPFVGLa(HK$m) 92 848 2,125 11,794 –1,897
Earnings change before IPFVGLa(HK$m) 92 105 755 3,184 –2,851
IPFVGLa(HK$m) 92 827 2,052 12,982 –20
When SSAP 13 (2000) is adopted for the last time
Short-window abnormal return 92 –0.013 0.064 0.175 –0.372 Long-window abnormal return 92 0.152 0.563 2.649 –1.158 Earnings before IPOMVEDSb(HK$m) 92 757 1,773 10,601 –216
Earnings change before IPOMVEDSb 92 316 847 6,777 –459
(HK$m)
IPOMVEDSb(HK$m) 92 24 146 886 –784
IPOMVCc(HK$m) 92 312 1,110 8,139 –784
T-tests of mean differences (HKAS 40 (2004) over SSAP 13) (t-value in parenthesis)
Short-window abnormal return 92 0.008 (0.94) Long-window abnormal return 92 0.004 (0.06) Earnings before IPFVGLa/ IPOMVEDSb 92 91
(HK$m) (1.02)
Earning change before IPFVGLa/ 92 –211 *
IPOMVEDSb(HK$m) (–1.66)
IPFVGLa/ IPOMVCc(HK$m) 92 515 ***
(3.793)
aIPFVGL: Gains and losses in fair value of investment properties (reported in income statement under
HKAS 40 (2004))
bIPOMVEDS: Investment properties’ open market value excess deficits and surpluses (reported in income
statement under SSAP 13)
cIPOMVC: Investment properties’ open market value changes (disclosed in notes to the accounts under
SSAP 13)
* Significant at the 10% level *** Significant at the 1% level
Table 3
Earnings volatility
N Mean SD Max Min
Applying HKAS 40 (2004)
Earnings volatility (number of standard 92 0.947 0.728 1.788 –0.167 deviations)
Applying SSAP 13 (2000)
Earnings volatility (number of standard 92 0.419 0.589 1.747 –0.190 deviations)
Paired-sample t-test results:
Paired differences: 0.528 number of standard deviations
t(91) = 4.679
p= 0.000
the earnings before such excess deficits or surplus-es of HK$757m.
Further indication of higher earnings volatility15
is available in Table 3 showing the results of a paired-sample t-test performed to compare the earnings volatility before and after the application of HKAS 40 (2004). Earnings volatility is ex-pressed as the number of standard deviations from a five-year mean (mean of the earnings of the five years ending on the year of HKAS 40 (2004) application). Earnings volatility is significantly higher after the adoption of HKAS 40 (2004) (t= 4.678, p= 0.000).
4.1. Short window event study
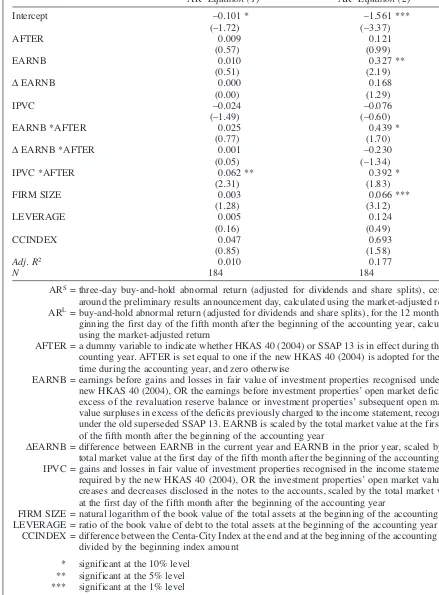
Table 4 reports the regression results from the estimation of equation (1). Results for the short-window event study provide evidence that the presentation of changes in fair value of investment properties in the income statements as required by HKAS 40 (2004) is more informative to investors than the presentation required by SSAP 13 (2000). Investors respond to the information on changes in fair value in the income statement, as released in the results announcement, causing abnormal re-turns. The coefficient α8of the interaction variable IPVC*AFTER in equation (1) is positive and sig-nificant at the 5% level (p= 0.022).
As expected, neither earnings (EARNB) nor earnings change before investment properties’ open market value/changes in fair value (∆EARNB) is significant in explaining the abnormal return with-in the short wwith-indow when SSAP 13 (2000) is adopted in the financial statements.
Although the overall R2is only 1.0%, this is
con-sistent with the results from prior short-window studies.
All the coefficients are positive except that of in-vestment properties’ value changes (i.e. IPVC), which is negative (but not statistically significant). Barth et al. (1990) and Barth (1994) also find sim-ilar negative coefficients for securities market price gains and losses and interpret them as evi-dence of a market that perceives that securities gains and losses are used to smooth earnings.
4.2. Long-window abnormal return – unexpected earnings association
The regression results for the long window ab-normal return and unexpected earnings association are reported in Table 4. As the window opens wider, the earnings before changes in open market value or fair value (i.e. EARNB) in equation (2) also become significant at the 5% level and the overall adjusted R2 increases to 17.7%. This is
consistent with the results from prior studies using long windows where significance of earnings is found together with higher overall R2.
The coefficient β8 of the interaction variable IPVC*AFTER in equation (2) is positive and sig-nificant at the 10% level (p = 0.069), consistent with the result from the short window regression in this study. This result conflicts with that from Owusu-Ansah and Yeoh (2006), who find that the recognition of unrealised gains in the income state-ment is not superior to that in the revaluation re-serve in terms of value-relevance. However, the results from this present study are more persuasive on a number of grounds: (1) Owusu-Ansah and Yeoh (2006) is based on data from the 1990s be-fore the fair value accounting requirement came into effect, while our study is based on the actual reactions from investors to the implementation of the fair value model (i.e. HKAS 40 (2004)) com-pared to their previous reaction under SSAP 13 (2000); (2) this study has a cleaner test setting as we use only the earnings capitalisation approach which focuses on income statement items, where-as Owusu-Ansah and Yeoh (2006) adopt a market value approach which examines balance sheet items. This latter approach is not appropriate since the values of investment properties (open market value or fair value) reported in balance sheets are similar, before and after the change in accounting requirements (see footnote 6); (3) the sample com-panies in this present study belong to a single in-dustry – property; as detailed earlier, the effects from other information are narrower if the sample is restricted to those companies drawn only from the property industry. Property companies are ex-pected to have more precise value estimates for their investment properties, but the Owusu-Ansah and Yeoh (2006) sample includes companies from different industries; (4) the findings of this present study have greater generality, in that they embrace companies with both value increases and decreas-es, while Owusu-Ansah and Yeoh (2006) confine their sample to those companies with positive changes in values only.
The coefficient β6 of the interaction variable EARNB*AFTER in equation (2) is also positive and significant at the 10% level (p= 0.092). This gives support for the value-relevance of other fi-nancial reporting changes that are taking place concurrently with HKAS 40 (2004) as a result of the full convergence of HKFRS with IFRS in Hong Kong in 2005. These other reporting changes interact with the earnings before changes in the fair value of open market value or fair value of investment properties (i.e. EARNB) to result in a stronger association with abnormal returns.
As with the results from equation (1) for the short window, all the coefficients are positive ex-cept those of IPVC and ∆EARNB*AFTER, which 15We also test the change in volatility after controlling for
the change in the market-wide property price levels (measured by the Centa-City Index). Similar results are obtained.
Table 4
Regression results
ARSEquation (1) ARLEquation (2)
Intercept –0.101 * –1.561 ***
(–1.72) (–3.37)
AFTER 0.009 0.121
(0.57) (0.99)
EARNB 0.010 0.327 **
(0.51) (2.19)
∆EARNB 0.000 0.168
(0.00) (1.29)
IPVC –0.024 –0.076
(–1.49) (–0.60)
EARNB *AFTER 0.025 0.439 *
(0.77) (1.70)
∆EARNB *AFTER 0.001 –0.230
(0.05) (–1.34)
IPVC *AFTER 0.062 ** 0.392 *
(2.31) (1.83)
FIRM SIZE 0.003 0.066 ***
(1.28) (3.12)
LEVERAGE 0.005 0.124
(0.16) (0.49)
CCINDEX 0.047 0.693
(0.85) (1.58)
Adj. R2 0.010 0.177
N 184 184
ARS= three-day buy-and-hold abnormal return (adjusted for dividends and share splits), centred
around the preliminary results announcement day, calculated using the market-adjusted return ARL= buy-and-hold abnormal return (adjusted for dividends and share splits), for the 12 months
be-ginning the first day of the fifth month after the bebe-ginning of the accounting year, calculated using the market-adjusted return
AFTER = a dummy variable to indicate whether HKAS 40 (2004) or SSAP 13 is in effect during the ac-counting year. AFTER is set equal to one if the new HKAS 40 (2004) is adopted for the first time during the accounting year, and zero otherwise
EARNB = earnings before gains and losses in fair value of investment properties recognised under the new HKAS 40 (2004), OR the earnings before investment properties’ open market deficits in excess of the revaluation reserve balance or investment properties’ subsequent open market value surpluses in excess of the deficits previously charged to the income statement, recognised under the old superseded SSAP 13. EARNB is scaled by the total market value at the first day of the fifth month after the beginning of the accounting year
∆EARNB = difference between EARNB in the current year and EARNB in the prior year, scaled by the total market value at the first day of the fifth month after the beginning of the accounting year IPVC = gains and losses in fair value of investment properties recognised in the income statement as required by the new HKAS 40 (2004), OR the investment properties’ open market value in-creases and dein-creases disclosed in the notes to the accounts, scaled by the total market value at the first day of the fifth month after the beginning of the accounting year
FIRM SIZE = natural logarithm of the book value of the total assets at the beginning of the accounting year LEVERAGE = ratio of the book value of debt to the total assets at the beginning of the accounting year
CCINDEX = difference between the Centa-City Index at the end and at the beginning of the accounting year, divided by the beginning index amount
* significant at the 10% level ** significant at the 5% level *** significant at the 1% level
are negative (but not statistically significant).
4.3. Sensitivity analysis
If the earnings partitioning approach developed in Barth (1994) is to be followed exactly in this study, the variable IPVC (changes in fair value of investment properties) should be equal to the ex-cess open market value deficits or surpluses recog-nised in the income statement for the accounting year when SSAP 13 (2000) is followed. This study has chosen to use the open market value increases or decreases (as disclosed in the notes to the ac-counts), in order to be consistent with the fair value gains and losses that are used to measure the variable IPVC when HKAS 40 (2004) is adopted. A sensitivity analysis is conducted using the ex-cess open market value deficits or surpluses when SSAP 13 (2000) is followed and similar results are obtained.
Another sensitivity analysis is conducted using the Hong Kong Hang Seng Composite Index as the proxy for equity market return in Hong Kong, and again, similar results are found. The Hong Kong Hang Seng Composite Index covers 90% of the market capitalisation of the shares listed on the Main Board of SEHK and there are currently 200 constituent shares in this index.
5. Conclusions
Part of the debate about the adoption of fair value accounting for investment properties is on the value-relevance of presenting changes in fair value
in the income statement, compared to reporting such changes in the revaluation reserve. This study informs this debate by providing evidence on the value-relevance of the presentation of changes in fair value in the income statement for Hong Kong listed companies in the properties industry. Results show a significant market price reaction to invest-ment properties’ fair value change information as included in companies’ annual results announce-ments. Results also show a significant association between the market-adjusted annual share returns and the presentation of the investment properties’ fair value change in the income statement. These results strongly suggest that investors appear to place more value on HKAS 40 (2004)’s presenta-tion of changes in fair value of investment proper-ties in the income statement, when compared with the presentation in the revaluation reserve under SSAP 13 (2000). The results also support the exist-ing literature on the value-relevance of presenta-tion locapresenta-tions of accounting amounts in general.
The results from this study also have implica-tions for companies around the world that prepare their financial statements using International Financial Reporting Standards.
However, because all the companies in our sam-ple choose to adopt the fair value model, we do not have a control group of companies that do not adopt the fair value model. We cannot therefore eliminate the possibility that our results are driven by other events happening at the same time as the adoption of HKAS 40 (2004).
Appendix A
92 companies in the sample (184 firm-standard)
First time Last time adoption of
SEHK Accounting following HKAS 40
Code year-end SSAP 13 (2004)
1 1 Cheung Kong (Holdings) Ltd 31 December 2003 2004 2 154 Beijing Development (Hong Kong) Ltd 31 December 2003 2004 3 758 Junefield Department Store Group Ltd 31 December 2003 2004 4 35 Far East Consortium International Ltd 31 March 2004 2005 5 172 Goldbond Group Holdings Ltd 31 March 2004 2005 6 277 Tern Properties Co Ltd 31 March 2004 2005 7 412 Heritage International Holdings Ltd 31 March 2004 2005 8 735 Oriental Investment Corporation Ltd 30 April 2004 2005 9 10 Hung Lung Group Ltd 30 June 2004 2005 10 12 Henderson Land Development Company Ltd 30 June 2004 2005 11 83 Sino Land Company Ltd 30 June 2004 2005 12 97 Henderson Investment Ltd 30 June 2004 2005 13 101 Hang Lung Properties Ltd 30 June 2004 2005 14 131 Cheuk Nang (Holdings) Ltd 30 June 2004 2005 15 247 Tsim Sha Tsui Properties Ltd 30 June 2004 2005 16 488 Lai Sun Development Co Ltd 31 July 2004 2005 17 1125 Lai Fung Holdings Ltd 31 July 2004 2005 18 14 Hysan Development Company Ltd 31 December 2004 2005
Appendix A
92 companies in the sample (184 firm-standard)(continued)
First time Last time adoption of
SEHK Accounting following HKAS 40
Code year-end SSAP 13 (2004)
19 24 Burwill Holdings Ltd 31 December 2004 2005 20 28 Tian An China Investment Company Ltd 31 December 2004 2005 21 34 Kowloon Development Company Ltd 31 December 2004 2005 22 41 Great Eagle Holdings Ltd 31 December 2004 2005 23 56 Allied Properties (HK) Ltd 31 December 2004 2005 24 66 MTR Corporation Ltd 31 December 2004 2005 25 68 Lee Hing Development Ltd 31 December 2004 2005 26 75 Y.T. Reality Group Ltd 31 December 2004 2005 27 89 Tai Sang Land Development Ltd 31 December 2004 2005 28 106 Shenzhen Hing-Tech Holdings Ltd 31 December 2004 2005 29 115 Grand Field Group Holdings Ltd 31 December 2004 2005 30 123 Guangzhou Investment Company Ltd 31 December 2004 2005 31 127 Chinese Estate Holdings Ltd 31 December 2004 2005 32 132 China Investment Holdings Ltd 31 December 2004 2005 33 141 Great China Holdings Ltd 31 December 2004 2005 34 156 Lippo China Resources Ltd 31 December 2004 2005 35 169 China Fair Land Holdings Ltd 31 December 2004 2005 36 171 Silver Grant International Industries Ltd 31 December 2004 2005 37 173 K. Wah International Holdings Ltd 31 December 2004 2005 38 184 Keck Seng Investments (Hong Kong) Ltd 31 December 2004 2005 39 201 Magnificent Estates Ltd 31 December 2004 2005 40 219 Shun Ho Technology Holdings Ltd 31 December 2004 2005 41 230 Onfem Holdings Ltd 31 December 2004 2005 42 242 Shun Tak Holdings Ltd 31 December 2004 2005 43 251 SEA Holdings Ltd 31 December 2004 2005 44 257 China Everbright International Ltd 31 December 2004 2005 45 258 Tomson Group Ltd 31 December 2004 2005 46 286 G-Prop (Holdings) Ltd 31 December 2004 2005 47 366 Luks Industrial (Group) Ltd 31 December 2004 2005 48 373 Allied Group Ltd 31 December 2004 2005 49 431 Greater China Holdings Ltd 31 December 2004 2005 50 588 Beijing North Star Co Ltd 31 December 2004 2005 51 604 Shenzhen Investment Ltd 31 December 2004 2005 52 617 Paliburg Holdings Ltd 31 December 2004 2005 53 635 Playmates Holdings Ltd 31 December 2004 2005 54 649 Shimao International Holdings Ltd 31 December 2004 2005 55 683 Kerry Properties Ltd 31 December 2004 2005 56 688 China Overseas Land & Investment Ltd 31 December 2004 2005 57 730 Shougang Concord Grand (Group) Ltd 31 December 2004 2005 58 878 Soundwill Holdings Ltd 31 December 2004 2005 59 898 Multifield International Holdings Ltd 31 December 2004 2005 60 1200 Midland Holdings Ltd 31 December 2004 2005 61 1207 Shanghai Real Estate Ltd 31 December 2004 2005 62 2355 Baoye Group Company Ltd 31 December 2004 2005 63 20 Wheelock and Company Ltd 31 March 2005 2006
64 22 Mexan Ltd 31 March 2005 2006
65 49 Wheelock Properties Ltd 31 March 2005 2006 66 88 Tai Cheung Holdings Ltd 31 March 2005 2006 67 129 Asia Standard International Group Ltd 31 March 2005 2006 68 160 Hon Kwok Land Investment Company Ltd 31 March 2005 2006 69 163 Emperor International Holdings Ltd 31 March 2005 2006 70 164 Premium Land Ltd 31 March 2005 2006 71 166 New Times Group Holdings Ltd 31 March 2005 2006
References
Aboody, D., Barth, M.E. and Kasznik, R. (1999). ‘Revaluations of fixed assets and future firm perform-ance’. Journal of Accounting Research, 36: 161–191. Amir, E., Harris, T.S. and Venuti, E.K. (1993). ‘A
compar-ison of the value-relevance of US versus non-US GAAP accounting measures using form 20-F reconciliations’.
Journal of Accounting Research, 31: 230–264.
Ball, R. and Brown, P. (1968). ‘An empirical evaluation of accounting income numbers’. Journal of Accounting Research, 6: 159–178.
Ball, R. and Kothari, S.P. (1991). ‘Security returns around earnings announcements’. Accounting Review, 66(4): 718–738.
Barth, M.E. (1994). ‘Fair value accounting: evidence from investment securities and the market valuation of banks’.
Accounting Review, 69(1): 1–25.
Barth, M.E. (2006). ‘Including estimates of the future in today’s financial statements’. Accounting Horizons, 20(3): 271–286.
Barth, M.E., Beaver, W.H. and Landsman, W.R. (1996). ‘Value-relevance of banks’ fair value disclosures under SFAS No. 107’. Accounting Review, (October): 513–537. Barth, M.E., Beaver, W.H. and Landsman, W.R. (2001). ‘The relevance of the value relevance literature for finan-cial accounting standard setting: another view’. Journal of Accounting and Economics, 31: 77–104.
Barth, M.E., Beaver, W.H. and Wolfson, M.A. (1990). ‘Components of earnings and the structure of bank share prices’. Financial Analysts Journal, 46(3): 53–60. Barth, M.E. and Clinch, G. (1998). ‘Revalued financial,
tangible, and intangible assets: associations with share prices and non-market-based value estimates’. Journal of
Accounting Research, 36: 199–233.
Barth, M.E., Clinch, G. and Shibano, T. (2003). ‘Market effects of recognition and disclosure’. Journal of Accounting Research, 41(4): 581–609.
Barth, M.E., Landsman, W.R. and Wahlen, J.M. (1995). ‘Fair value accounting: effects on banks’ earnings volatil-ity, regulatory capital, and value of contractual cash flows’. Journal of Banking and Finance, 19 (June): 577–605.
Beaver, W.H. (1981). Financial Reporting: An Accounting Revolution. Prentice Hall.
Biddle, G.C., Seow, G.S. and Siegel, A.F. (1995). ‘Relative versus incremental information content’. Contemporary Accounting Research, 12(1–1): 1–23.
Brown, L. and Warner, J.B. (1980). ‘Measuring security price performance’. Journal of Financial Economics, 8: 205–258.
Carroll, T.J., Linsmeier, T.J. and Petroni, K.R. (2003). ‘The reliability of fair value versus historical cost information: evidence from closed-end mutual funds’. Journal of Accounting, Auditing and Finance, (Winter): 1–24. Chambers, D., Linsmeier, T.J., Shakespeare, C. and
Sougiannia, T. (2006). ‘An evaluation of SFAS No. 130 comprehensive income disclosures’. Available at SSRN: http://ssrn.com/abstract=646622.
Danbolt, J. and Rees, W. (2008). ‘An experiment in fair value accounting: UK investment vehicles’. European Accounting Review, 17(2): 271–303.
Dietrich, J.R., Harris, M.S. and Muller, K.A. (2001). ‘The reliability of investment property fair value estimates’.
Journal of Accounting and Economics, 30(2): 125–158. Easton, P. and Harris, T. (1991). ‘Earnings as an
explanato-ry variable for returns’. Journal of Accounting Research, (Spring): 19–36.
Appendix A
92 companies in the sample (184 firm-standard)(continued)
First time Last time adoption of
SEHK Accounting following HKAS 40
Code year-end SSAP 13 (2004)
72 202 Interchina Holdings Co Ltd 31 March 2005 2006 73 213 National Electronics Holdings Ltd 31 March 2005 2006 74 224 Pioneer Global Group Ltd 31 March 2005 2006 75 237 Safety Godown Co Ltd 31 March 2005 2006 76 278 Wah Ha Realty Company Ltd 31 March 2005 2006 77 287 Winfair Investment Company Ltd 31 March 2005 2006 78 298 Chuang’s China Investments Ltd 31 March 2005 2006 79 480 HKR International Ltd 31 March 2005 2006 80 499 Hycomm Wireless Ltd 31 March 2005 2006 81 711 Chun Wo Holdings Ltd 31 March 2005 2006 82 1036 Winsor Properties Holdings Ltd 31 March 2005 2006 83 1124 Costal Greenland Ltd 31 March 2005 2006 84 2340 Synergies Holdings Ltd 31 March 2005 2006 85 288 Berjaya Holding (HK) Ltd 30 April 2005 2006 86 16 Sun Hung Kai Property Ltd 30 June 2005 2006 87 17 New World Development Co Ltd 30 June 2005 2006 88 54 Hopewell Holdings Ltd 30 June 2005 2006 89 659 NWS Holdings Ltd 30 June 2005 2006 90 917 New World China Land Ltd 30 June 2005 2006 91 193 Capital Estate Ltd 31 July 2005 2006 92 1191 China Rich Holdings Ltd 31 July 2005 2006