Loan Portfolio Composition and Performance of Indonesian Banks:
Does Ownership Matter?
AprianiDorkasRambuAtahau1 School of Economics and Finance
Curtin University of Technology Perth, Western Australia Email: [email protected]
Supervisor: Dr Tom Cronje
ABSTRACT
As a country hard-hit by the crisis, Indonesian banking industry underwent banking reform with changes in its bank ownership structures. The changes may have impacted the loan portfolio compositions of banks. However, there is no study to date that has empirically tested the impact of the ownership structures on loan portfolio composition and performance in Indonesia,albeit the facts that credit risk is a major bank risk.
The objective of this research is to examine the loan portfolio composition of Indonesian banks in the post crisis period and to determine whether bank ownership plays a role in the composition and performance of the portfolios. This study use secondary data from the Indonesian Banking Directory of the Indonesian Central Bank and all commercial bank annual reports provided by Infobank magazine. The research sample consists of 109 commercial banks in the year 2011. The data is analysed using multiple regression methods. It is envisaged that the research will give insight on how different bank ownership types select their loan portfolio strategies when composing their loan portfolios.
Key words: banks, loan portfolio composition, performance, bank ownership types, Indonesia
1
BACKGROUND
Banks perform many roles in the economy. Basically, banks act as intermediaries between savers and borrowers(Patrick, 2001). Other roles performedby banks are providing funds to firms, facilitating the payment system, underwriting securities, ameliorating the asymmetric information problem, providing inter-temporal smoothing of risks and finally contributing to the economic growth (Tandelilin et al., 2007, Allen and Carletti, 2008). However, the excessive risk taking of banks affects economic fragility, business-sector fluctuation and economic growth (Laeven and Levine, 2009).
For Indonesia, the collapse of its banking system during the Asian financial crisis has been devastating (Batunanggar, 2002). According to Pangestu (2003), the crisis was largely caused by weak domestic economic and financial structures, which implied weaknesses in the corporate governance of the underlying banks. Alijoyo et al. (2004), mentions that the two major corporate governance problems in the banking sector were the weak supervision from the central bank and the violations of banking regulations by the banks.
The financial crises led to a massive bank restructuring with the assistance of the International Monetary Fund and the World Bank. The restructuring consisted of the closing down of insolvent institutions, providing overdraft facilities as liquidity support for commercial banks, the establishment of the Indonesian Bank Restructuring Agency (IBRA), merging and privatisation of state-owned banks, relaxation of limitations on private ownership of banks, and external auditing by overseas auditors (Harada and Ito, 2006, Hadad et al., 2011). As a result, the number of commercial banks in Indonesia reduced from 229 before the crises to 152 in 1999, and continued to decrease to 120 banks in December 2011(Kameyama et al., 2005). The declining trend in the number of commercial banks over the period of 1996-2011 is reflectedin the figure 1.1 below:
Figure1.1: Number of Indonesian Commercial Banks: 1996-2011
Source: www.bi.go.id
1 The author would like to thank Indonesian government for providing the DIKTI scholarship to undertake PhD
program. 239
222 208
164 151
145 142 138 136 131 130 130 124 121 122 120
The massive restructuring of the Indonesian banking industry not only reduced the number of banks but also changed bank-ownership structuressince government ownership decreased and private ownership (mostly foreign) increased. After privatisation of owned banks, the market share of remaining government-owned banks decreased to 36.4 percent in December 2011 from 45 percent in December 2003 (Indonesian Banking Statictics, 2003 and 2011). Foreign bank2 market share increased especially after the abolition of foreign bank branch limits and relaxation of ownership limits that occured in 1999 through the enactment of BankLaw (BL) 10/1998. The relaxation of limitations enabled foreign investors to obtain ownership in Indonesian banks of up to 99 percent, either through the capital market or by ways of mergers and acquisitions. The formerly called private domestic banks which were to be nationalised by the government under the Indonesian Bank Restructuring Agency (IBRA) had the ownership transferred to foreigners because many Indonesian banks were not financially able to participate in their recapitalisation program. As such, the ownership share of foreign investors in the Indonesian banking sector increased, as can be seen in figure 1.2 and 1.3below.
Figure 1.2 Total Assets of Different Bank Ownership Types: 1999 and 2007
Source: Prastomiyono, 2008
The figure showsthatover the period1999-2007, the total assets of foreign banksand joint venture banks have increased tremendously.RegionalDevelopmentbanksalsoshoweda similar trend, but their asset growth was far less than that of the former group. On the contrary,private-domesticand government-ownedbanksexperienced a decline intotal assets, with asignificant decrease in the case of theprivatebanks.Itindicatesthetransitionof market share fromtheprivate-domesticand government-owned bankstoforeign and joint venture banks. It implies the bigger role played by foreign and joint venture banks in the Indonesian banking industry. Loan disbursements, as measured by total loans in figure 1.3, provides similar information.
Figure 1.3 Total Loans of Different Bank Ownership Types: 1999 and 2007
Source: Prastomiyono, 2008
The nationalisation of banksafter the Asian Financial Crisis was an intense restructuring effort undertaken by the government.The de-liberalisation of the banking sector was not limited to bank consolidation, but also included numerous prudential policies. Limitations instituted on bank lending exposures to single borrowers, borrower groups and related parties, known aslegal lending limits are some of the prudential policies imposed by Bank Indonesia to manage bank concentration risk in lending. The latest regulation(PBI No 8/13/PBI/2006) sets 20 percent of bank capital as a maximum threshold for exposure to non related single borrowers, 25 percent for non-related group borrowers and 10 percent for non-related party borrowers. This forms part of the new banking architecturewhich was designed to enhance financial stability and contains prudential regulations to limit the risky lending practices while at the same time fostering the implementation of good bank governance.
The increasing role performed by foreign and private-domestic banks in the Indonesian banking industry in the post crisis, together with the prudential regulations introduced by Bank Indonesia for lending practice could have made definite differences to loan portfolio compositionsof different bank ownership types.
2
Consists of locally owned subsidiaries, joint venture banks and foreign bank branches 0
50 100
Foreign and Joint Venture
Private Domestic
Regional Govt State Owned
20.3 23.4
3.1
53.2
1999
As intermediary institutions, banks play an important role in providing funds to borrowers. Bank ownership types have affect bank loan portfolios since it may imply a focus on different customer types. This is confirmed by De-Haas et al. (2010) that bank loan portfolios are determined by bank characteristics such as ownership and size. According to Berger et al. (2005a), loan portfolio composition changes can be associated with ownership changes. As indicated byLaeven and Levine (2009), the extent of bank loan portfolio risk taking has to be linked with the ownership structure of a bank.
Based on the aforementioned statements of researchers about the relationship between loan portfolio composition and bank ownership, it is assumed that the major reform in the banking sector that consisted of changes in bank ownership structures may have resulted in substantial changes to loan portfolio compositions of banks. However, there is no study to date that has empirically tested the impact of the ownership structures on loan portfolio composition in Indonesia albeit the fact that loan risk is a major bank risk (Hammes and Shapiro, 2001, Goeltom, 2005). Although Micco and Panizza (2006) have done a comprehensive study regarding the ownership impact on performance, they did not consider the role of loan portfolio compositions. This research expands the study of the ownership impact on bank performance by incorporating loan portfolios. It aims to examine the loan portfolio composition of Indonesian banks and todetermine whether government-, domestic-, and foreign-owned banks differin terms of loan portfolio composition, risk and return.Accordingly, thisresearch contributes to the academic literature by using bank-level information about loan portfolio composition, risk and performance, and relates it to bank ownership structures.
The findings shows thatloan portfolios of government-owned banks are more concentrated on sectors not directly related to economic development, such as consumption, whereas domestic-and foreign-owned banks have more diversified loan portfolios. Domestic-owned banks are mostly involved in lending to enterprises in trade, hotels and restaurants. Foreign-owned banks are the major player in lending to business servicesand several other sectors such as manufacturing. Differences in the loan portfolio composition and concentration risk of government-,domestic-and foreign-owned banks result in different loan portfolio returns. Government-owned banks show the highest loan portfolio return compared to the other bank ownership types. Focusing on segments with low intrinsic risk provides government-owned banks with a better return. The findings support the corporate finance theory according towhich banks should implement focus strategies to reduce agency problemsand exploit their management expertise in certain sectors. Their findings do not support the traditional banking and portfolio theory according towhich banks should diversify their loan portfolio to reduce risk (Hayden et al., 2006).
2
LITERATURE REVIEW AND HYPOTHESES DEVELOPMENT
Different bank ownership types may focus on different borrower types, as reflected in their loan portfolio compositions (De-Haas et al., 2010). The different loan portfolio compositions result from inter-alia differences in organisational structure, access to liquidity, exposure to asymmetric information(Degryse et al., 2012), motives, technology and innovation capability(Berger et al., 2005a).
The composition of loan portfolios reflects to what extent banks apply focus or diversification strategies3.The diversification strategy is based on the modern portfolio theory of Markowitz (1952), and largely followed by experts in financial institutions (Winton, 1999). According to idiosyncratic risk hypothesis, diversification eliminate the specific (idiosyncratic) risk which enable banks to reduce their monitoring efforts and therefore lowering their operating costs, which ceteris paribus should lead to higher cost efficiency(Rossi et al., 2009). Furthermore, the benefit of diversification stems from employing economies of scope across different categories such as economic sectors and geographical areas(Laeven and Levine, 2007). Numerous benefits and costs of diversification were identified as indicated in Attachment1.
Although the authors did not have similar research objectives regarding diversification, Attachment 1 shows that most of them indicate risk reduction as the benefit of diversification and agency problems as the associated cost. However, many researchers4 found that diversification do not always result in reducing risks and improving return.It increases the risk in the Brazil and Italian banking sectors and reduces the performance of the banks in China, Germany and small European countries(Tabak et al., 2011).
Some governing rules like the legal lending limits that are placed on banks by the central banks are diversification favourable, whilst other regulations regarding branching, entry, and asset investment restrictions often encourage focus strategies(Berger et al., 2010).However, the existence of regulatory guidelines instigating
3The construction should take into account some factors such as asset mix, loan types, diversification, geographic limits,
expertise, policy formulation and environmental issues (SATHYE, M., BARTLE, J., VINCENT, M. & BOFFEY, R. 2003. Credit Analysis and Lending Management. Australia: John Wiley & Sons
4
diversification that result in a large number of individual clients and industries may increase monitoring cost and reduce cost efficiency(Rossi et al., 2009). Furthermore, due to the fact that managers are risk averse, they may incur additional cost in search for high quality loans to apply diversification. Those factors may reduce diversification risk-return effectiveness.
A focus strategy opposed to a loan portfolio diversification strategy, suggests concentration on specific segments where a bank has superior knowledge and monitoring ability. Focusing on a specific segment is effective when banks face information asymmetry (Acharya et al., 2002), Kamp et al. (2005),Berger et al. (2010),Tabak et al. (2011)).Due to different degrees of asymmetric information about borrowers, the composition of bank loans across sectors may differ(Dell'Ariccia and Marquez, 2004). Re-allocation of loans (commonly known as flight to captivity5), to sectors where greater adverse selection problems exist may happen when banks face mere intrinsic overall competition from other outside lenders entering the market. It means that more lenders may attract borrowers in sectors subject to low information asymmetries. The existing informed lenders may have to deal with more captured (but also higher risk) borrowers in sectors not previously forming part of their market (Dell'Ariccia and Marquez, 2004).
Degryse et al. (2012)found the differences in loan portfolio composition of different bank ownership types based on data from 110 Polish banks. Their findings show that foreign banks charge lower lending rates and have lower interest spreads. The lending rate difference is caused by their loan portfolio composition relating to differences in transparent, short-term and foreign-exchange borrowers.
Using ordinary least square regression, De-Haas et al. (2010)confirmed differences in the loan portfolio composition of bank ownership types bytheir research of 220 banks in 20 transition countries. They used several loan type variables such as mortgages and other consumer lending; small and medium enterprises; lending to large entrepreneurs; and lending to state-owned entrepreneurs. The results show that State-owned banksstill lend more to state-owned enterprises than domestic and foreign banks. Foreign banks focus on mortgage lending and lending to subsidiaries ofinternational firms, but their focus on foreignclients is limited to the corporate segment. The research did not include economic sector category analysis, but this may be due to the inexistence of micro-level data to conduct such analysis. Also otherprevious research about loan portfolio composition using economic sector categories and bank ownership types, could not be retrieved.
Research that only considered loan portfolio composition, generally examined the effect of diversification on bank return and risk.6 Unlike loan portfolio composition, research about concentration risk is limited. Düllmann and Masschelein (2006),Dietsch and Petey (2009), and Bandyopadhyay (2010)are among the few authors who measured the impact of concentration risk on bank capital. Düllmann and Masschelein (2006)examined the relationship between business-sector concentration and economic capital for loan portfolios. Dietsch and Petey (2009) focused on the measurement of risk under Pilar 2 of the Basel II regulation. They extended a one factor credit default model to measure the concentration potential within large portfolios of small and medium businesses. Bandyopadhyay (2010)demonstrated that the regional, industry and individual loan portfolio concentration may be assessed using the economic capital approach.
Researchers such as Berger et al. (2005a)andIannotta et al. (2007) investigated banks performance difference between bank ownership types. Their unit of analysis was bank performance although loan portfolio performance formed part of it. Berger et al. (2005a)used portfolio reallocations after changes in bank ownership types to test the significance thereof. The findings indicate that the performance of government-owned banks that were privatised are better in terms of capital allocation efficiency since more credit is provided to industries that contribute more to the GDP.Iannotta et al. (2007)investigated the performance and risk of European banks with different bank ownership structures. They found significant differences in the performance and risk of different ownership types. Private banks appear to be more profitable than both mutual and public sector banks with higher profit from net returns on their earning assets. On the risk side, public sector banks have poorer loan quality and higher insolvency risk than other types of banks, while mutual banks have better loan quality and lower asset risk than both private and public sector banks.
The significant characteristic differences between the major bank ownership types (government-, domestic-, and foreign-owned banks) based on research findings are summarised in Attachment 2. In this regard it is evident that many research findings indicate that:
5 Flight to captivity implies that banks re-allocate their portfolio towards more captive borrowers when shocks to their
balance sheet, or from their competitive environment, force them to alter their lending patterns
6Among others are: Rossi et al. (2009), Tabak et al. (2011), Kamp et al. (2005), Langrin and Roach (2009), Kamp et al.,
a) Government-owned banks apply low credit availability due to connected lending;provide loans that the private sector would not grant; have high risk exposure due to its Non Performing Loans (NPLs); and show low profit and cost efficiency, have different loan portfolio composition and performance compared to that of other types of ownership.
b) Domestic-owned banks apply more aggresive lending and havehigher portfolio risks than foreign banks; have limited access to external liquidity;butbetter local market knowledge.
c) Foreign-owned banks apply better credit availability due to less connected lending, and advanced risk management technology and superior access to capital markets and technologies; may result in different composition and performance.
In view of the performance related characteristics of the different bank ownership types, it is hypothesized that there exists loan portfolio composition and risk differences among different types of bank ownership. As a result their performance may also differ.
3 RESEARCH METHOD
3.1 Sample, Types and Sources of DataThe sample for this research consists of 109 commercial banks in Indonesia for the year 2011. Thepopulation is 120 commercial banks that were actively operating in that year. By design, 11 Islamic commercial banks are excluded from the sample due to different accounting/financial reporting standards compared to that of the conventional banks.
This research uses secondary data from The Indonesian Central Bank Library, Infobank magazine and the library of The Indonesian Banking Development Institute (LPPI). The central bank library provides individual bank ownership data and financial statements whereas Infobank magazine supply notes of financial statements for each individual bank from which information regarding loan allocation, based on loan types and economic sectors, can be retrieved. The data regarding the comparative exposures of individual Indonesian banks to all the different economic sectors and different finance types will make the results more accurate in comparison to other studies about this topic. Finally, LPPI supplement the loan allocation data which are not provided by Infobank magazine.
3.2 Variable Definition and Measurement
The dependent variable in this research is loan portfolio return as measured by the ratio of net interest income to total loans. There are three independent variables in this research: bank ownership types, concentration risk and intrinsic risk. For analysis purposes banks are categorised into three types of ownership(government, domestic and foreign) according to the criteria ofMian (2003)andMagalhaes et al. (2010), by first calculating the total ownership percentage of government-, foreign- and domestic-owners for each bank.This research uses 20% threshold which is consistent with the previous research conducted by La-Porta et al. (2002), Dinc (2005), Haw et al. (2010) and Taboada (2011). This research uses two dummy variables to identify the three types of bank ownership. Table 3.1shows the detail of these dummy variables (government-owned banks are treated as the omitted variable).
Table 3.1 Dummy Variables of Bank Ownership Types
Dummy Variables Bank Ownership Types
D1 1=Domestic-owned Banks; 0=Others
D2 1=Foreign-owned Banks; 0=Others
The concentration risk is measured using a Hirschman Herfindahl Index (HHI) as done by Winton (1999), Acharya et al. (2002) and Hayden et al. (2006). For this research, there will be two types of HHI’s, namely Economic Sector7 HHI (E-HHI) and Loan Type HHI (T-HHI). Loan concentration means high exposure to one or a few of these sectors, whilst diversification means a more equal loan portfolio distribution (Tabak et al., 2011). The intrinsic risk is measured by usingthe ratio of non-performing loans (NPLs) to total loans. Bank size in addition tobank ownership is used asa control variable and isexpressed as the logarithm of total assets. Attachment 3reflects all the variables, their definitions and how they are measured.
7 The Indonesian economic sectors to which banks can lend are equal to 10 according to central bank classification as
3.3 Method of Analysis
This research is based on quantitative data analysis since it deals with numerical data with ratio data types. The descriptive statistics of the variables: mean, median, maximum, minimum and standard deviation are calculated to obtain a brief understanding of data tendency and deviations. To determine the impact of different ownership types on the composition, risk and performance,this research employs multiple regressions, with the equation in attachment 4.
4
RESULT AND DISCUSSIONS
Prior toanalyzing the data, the test of classical assumptions: normality, linearity, homoscedasticity and multicolinearitywas conductedsince the usage of multiple regressions requires several assumptions (attached are the SPSS results). The testing of normality, linearity and homoscedasticity assumptions were done by examining the residual scatterplots (Tabachnick and Fidell, 2007).The results showthat the assumptions of normality, linearity and homoscedasticity are satisfactory. The same result was found for multicolinearity8. Based on the results, it could be concluded that the regression model used in this research satisfied the underlying assumptions.
4.1 Descriptive Statistics
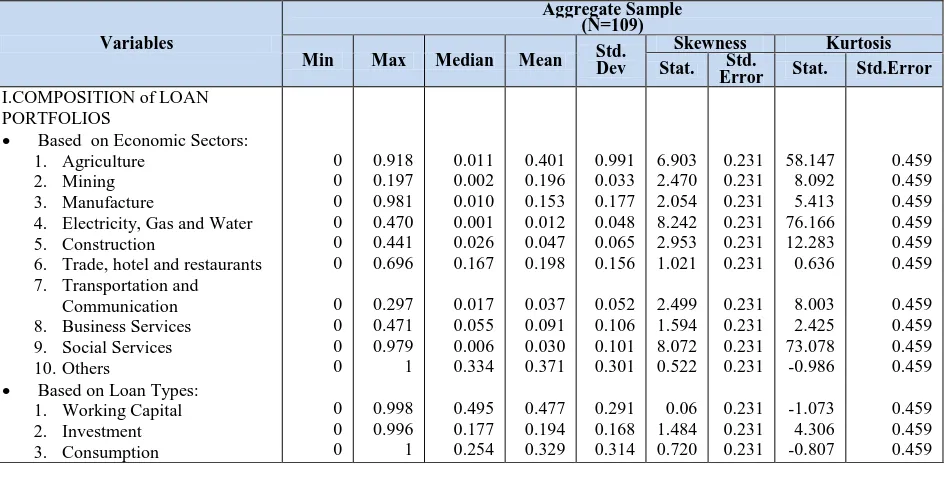
Table 4.1contains the summary statistics of the variables in the model. The first part presents the descriptive statistics regarding loan allocation based on economic sectors and loan types. The variation for loans allocated to each sector is higher than that for loan types. The deviation between the mean and median for loan allocation to each sector is also higher than that of loan types. Observing the skewness statistics and standard error provides evidence of the skewness in the distribution of loans allocated to each sector and type of finance. Only loans allocated as working capital show normal distribution since the skewness falls within the range between -2 and +2.The positive skewness for all variables indicate the tendency of scores to be clustered to the left – representing low values. On the other hand, the majority positive kurtosis statistics indicate that some distributions are relatively peak (clustered in the centre). The non-normal distribution due to positive skewness for loan allocation to each sector and type of finance indicates the need for transformation. Therefore those values were all transformed to natural logarithm (ln) as the appropriate methods for the positively skewed distribution(Tabachnick and Fidell, 2007). The values of other variables (concentration risk, intrinsic risk, and return) were not transformed since the residual scatterplot of regression involving these variables indicate a normal distribution.
Table 4.1 Descriptive Statistics of Research Variables
Variables
Aggregate Sample (N=109)
Min Max Median Mean Std. Dev
Skewness Kurtosis
Stat. Error Std. Stat. Std.Error
I.COMPOSITION of LOAN PORTFOLIOS
Based on Economic Sectors: 1. Agriculture
2. Mining 3. Manufacture
4. Electricity, Gas and Water 5. Construction
6. Trade, hotel and restaurants 7. Transportation and
Communication 8. Business Services 9. Social Services 10.Others
Based on Loan Types: 1. Working Capital 2. Investment 3. Consumption 0 0 0 0 0 0 0 0 0 0 0 0 0 0.918 0.197 0.981 0.470 0.441 0.696 0.297 0.471 0.979 1 0.998 0.996 1 0.011 0.002 0.010 0.001 0.026 0.167 0.017 0.055 0.006 0.334 0.495 0.177 0.254 0.401 0.196 0.153 0.012 0.047 0.198 0.037 0.091 0.030 0.371 0.477 0.194 0.329 0.991 0.033 0.177 0.048 0.065 0.156 0.052 0.106 0.101 0.301 0.291 0.168 0.314 6.903 2.470 2.054 8.242 2.953 1.021 2.499 1.594 8.072 0.522 0.06 1.484 0.720 0.231 0.231 0.231 0.231 0.231 0.231 0.231 0.231 0.231 0.231 0.231 0.231 0.231 58.147 8.092 5.413 76.166 12.283 0.636 8.003 2.425 73.078 -0.986 -1.073 4.306 -0.807 0.459 0.459 0.459 0.459 0.459 0.459 0.459 0.459 0.459 0.459 0.459 0.459 0.459
8The normality assumption is satisfied since the residual scatterplot reveals a pileup of residuals in the centre of the plot at
II. RISKS
Concentration Risks (HHI) 1. By Economic Sector (EHHI) 2. By Loan Types (THHI)
Intrinsic Risks (NPL)
0.144 0.246 -1.140 1 1 4.46 0.317 0.482 0.670 0.402 0.530 0.953 0.223 0.218 1.043 1.156 0.794 1.582 0.231 0.231 0.231 0.383 -0.403 2.603 0.459 0.459 0.459 III. RETURN (RETR)
Net Interest Income Ratio 0.010 0.22 0.076 0.083 0.039 0.911 0.231 1.084 0.459 III. CONTROL
Total Assets (Ln TA) 12.022 20.010 15.679 15.800 1.724 0.231 0.231 -0.251 0.459
The mean of (ln) bank size is 15.8 or approximately32,289,973 million Rp (about 3,588 million US$). In percentage, the NPL (net) is low with an average ofless than 1 percent (0.953 % ). It is comparatively low to the 5% threshold enacted by the central bank.By analyzing the mean and the standard deviation of HHI as concentration measure, it can be seen that loan portfolios based on economic sectors are less concentratedthan portfolios based on loan types. It implies more diversified loan portfolios in terms of economic sectors rather than loan types. However, both measures show that overall the Indonesian bank loan portfolios seem to be moderately concentrated. This is similar with the case of Brazilian banks which also falls in the range ofmoderate HHI with HHI 0,316 and only more diversified than Argentina with HHI 0.55(Tabak et al., 2011).
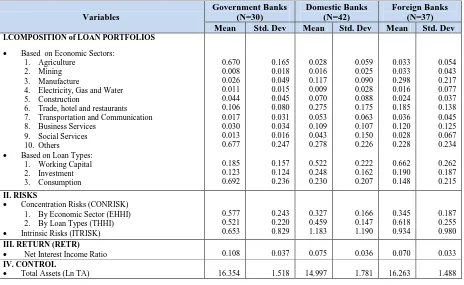
Table 4.2 shows that government-owned banks have the highest concentration risk based on sectors, however they have the lowest intrinsic risk and highest return. As stated by Deutsche Bundesbank (2006), focusing on specific segments may create concentration risk but as long as the targeted sector consists of high quality borrowers with low intrinsic risk,it may result in high return. As government-owned banks focus on consumer loans withdirect salary deduction,the associatedintrinsic riskis low. Consumer loans provide government-owned banks with high return since the interest rate earned from this segment is high compared to that of other types of financing. Based on data from Indonesian Statistics Bureau (www.bps.go.id), the average consumer loan interest rate is approximately 1.5-2 % higher than that of other types of financing. Moreover, since managers of government banks are mostly government bureaucrats, their risk averse profile may affect their decision to focus on specific segments since applying diversification will incur additional cost for searching high quality borrowers in other segments (Rossi et al., 2009).
Table 4.2 Descriptive Statistics of Research VariablesBy Types of Bank Ownership
Variables Government Banks (N=30) Domestic Banks (N=42) Foreign Banks (N=37)
Mean Std. Dev Mean Std. Dev Mean Std. Dev
I.COMPOSITION of LOAN PORTFOLIOS
Based on Economic Sectors: 1. Agriculture
2. Mining 3. Manufacture
4. Electricity, Gas and Water 5. Construction
6. Trade, hotel and restaurants 7. Transportation and Communication 8. Business Services
9. Social Services 10. Others
Based on Loan Types: 1. Working Capital 2. Investment 3. Consumption 0.670 0.008 0.026 0.011 0.044 0.106 0.017 0.030 0.013 0.677 0.185 0.123 0.692 0.165 0.018 0.049 0.015 0.045 0.080 0.031 0.034 0.016 0.247 0.157 0.124 0.236 0.028 0.016 0.117 0.009 0.070 0.275 0.053 0.109 0.043 0.278 0.522 0.248 0.230 0.059 0.025 0.090 0.028 0.088 0.175 0.063 0.107 0.150 0.226 0.222 0.162 0.207 0.033 0.033 0.298 0.016 0.024 0.185 0.036 0.120 0.028 0.228 0.662 0.190 0.148 0.054 0.043 0.217 0.077 0.037 0.138 0.045 0.125 0.067 0.234 0.262 0.187 0.215 II. RISKS
Concentration Risks (CONRISK) 1. By Economic Sector (EHHI) 2. By Loan Types (THHI)
Intrinsic Risks (ITRISK)
0.577 0.521 0.653 0.243 0.220 0.829 0.327 0.459 1.183 0.166 0.147 1.190 0.345 0.618 0.934 0.187 0.255 0.980
III. RETURN (RETR)
Net Interest Income Ratio 0.108 0.037 0.075 0.036 0.070 0.033 IV. CONTROL
Total Assets (Ln TA) 16.354 1.518 14.997 1.781 16.263 1.488
4.2 Loan Portfolio Composition of Different Bank Ownership Types
banks are, on the other hand, the major players in financing of the trade, hotel and restaurant sector although they also focus on the unspecified sector (primarily consumers) similar to the government-owned banks. The financing of the trade, hotel and restaurant sector is not surprising since as local players, domestic-owned banks may target the local businesses because they may have soft-information advantage. Mian (2003) referring to Stein (2002) states that domestic-owned banks are able to lend to “soft information firms” (firms with lack of credible and verifiable information that cannot be easily publicly verified by a third party),since domestic-owned banks possess flatter organizations (close distance between local managers and top managers).By doing so, greater discretion is allowed to local managers in executing loan decisions based on soft information
.
Finally, foreign-owned banks are targeting the business sector and also the unspecified other sector (primarily consumers) due to their superiority in technology, risk management, better access to capital market and experience in their home country.According to Berger et al. (2005a), foreign banks possess superior ability in risk management, technology (mostly in collecting and assessing hard information) and innovation. In addition, foreign banks serve customers in the host country by relying on their home country experience in the retail market (De-Haas et al., 2010). They possess better access to capital markets (Berger et al., 2005a)and external liquidity from their parent banks, compared to domestic banks(Mian, 2003).In terms of size, government-and foreign-owned banks are relatively similar in size whereas domestic-owned bank are on average smaller.Table 4.3 Relationship between Loan Portfolio Composition by Economic Sector and Bank Ownership Types
Variables Dependent Variable: Loan Portfolio Composition
1# 2 3 4 5 6 7 8 9 10
Constant -8.341 -11.697** -8.470** -9.327** -4.052** -2.246** -10.279** -9.315** -5.848** -2.541** Own_Dummy1 -0.159 3.267** 2.644** 0.377 0.464 0.969** 2.776** 2.542** 1.196** -1.032** Own_Dummy2 -0.075 3.556** 3.570** 0.037 0.130 0.840** 2.492** 2.685** 1.454** -1.708** Ln TA 0.278** 0.284** 0.216** 0.253 0.011 -0.026 0.267** 0.279** 0.051** 0.122
No of banks 109 109 109 109 109 109 109 109 109 109
R2 0.08 0.537 0.565 0.048 0.016 0.135 0.374 0.403 0.167 0.253
F test 2.592* 26.240** 44.120** 0.865 0.495 5.319** 17.532** 19.354** 4.269** 11.855**
# : The name of the corresponding number of economic sector refers to the previous explanation (see: footnote 6)
**: significant at α= 5%; *: significant at α= 10%
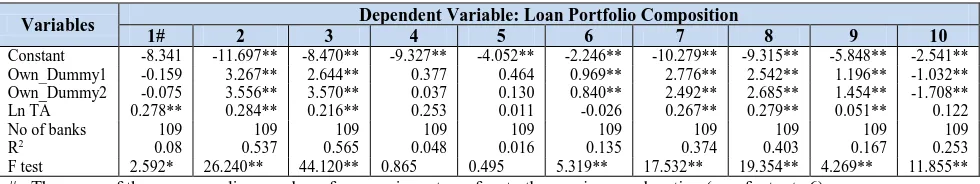
Table 4.3 shows the empirical result of equation (1): the different loan allocation focus of different bank ownership types. It is evidentthat government-owned banks are significantly more involved in lending to the last economic sector (others). Government-owned banks have also been more actively involved in lending to the agriculture sector, however the relationship is not significant. In fact, agriculture is the only sector where the loan exposure of the government-owned banks is not significant. In all the other sectors, the government-owned banks loan exposure are significant although the focus on these areas are comparatively small compared to the loan exposure of these banks to loans for the agricultural and unspecified (consumer) sectors. The loan exposure of domestic banks to both sectors identified in table 4.3 (trade, hotels and restaurants as well as the unspecified (consumer) sector) is significant in terms of table 4.4. The foreign-owned banks loan exposures to the manufacturing and the unspecified (consumer) sector in table 4.3 are also both significant in terms of table 4.4. The insignificance of three sectors in terms of loan exposures for domestic and foreign banks compared with only one sector for the government-owned banks combined with the EHHI concentration risk levels confirm the fact that although the loan exposure of government-owned banks are significantly distributed amongst more sectors than in the case of domestic and foreign banks, such distribution is comparatively extremely low compared to the sectors where concentration occurs. Thus although domestic-owned and foreign-owned banks have significant loan exposures to less sectors than the government-owned banks, they are more diversified due to higher average loan exposures to the sectors that are significant in comparison to the sectors where they have levels of concentration.
It is interesting to note that government-owned banks do not have large loan exposures in sectors like electricity, gas and water; mining; transport and communication; and social services that may have large impact
on country’seconomic development. This findings do not line up withthe social theory that government-owned
banks arethe agent of development.The requirement of some government-owned banks to operate as profit maximisation institutions as stated in Banking Law 1992 may contribute to this. Moreover, as the big four government-owned banks are publicly listed companies, they have to maximise their shareholder wealth.Table 4.4 confirms of the concentration risk in unspecified other (consumer) sector finance by government-owned banks since they are actively involved in consumption rather than working capital and investment types of finance. On the other hand, the domestic-owned banks and foreign-owned banks have more working capital loan exposures when considering the average in table 4.4 (0.522 and 0.662, respectively) combined with the significance indicators in table 4.4.
Variables Dependent Variables: Loan Portfolio Composition
Working Capital Investment Consumption
Constant -3.037** -6.681** -3.052* Own_Dummy1 1.436** 1.484** -1.335** Own_Dummy2 1.740** 1.135** -3.088**
Ln TA 0.054 0.236** 0.159
No of banks 109 109 109
R2 0.481 0.296 0.38
F test 31.805** 13.464** 21.483**
**: significant at α= 5%; *: significant at α= 10%
4.3 Loan Portfolio Performance (Risk and Return) ofDifferent Bank Ownership Types
Table 4.5 presents the results of the ordinary least square estimation of equation (2) and (3). The estimated coefficients of the ownership economic sector and loan type concentration risks,are all significant (column 2 and 4). These results give evidence that bank ownership types influence concentration risk. Based on the sign of the coefficients, it is clear that domestic- and foreign-owned banks have less concentrated loan portfolios relating to economic sectors than government-owned banks. However, based on loan types, foreign-owned banks tend to be more concentrated than other types of bank ownership.This is supported by the findings regarding the high mean exposure of 0.618 exposure of foreign banks in table 4.2. On the other hand, the coefficient of bank size as the control variable is negative and significant. It means larger bank tend to have a more diversified loan portfolios than smaller banks.
Table 4.5 Relationship between Bank Ownership Types and Risk (Concentration and Intrinsic)
VARIABLES
CONCENTRATION RISK INTRINSIC RISK
EHHI THHI NPL
(Economic Sector)
NPL (Loan Types)
Coef. t-value Coef. t-value Coef. t-value Coef. t-value
Constant OWN_D1 OWN_D2 EHHI THHI NPL LN TA No of banks R2
F test
1.347** -0.314** -0.236**
-0.047** 109 0.352 18.995**
7.392 -6.830 -5.281
-4.296
1.413** -0.136** 0.092*
-0.055** 109 0.258 12.188**
7.423 -2.826 1.974
-4.766
2.703** 0.107 -0.016 -1.249**
-0.081 109 0.090 2.560**
2.162 0.349 -0.057 -2.301
-1.230
3.141** 0.296 0.418
-1.501**
-0.104 109 0.116 3.420**
2.546 1.132 1.671
-2.930
-1.575
**: significant at α= 5%; *: significant at α= 10%
Unlike concentration risk, bank ownership types do not show significant relationship with intrinsic risk. The coefficients are positive (meanings that domestic-and foreign-owned banks experience higher intrinsic risk than government banks) but they are not significant. However, there are significantnegative relationships between both EHHI and THHI concentration risk and intrinsic risk. The coefficients are significant at α=5%. It means that banks with higher economic sector and loan type concentration risks experience lower intrinsic risk as measured by NPLs. This findings is consistent with the findings of Tabak et al. (2011) but contradicts with the ideas of Diamond (1984).As already pointed out by Rossi et al. (2009), focusing on certain market segment (a more concentrated loan portfolios) may reduce default/intrinsic risk due to a higher monitoring efficiency and
better individual loan’s quality.The comparative higher risk experienced by domestic-and foreign-owned banks
Table4.6 Relationship between Bank Ownership Types, Risks and Return
VARIABLES
DEPENDENT VARIABLES IINC
Coef. t-value Coef. t-value
Constant OWN_D1 OWN_D2 EHHI THHI NPL LN TA
0.204** -0.040** -0.037** 0.011
0.003 -0.006**
4.715 -3.883 -3.873
0.759 -2.809
0.233** -0.045** -0.038**
-0.009 0.002 -0.007**
5.334 -4.947 -4.391
-0.514 0.479 -3.206 No of banks
R2
F test
109 0.257 7.126**
109 0.256 7.105**
**: significant at α= 5%
Table 4.6 presents the results of the ordinary least square for equation (4) to check the effect of bank ownership types and loan portfolio risk on loan portfolio returns. Based on the table, bank ownership types and size significantly affect loan portfolio returns, as measured by net interest income. The negative coefficients of the bank ownership dummy regressors show that domestic- and foreign-owned banks have smaller returns compared to government-owned banks. This findingcontradictsIannotta et al. (2007) and otherliteraturethat find that government-owned banks under-perform compared to other bank ownership types(LaPorta (2002), Barth et al. (2004), Mian (2003), Beck et al. (2004), Sapienza (2004), Berger et al. (2005a), Dinc (2005), Micco and Panizza (2006), and Taboada (2011).However, it should be noted that previous research use bank returns instead of loan portfolio returns. The finding differences may emanate from the fact that this research focus on loan portfolios, which may not be comparative to total returns.
5
CONCLUSION
Previous research indicates that bank ownership type is one of the bank loan portfolio determinants, since different bank ownership types may focus on different customer types (market segments) according to their characteristics (De-Haas et al., 2010).However,literature dealing with the relationship between bank ownership types,loan portfolio composition, risk and return for Asian countries, such as Indonesiais scarce. This paper attempts to examine the loan portfolio composition of Indonesian banks in the post crisis period and to determine whether bank ownership plays a role in the composition and performance of the portfolios.
The findings support the hypotheses that different bank ownership types differ with regard to loan portfolio composition, risk and return. The loan portfolios of government-owned banks are more concentrated on sectors not directly related to economic development, such as consumption, whereas domestic-and foreign-owned banks have more diversified loan portfolios. Domestic-owned banks are mostly involved in lending to enterprises in the trade, hotels and restaurantssectors whilst foreign-owned banks are the major player in lending to the business services and several other sectors such as manufacturing
Differences in the loan portfolio composition and concentration risk of government-,domestic-and foreign-owned banks result in different loan portfolio returns. Government-foreign-owned banks show the highest loan portfolio return compared to the other bank ownership types. Focusing on segments with low intrinsic risk provides government-owned banks with a better return. The findings support the corporate finance theory according towhich banks should implement focus strategies to reduce agency problems and exploit their management expertise in certain sectors. The findings do not support the traditional banking and portfolio theory according towhich banks should diversify their loan portfolio to reduce risk (Hayden et al., 2006).
Attachment 1TheBenefit and Cost of Diversification: Summary of Selected Papers
Author (Year) Diversification Benefits Diversification Costs Hayden et al. (2006) Reduce risks of bank failure
Reduce cost to achieve credibility in bank role as screeners or monitors of borrowers
Agency Problems
Inefficient allocation of resources
Loss in bank value
Rossi et al. (2009) Reduce the cost of financial intermediation
Increase the incentive to monitor
Increased systematic risk
Berger et al.(2010) Reduce chance of financial distress
Provide cheaper way to achieve credibility of banks as monitors of borrowers
Leverage of managerial skills and abilities across products and geographic regions
Gain economies of scope and economies of scale
Provide financial supermarket ability in terms of multiple products
Dilution of management comparative advantage
Inducing competition
Increased agency costs
Elsas et al. (2010) Economies of scope
Improved resource allocation
Lower tax burden due to higher financial leverage
Ability to use firm-specific resources to extend competitive advantage from various markets
Agency problems
Inefficient internal resource allocation
Informational asymmetries between head office and divisional managers
Increased incentive for rent-seeking behaviour by managers
Tabak et al. (2011) Reduce bank probability of default
Reduce financial intermediation costs
Reduce vulnerability to economic downturns
Increased competition
Attachment 2 Characteristics of Bank Ownership Type: A Comparison
No Characteristics Government-owned Banks Private -owned Banks Foreign-owned Banks Source
1 Objective/Motives Social welfare and political
goals
Profit Maximisation Profit Maximisation for entire international organisation
Berger et al. (2005a)
2 Organisational Design and Type of borrower information used
Hierarchical/ Hard Information
Flat/ Soft Information Hierarchical/ Hard Information + soft information
Berger et al. (2005b),Mian (2003), Beck et al. (2011), Berger and Black (2011)
3 Agency Problem
Type
Degree
I (taxpayers vs bureaucrat managers)
Highest
II (Major/blockholdersvs minor shareholders)
Medium
I (shareholders vs professional managers)
Lowest
Mian (2003), Taboada (2011)
4 Nature of Corporate Governance
Cash Flow vs Control Rights
Manager Incentives to achieve objective
Cash Flow Rights = taxpayers
Control Rights = bureaucrats Low
Cash Flow Rights = Control Rights= domestic shareholders
High
Cash Flow Rights = Control Rights=
Foreign shareholders
High
Mian (2003)
5 Degree of monitoring by shareholders Low High High Mian (2003)
6 Degree of Information Asymmetry
Moral Hazard
Adverse Selection
High High
Medium Medium
Medium Medium
Dell' Ariccia and Marquez (2004)
7 Compliance to regulation Low, due to its dual role as owner and regulator
High, due to maintaining reputation
High, due to supervision and reputation (at home and host countries)
Mian (2006)
8 Response to competition Slow Quicker, as a response to
foreign bank entry
Quickest, to penetrate host
No
Characteristics Government-owned Banks Private Domestic-owned
Banks Foreign-owned Banks Source
9 Lending Decision
Loan Portfolio Allocation
Loan Portfolio Strategy
Loan Pricing
Poor (mostly based on political motives)
Specific sectors for social welfare , government related projects and institutions
Focus (on certain unprofitable industries) Low interest rate due to government subsidy
Better (mostly based on soft information)
Retail market (small domestic firms and customer for mortgage lending)
Focus (on opaque borrowers)
Higher interest rate but in narrowing spread due to competition pressure and increasing efficiency
Better (mostly based on hard information)
Large firms and government (corporate sector/ wholesale market), starting to serve retail as well
Focus (on large borrowers)
Lower interest rate due to specific portfolio composition
La-Porta et al. (2002), Mian (2003), Sapienza (2004), Dinc (2005), Micco and Panizza (2006), Detragiache et al. (2008),Berger et al. (2005a), De-Haas et al. (2010)
Berger et al. (2005a), Degryse et al. (2012)
Sapienza (2004), Detragiache et al. (2008),
Unite and Sullivan (2003), Degryse et al. (2012)
10 Risk Taking Behaviour (for bad risk)
Degree
Risk Management
High Low
Higher than Foreign Bank Medium
Low High
Mian (2003)
11 Performance
Profit
Efficiency
Low Low
Inconclusive* Inconclusive*
Inconclusive* Inconclusive*
Berger et al. (2005a), Bonin et al. (2005), Micco et al. (2007), and Iannotta et al. (2007)
12 Impact on Macroeconomic Factors
Financial Development
Access to credit
Economic growth
Better after privatisation
Better after privatisation
Low
Better after foreign bank entry and privatisation
Better after foreign bank entry
Low (due to block-holders)
Positive
Better, start to serve soft-information borrowers
Better
La-Porta et al. (2002), Montgomery (2003)
Berger et al. (2005a), Giannetti and Ongena (2005)
Unite and Sullivan (2003), Dinc (2005), Mian (2006),Micco and Panizza (2006), Detragiache et al. (2008), Taboada (2011), La-Porta et al. (2002)
Attachment 3Variables Definition and Measurement
No Variable Definition Measurement Remarks
1 a. Bank ownership Types:
Government Banks (GB)
Banks with government total ownership exceed 20% of total
bank shares, as measured directly � = ∑
�
=
GBi= the
government’s share in bank i
Sji=share of bank iowned by government i=commercial banks in Indonesia
j=bank’s shareholders
b. Bank ownership Types:
Domestic Banks (DB)
Banks with private-domestic total ownership exceed 20% of total
bank shares, as measured directly � = ∑
�
=
DBi= the private-domestic’s share in bank i
Sji=share of bank iowned by private-domestic
i=commercial banks in Indonesia
j=bank’s shareholders
c. Bank ownership Types:
Foreign Banks (FB)
Banks with foreign total ownership exceed 20% of total bank shares, as
measured directly � = ∑
�
=
FBi= the foreign’s share in bank i
Sji=share of bank iowned by foreigners
i=commercial banks in Indonesia
j=bank’s shareholders
2 Concentration Risk (CONRISK)
The risk arising from an uneven distribution of counterparties in credit or any other business relationships or from a concentration in business sectors or geographical regions which is capable of generating losses large enough to jeopardise an
institution’s solvency(Deutsche
Bundesbank, 2006)
= ∑� ( )
=
HHI= Hirschman
Herfindahl Index
Q= ∑=
� = the percentage of credit to each sector
= 10 for E-HHI and 3 for THHI
3 Intrinsic Risk (ITRISK)
A different risk inherent to each industry, region or product of a bank
(
Cronje, 2013)(Substandard+Doubtful+Loss) /Total Loans
4 Return (RETR) The net income obtained from
bank’s loan portfolio Net Interest Income/ Total Loans
5 Size (SIZE) The total assets of each individual bank
Attachment 4 :Lists of Equations
Loan Portfolio Composition
To determine whether loan portfolio composition vary significantly across different bank ownership types, the following regression model is used:
� � = + � + � + ………..(1)
Where:
� � = loan portfolio allocation on specific sector for the ith bank � = vector of ownership types variables;
� = size of bank i, as control variables; , , = regression coefficients; and
= the disturbance term. Loan Portfolio Risks
To determine whether loan portfolio concentration risk vary significantly across different bank ownership structures, the following regression model is used:
� = + � + � + ………(2)
Where:
� = loan portfolio concentration risks for the ith bank � = vector of ownership types variables
� = size of bank i, as control variables; , , = regression coefficients; and
� = the disturbance term.
In order to find the relationship between concentration risk and intrinsic risk, this research runs regression of concentration risk (both based on economic sector and loan types) to intrinsic risk for all banks by using the following equation:
�= + � + � + ………..(3)
Where:
� � = Intrinsic Risk of bank iat year t � = size of bank i, as control variables , , = Regression Coefficients
� = Disturbance Term Loan Portfolio Return
To determine whether loan portfolio return vary significantly across different bank ownership types, the following regression model is used:
= + � + � + � + � + ………(4)
Where:
= loan portfolio return for the ith bank � � = vector of ownership structure variables
� � = Intrinsic Risk of bank iat year t
� = loan portfolio concentration risks for the ith bank � = size of bank i, as control variables;
, , , , = regression coefficients; and
Attachments5: Results of Assumptions Testing for Multiple Regressions for Equation4
MulticolinearityTest
SummaryVariables Tolerance VIF
OWN_DUMMY1 .420 2.381
OWN_DUMMY2 .535 1.868
ITRISK .910 1.098
CONRISK (EHHI) .617 1.621
CONRISK (THHI) .279 3.590
SIZE .723 1.383
References
ACHARYA, V. V., HASAN, I. & SAUNDERS, A. 2002. Should Banks be Diversified? Evidence
From Individual Bank Loan Portfolios. Bank for International Settlements
ALIJOYO, A., BOUMA, E., SUTAWINANGUN, T. M. N. & KUSADRIANTO, M. D. 2004.
Corporate Governance in Indonesia. Forum for Corporate Governance Indonesia.
ALLEN, F. & CARLETTI, E. (eds.) 2008.
The Roles of Banks in Financial Systems.
BANDYOPADHYAY, A. 2010. Understanding the Effect of Concentration Risk in the Banks' Credit
Portfolio: Indian Cases. Munich Personal RePEc Archive.
BATUNANGGAR, S. 2002. Indonesia's Banking Crisis Resolution: Lessons and The Way Forward.
Bank of England.
BECK, T., DEMIRGUC-KUNT, A. & MARTINEZ-PERIA, M. S. 2011. Bank Financing for SMEs:
Evidence Across Countries and Bank Ownership Types.
Journal of Financial Services,39,
35-54.
BERGER, A. N. & BLACK, L. K. 2011. Bank Size, Lending Technologies, and Small Business
Finance.
Journal of Banking and Finance,35, 724-735.
BERGER, A. N., CLARKE, G. R. G., CULL, R., KLAPPER, L. & UDELL, G. F. 2005a. Corporate
Governance and Bank Performance: A Joint Analysis of the Static, Selection, and Dynamic
Effects of Domestic, Foreign and State Ownership.
World Bank Policy Research Paper,3632.
BERGER, A. N., HASAN, I. & ZHOU, M. 2010. The Effects of Focus versus Diversification on Bank
Performance: Evidence from Chinese Banks.
Journal of Banking & Finance,34, 1417-1435.
BERGER, A. N., MILLER, N. H., PETERSEN, M. A. & RAJAN, R. G. S., JEREMY C. 2005b. Does
Function follow organizational form? Evidence from the lending practices of large and small
banks.
Journal of Financial Economics,76, 237-269.
BONIN, J. P., HASAN, I. & WACHTEL, P. 2005. Bank Performance, Efficiency and Ownership in
Transition Countries.
Journal of Banking and Finance,29, 31-53.
CRONJE, T. 2013. Bank Lending. Australia: McGraw Hill.
DE-HAAS, R., FERREIRA, D. & TACI, A. 2010. What Determines the Composition of Bank's Loan
Portfolios? Evidence From Transition Countries.
Journal of Banking and Finance.
DEGRYSE, H., HAVRYLCHYK, O., JURZYK, E. & KOZAK, S. 2012. Foreign Bank Entry, Credit
Allocation and Lending Rates in Emerging Markets: Empirical Evidence from Poland.
Journal of Banking and Finance,
36, 2949-2959.
DELL' ARICCIA, G. & MARQUEZ, R. 2004. Information and Bank Credit Allocation.
Journal ofFinancial Economics,
72, 185-214.
DELL'ARICCIA, G. & MARQUEZ, R. 2004. Information and bank credit allocation.
Journal ofFinancial Economics,
72, 185-214.
DETRAGIACHE, E., TRESSEL, T. & GOOPTA, P. 2008. Foreign Bank in Poor Countries: Theory
and Evidence.
The Journal of Finance,LXIII, 2123-2160.
DEUTSCHE BUNDESBANK 2006. Concentration risk in Credit Portfolios. DEUTSCHE
BUNDESBANK.
DIAMOND, D. W. 1984. Financial Intermediation and Delegated Monitoring.
Review of EconomicStudies,
51, 393-414.
DIETSCH, M. & PETEY, J. 2009. Sector concentration risk in SME credit portfolios :A multifactor
approach. France: Université de Strasbourg
DINC, I. S. 2005. Politicians and Banks: Political Influences on Government-Owned Banks in
Emerging Markets.
Journal of Financial Economics,77, 453-479.
DÜLLMANN, K. & MASSCHELEIN, N. 2006. Sector concentration in loan portfolios and economic
capital
Deutsche Bundesbank.
GOELTOM, M. S. 2005. Indonesia's Banking Industry: Progress to Date.
Country Paper for BISDeputy Governor Meeting.
Bank for International Settlement.
HADAD, M. D., HALL, M. J. B., KENJEGALIEVA, K. A. & SANTOSO, W. 2011. Productivity
Changes and Risk Management in Indonesian Banking: A Malmquist Approach.
AppliedFinancial Economics,
21, 847-861.
HAMMES, W. & SHAPIRO, M. 2001. The Implications of the New Capital Adequacy Rules for
Portfolio Management of Credit Assets.
Journal of Banking and Finance,25, 97-114.
HARADA, K. & ITO, T. 2006. Rebuilding the Indonesian Banking Sector- Economic Analysis of
Bank Consolidation and Efficiency.
JBICI Review,12, 32-59.
HAW, I. M., H, S. S. M., H, B. & W, D. 2010. Concentrated Control, Institutions, and Banking Sector:
An International Study. 34.
HAYDEN, E., PORATH, D. & VON WESTERNHAGEN, N. 2006. Does Diversification Improve the
Performance of German Banks? Evidence From Individual Bank Loan Portfolios. Deustche
Bundesbank
IANNOTTA, G., NOCERA, G. & SIRONI, A. 2007. Ownership Structure, Risk and Performance in
the European Banking Industry.
Journal of Banking & Finance,31, 2127-2149.
KAMEYAMA, T., SETIADHI, V. D., ALIJOYO, A. & BOUMA, E. 2005. Corporate Governance of
Banks in Indonesia. PT UFJ Institution Indonesia
Forum Corporate Governance Indonesia.
KAMP, A., PFINGSTEN, A. & PORATH, D. 2005. Do banks diversify loan portfolios? A tentative
answer based on individual bank loan portfolios. Deutsche Bundesbank.
LA-PORTA, R., LOPEZ-DE-SILANES, F. & SHLEIFER, A. 2002. Government Ownership of
Banks.
Journal of Finance,LVII, 265-301.
LAEVEN, L. & LEVINE, R. 2007. Is There a Diversification Discount in Financial Conglomerates?
Journal of Financial Economics
, 331-367.
LAEVEN, L. & LEVINE, R. 2009. Bank Governance, Regulation and Risk Taking.
Journal ofFinancial Economics
, 259-275.
MAGALHAES, R., URTIAGA, M. G. & TRIBO, J. A. 2010. Banks' Ownership Structure, Risk and
Performance.
MARKOWITZ, H. 1952. Portfolio Selection.
The Journal of Finance7, 77-91.
MIAN, A. 2003. Foreign, Private Domestic, and Government Banks: New Evidence from Emerging
Markets.
MIAN, A. 2006. Distance Constraints: The Limits of Foreign Lending in Poor Economies.
TheJournal of Finance,
LXI, 1465-1505.
MICCO, A. & PANIZZA, U. 2006. Bank Ownership and Lending Behavior.
Economics Letters.MICCO, A., PANIZZA, U. & Y, M. 2007. Bank Ownership and Performance: Does Politics Matter?
Journal of Banking and Finance
, 219-241.
MONTGOMERY, H. 2003. The Role of Foreign Banking in Post Crisis Asia: The Importance of
Method of Entry.
ADB Institute Research Paper.
PANGESTU, M. 2003. The Indonesian Bank Crisis and Restructuring: Lessons and Implications for
other Developing Countries.
G-24 Discussion Paper Series.New York and Geneva: United
Nations
PATRICK, H. 2001. Corporate Governance and The Indonesian Financial System: A Comparative
Perspective.
ROSSI, S. P. S., SCHWAIGER, M. S. & WINKLER, G. 2009. How Loan Portfolio Diversification
Affects Risk, Efficiency and Capitalization: A Managerial Behavior Model for Austrian
Banks.
Journal of Banking and Finance,33, 2218-2226.
SAPIENZA, P. 2004. The Effects of Government Ownership on Bank Lending.
Journal of FinancialEconomics
, 357-384.
SATHYE, M., BARTLE, J., VINCENT, M. & BOFFEY, R. 2003. Credit Analysis and Lending
Management. Australia: John Wiley & Sons
TABACHNICK, B. G. & FIDELL, L. S. 2007. Using Multivariate Statistics. Fifth Edition ed. United
States of America: Pearson Education Inc.
TABAK, B. M., FAZIO, D. M. & CAJUEIRO, D. O. 2011. The Effects of Loan Portfolio
Concentration on Brazilian Banks' Return and Risk.
Journal of Banking and Finance,35,
3065-3076.
TABOADA, A. G. 2011. The Impact of Changes in Bank Ownership Structure on The Allocation of
Capital: International Evidence.
Journal of Banking and Finance,35, 2528-2543.
TANDELILIN, E., KAARO, H. & MAHADWARTHA, P. A. 2007. Corporate Governance, Risk
Management, and Bank Performance: Does Type of Ownership Matter? .
EADN WorkingPaper.
East Asia Development Network.
UNITE, A. A. & SULLIVAN, M. J. 2003. The Effect of Foreign Entry and Ownership Structure on
the Philippine Domestic Banking Market.
Journal of Banking and Finance,27, 2323-2345.
WINTON, A. 1999. Don't Put All Your Eggs in One Basket? Diversification and Specialization in