Incorporating Markov chain modelling and QFD into
Kansei engineering applied to services
Markus Hartono*
Department of Industrial and Systems Engineering, National University of Singapore,
1 Engineering Drive 2, 117576, Singapore and
Department of Industrial Engineering, University of Surabaya,
Jalan Raya Kalirungkut, Tenggilis, Surabaya, 60293, Indonesia Fax: +65-6775-9330
E-mail: [email protected] *Corresponding author
Tan Kay Chuan
Department of Industrial and Systems Engineering, National University of Singapore,
1 Engineering Drive 2, 117576, Singapore E-mail: [email protected]
Shigekazu Ishihara
Kansei Design Department, Hiroshima International University,
555-36, Kurose Gakuendai, Higashi Hiroshima City, Hiroshima Prefecture, 739-2695, Japan
E-mail: [email protected]
John Brian Peacock
Department of Industrial and Systems Engineering, National University of Singapore,
1 Engineering Drive 2, 117576, Singapore E-mail: [email protected]
Abstract: Instead of usability, customers today concern themselves more
on satisfying their emotions/Kansei. This paper discusses an integrative framework that incorporates the Kano model, Markov chain, and quality function deployment (QFD) into Kansei engineering (KE). Its purposes are:
1 to exhibit the relationship between service performance and Kansei
A comprehensive case study involving Indonesian, Japanese, and Singaporean tourists, was carried out. Understanding the cultural differences with respect to Kansei evaluation will yield valuable insights for international marketing strategies.
Keywords: Kano model; Kansei engineering; KE; Markov chain modelling;
services; emotion; Kansei; service performance; current preference; future preference; cultural differences; international marketing strategies; quality function deployment; QFD.
Reference to this paper should be made as follows: Hartono, M., Chuan, T.K.,
Ishihara, S. and Peacock, J.B. (2012) ‘Incorporating Markov chain modelling and QFD into Kansei engineering applied to services’, Int. J. Human Factors and Ergonomics, Vol. 1, No. 1, pp.74–97.
Biographical notes: Markus Hartono is an Assistant Professor in Engineering
Management research group at the Department of Industrial Engineering, Faculty of Engineering, University of Surabaya, Indonesia. He received his BEng in Industrial Engineering from University of Surabaya, Indonesia, and MSc from National University of Singapore (NUS), Singapore. Currently, he is a full-time PhD student at the Department of Industrial and Systems Engineering, NUS. In 2011, he received two prestigious awards (‘Best Paper Award’ and ‘Young Service Researcher Award’) at The 2nd International Research Symposium on Service Management (IRSSM-2) in Yogyakarta, Indonesia. He is also a certified human factors professional (CHFP) issued by BCPE, and a member of Indonesian Ergonomics Society (PEI).
Tan Kay Chuan received his PhD in Industrial Engineering and Operations Research (concentration in human factors engineering) from the Virginia Polytechnic Institute and State University, USA, in 1990. He has been with the Department of Industrial and Systems Engineering, NUS, since then. He is currently associate professor and certified human factors professional (CHFP) issued by Board of Certification in Professional Ergonomics (BCPE). His teaching expertise is in human factors engineering, engineering statistics, engineering economy, quality planning and management, and more recently service innovation and management, and Six Sigma. His research interests are in quality function deployment, quality award systems, and innovation in service design.
Shigekazu Ishihara is a Professor at the Department of Kansei Design, Hiroshima International University, Hiroshima, Japan. He received his Bachelor and Postgraduate degrees from the Department of Psychology at Nihon University. In addition, he received his PhD from Hiroshima University, Japan. Since joining Professor Mitsuo Nagamachi, he has been researching the theoretical side of Kansei engineering such as psychological measurements, and researching and creating (new) multivariate analysis methods. He is a certified professional ergonomist (CPE-J) and an expert of product development and improvement with ergonomics, general ergonomics, Kansei Engineering, and gerontechnology.
Biomedical Institute/NASA. His teaching and research interests cover human factors/ergonomics, biomechanics, simulation, statistics, system safety, and socio-technical system design.
1 Introduction
Competitive price and performance features have become prominent factors in deciding which products to buy (Schifferstein and Hekkert, 2008). Each product or service therefore needs to offer features or properties that distinguish it and attract customers. Nowadays, the focus of customers refers to the switch between functionalism and product semantics. Quick model changes, technical updates, and price reduction are no longer sufficient (Shaw and Ivens, 2002). An impression evoked by a product experience is deemed to bring customer satisfaction (Khalid and Helander, 2006; Schifferstein and Hekkert, 2008). Norman (2004) argues that products or systems that are able to make customers happy are easier to deal with.
In dealing with customer emotions, KE has been extensively applied (Nagamachi, 1995, 2002a, 2002b). Its applications cover product design and service quality improvement (Nagamachi and Lokman, 2011). Recent research (see Hartono and Tan, 2011) has extended the application of Kansei engineering (KE) into international-class services and cross-cultural studies. Although the focus of many studies on service quality has been mainly on cognition (Liljander and Strandvik, 1997; Wong, 2004; Ladhari, 2009), this study was carried out to highlight the role of KE in services by incorporating proper service and quality tools.
This study has two objectives. The first it is to develop an integrative framework of KE applied to services. The second is to conduct a case study on luxury hotel services involving participants from different cultural backgrounds. This paper is organised as follows. Following the introduction, a brief review of KE, the Kano model, Markov chain, and quality function deployment (QFD), is presented. Thereafter, the main contribution of this research – an integrative framework followed by a case study – is provided. A discussion and conclusion section wraps up the paper.
2 Brief literature review
2.1 Kansei and KE
According to Nagamachi (1995), Kansei is defined as the customer’s psychological feeling and image of a new product. All human senses as well as cognition are simultaneously involved (Schütte et al., 2008). KE has been in use since the 1970s. Basically, the KE methodology is useful in several regards:
• KE is able to translate customer emotions into concrete design parameters through engineering aspects (Nagamachi, 2002a, 2002b)
• besides dealing with attractive exterior appearances, KE has an ability to optimise properties that are not directly detectable or visible, such as the concept of good driving feeling (Nagamachi, 1991, 1995, 2002a, 2002b)
• KE applies statistical engineering in the use of service tools (Nagamachi and Lokman, 2011)
• KE has a strong ability to grasp and accommodate the 21st century’s trends, which are hedonism, pleasure, and individuality (Nagamachi, 1991, 1995, 2002b)
• KE has demonstrated a relationship model between cognitive and affective experiences
• an internet KE system can work as a catalyst for innovative ideas during product design process (Ishihara et al., 2005).
2.2 Physical and non-physical aspects in services
According to Bitner (1992), consumers very often use tangible aspects/physical surroundings (known as servicescape) to make judgments and evaluations. Examples of servicescape include music, air quality, furniture, style of decoration, foods served, etc. According to Lovelock and Writz (2007), it includes exterior facilities (e.g., size of building, architectural style, and parks), interior facilities (e.g., flooring and carpeting, lighting, and scents), social dimensions (e.g., employee uniforms, and personnel characteristics), etc.
Apart from that, the interaction between customers and employees plays an important role during service encounter. It covers the way service staff behaves, communicates, and dresses up. This classification recalls the definition of services as the application of specialised competences (knowledge and skills) through processes, activities and interactions, rather than physical things (Lovelock, 1991; Vargo and Lusch, 2004). The SERVQUAL model (Parasuraman et al., 1988) has provided much utility in measuring customer service experiences. Essentially, this model is the manifestation of the physical and non-physical aspects of services.
2.3 The Kano model
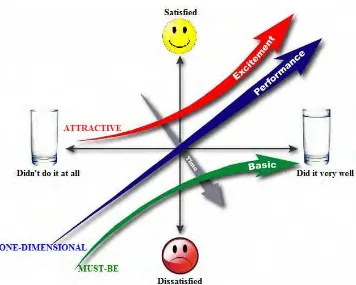
In product and service quality, the application of the Kano model (Kano et al., 1984) holds parallel to applying Herzberg’s (1968) motivator-hygiene (M-H) theory. Products or services that are categorised as motivators/delighters will lead to employee/customer satisfaction and happiness. Basically, Kano has three main satisfaction drivers (attractive [A], must-be [M], and one-dimensional [O], see Figure 1).
Figure 1 The Kano model
Source: Modified from ReVelle et al. (1998)
2.4 The Markov chain model to analyse customer preference in the future
Most available methods focus on present customer needs. However, in order to compete effectively in the long-term, a company should consider future customer needs. Studies of future VOC have been done by Shen et al. (2000) through developing fuzzy trend analysis. Their study was extended by Wu and Shieh (2006) by incorporating Markov chain modelling in the HOQ. Markov’s processes assume that a system that starts at the initial state will change over time. A special model of Markov process, Markov chain, is used to study the short- and long-run behaviour of certain stochastic systems (Taha, 1997).
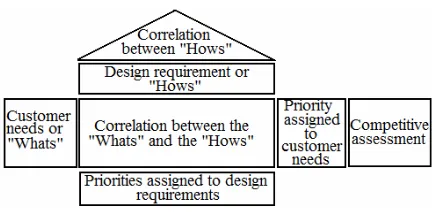
2.5 Quality function deployment
information to organisations in setting their targets and determining the priority of actions that need to be taken (Pawitra and Tan, 2003).
Figure 2 Components of HOQ
3 Proposed integrative framework and its illustrative case study
This study extends the work of Hartono and Tan (2011). The proposed integrative framework is shown in Figure 3. Empirical data were collected through a field survey involving Indonesian, Singaporean, and Japanese tourists. A face-to-face questionnaire was used as the primary means of data collection. The questions were pre-tested by several experienced participants and a Kansei expert to increase the face validity of the research instrument.
3.1 Subjects and service domain
Luxury hotels was selected as the service domain to study. According to Barsky and Nash (2002), luxury hotels are reported to have greater strength of emotions than any other hotel segment. Our survey was conducted in some tourism places, shopping centres, departure and arrival halls of international airports, and hotel areas.
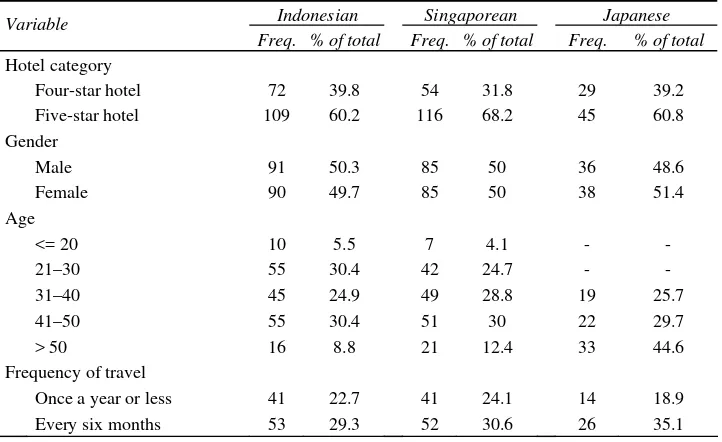
Potential respondents were approached and asked whether they would like to participate. The interviewer briefly introduced his identity, purpose of the study, and procedure of the survey. In total, 425 relevant responses were collected over a one-year period (January 2010 to December 2010). The participants were composed of 181 Indonesians, 170 Singaporeans, and 74 Japanese. As shown in Table 1, the survey captured a balanced percentage of male and female respondents for each population group. Tourists of age between 21 to 30 and 41 to 50 were the two largest groups (in Indonesia and Singapore), whilst the Japanese group had the biggest portion at the age above 50. Most of the Indonesian and Singaporean tourists indicated that they were on vacation (47% and 32.9%, respectively), while the Japanese people were on business trips (39.2%). The majority travelled once every six months. The longest amount of time spent was four to seven days (39.4% in Singaporean), whilst most Indonesian and Japanese tourists spent less than three days (43.1% and 52.7%, respectively).
Table 1 Profile of respondents
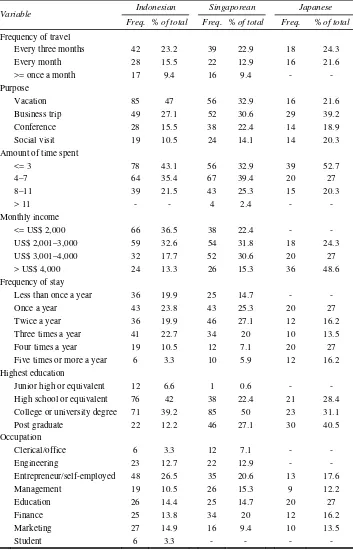
Table 1 Profile of respondents (continued)
Entrepreneur/self-employed 48 26.5 35 20.6 13 17.6
Management 19 10.5 26 15.3 9 12.2
Education 26 14.4 25 14.7 20 27
Finance 25 13.8 34 20 12 16.2
Marketing 27 14.9 16 9.4 10 13.5
3.2 Kansei structure
Kansei words were collected from interviews with seven tourists who stayed in luxury hotels (Steinar, 2007). Those collected words were then structured and finalised to be a group of 16 words. The Kansei responses and importances were rated on a five-point Likert semantic differential scale (Osgood et al., 1957). In order to reduce the bias/misinterpretation influenced potentially by the language barrier, graphical emoticons representing each Kansei word were attached to the survey form. They were adapted from Yahoo! Messenger® as mentioned in a study by Huang et al. (2008), MSN messenger (Windows Live™ Messenger), and also from the internet.
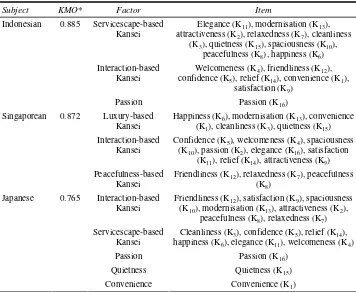
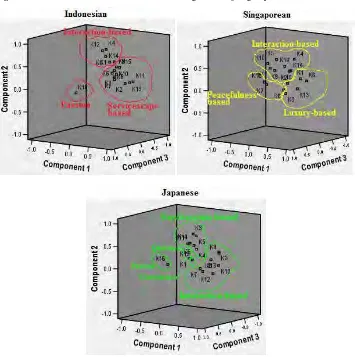
Kansei evaluation (affective process) begins with the analysis of its structure (see Table 2 and Figure 4). The exploratory factor analysis (EFA) was performed. It aims to identify the number of underlying factor structure without imposing any preconceived structure on the outcome (Child, 1990). The findings showed that there were two main latent variables (factors) formed in ‘affective process’ constructs:
1 servicescape-based Kansei: it refers to emotions caused by physical surroundings, such as happiness, cleanliness, and elegance
2 interaction-based Kansei: emotions influenced by the interaction between customer and employee, such as welcomeness, satisfaction, and friendliness.
Table 2 Factor structure of affective process/Kansei
Subject KMO* Factor Item
Servicescape-based Kansei
Elegance (K11), modernisation (K13),
attractiveness (K2), relaxedness (K7), cleanliness
(K3), quietness (K15), spaciousness (K10),
Happiness (K6), modernisation (K13), convenience
(K1), cleanliness (K3), quietness (K15)
Interaction-based Kansei
Confidence (K5), welcomeness (K4), spaciousness
(K10), passion (K2), elegance (K16), satisfaction
(K11), relief (K14), attractiveness (K9)
Singaporean 0.872
Peacefulness-based Kansei
Friendliness (K12), relaxedness (K7), peacefulness
(K8)
Interaction-based Kansei
Friendliness (K12), satisfaction (K9), spaciousness
(K10), modernisation (K13), attractiveness (K2),
peacefulness (K8), relaxedness (K7)
Servicescape-based Kansei
Cleanliness (K3), confidence (K5), relief (K14),
happiness (K6), elegance (K11), welcomeness (K4)
Passion Passion (K16)
Quietness Quietness (K15)
Japanese 0.765
Convenience Convenience (K1)
Figure 4 The visualisation of Kansei structure among three subject groups
3.3 Evaluation of service attributes incorporated the Kano model
Figure 5 The Kano evaluation process
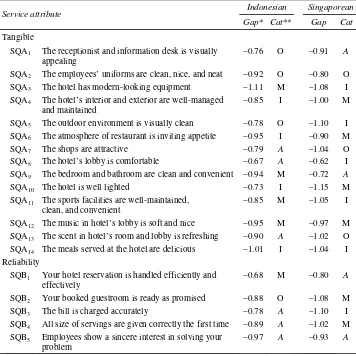
Table 3 The service quality incorporated with the Kano category
Indonesian Singaporean Service attribute
Gap* Cat** Gap Cat
Tangible SQA1 The receptionist and information desk is visually
appealing
–0.76 O –0.91 A
SQA2 The employees’ uniforms are clean, nice, and neat –0.92 O –0.80 O
SQA3 The hotel has modern-looking equipment –1.11 M –1.08 I
SQA4 The hotel’s interior and exterior are well-managed
and maintained
–0.85 I –1.00 M
SQA5 The outdoor environment is visually clean –0.78 O –1.10 I
SQA6 The atmosphere of restaurant is inviting appetite –0.95 I –0.90 M
SQA7 The shops are attractive –0.79 A –1.04 O
SQA8 The hotel’s lobby is comfortable –0.67 A –0.62 I
SQA9 The bedroom and bathroom are clean and convenient –0.94 M –0.72 A
SQA10 The hotel is well lighted –0.73 I –1.15 M
SQA11 The sports facilities are well-maintained,
clean, and convenient
–0.85 M –1.05 I
SQA12 The music in hotel’s lobby is soft and nice –0.95 M –0.97 M
SQA13 The scent in hotel’s room and lobby is refreshing –0.90 A –1.02 O
SQA14 The meals served at the hotel are delicious –1.01 I –1.04 I
Reliability SQB1 Your hotel reservation is handled efficiently and
effectively
–0.68 M –0.80 A
SQB2 Your booked guestroom is ready as promised –0.88 O –1.08 M
SQB3 The bill is charged accurately –0.78 A –1.10 I
SQB4 All size of servings are given correctly the first time –0.89 A –1.02 M
SQB5 Employees show a sincere interest in solving your
problem
–0.97 A –0.93 A
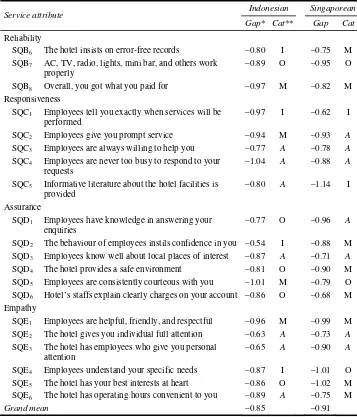
Table 3 The service quality incorporated with the Kano category (continued)
SQB7 AC, TV, radio, lights, mini bar, and others work
properly
–0.89 O –0.95 O
SQB8 Overall, you got what you paid for –0.97 M –0.82 M
Responsiveness SQC1 Employees tell you exactly when services will be
performed
–0.97 I –0.62 I
SQC2 Employees give you prompt service –0.94 M –0.93 A
SQC3 Employees are always willing to help you –0.77 A –0.78 A
SQC4 Employees are never too busy to respond to your
requests
–1.04 A –0.88 A
SQC5 Informative literature about the hotel facilities is
provided
–0.80 A –1.14 I
Assurance SQD1 Employees have knowledge in answering your
enquiries
SQE3 The hotel has employees who give you personal
attention
Notes: *Gap = perception score – expectation score; **Cat = Kano category.
3.4 Construct validation
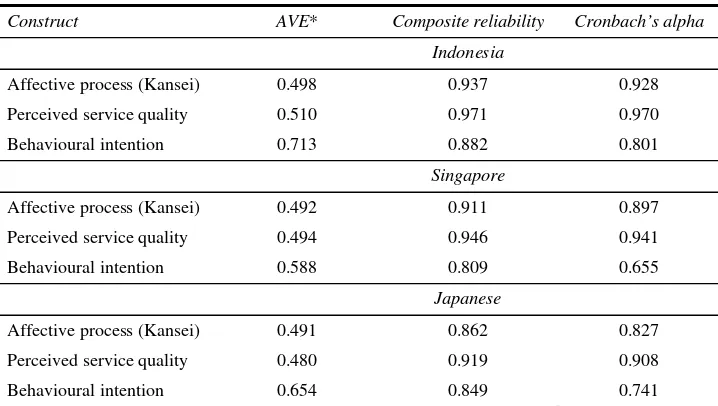
Table 4 Measurement of constructs
Construct AVE* Composite reliability Cronbach’s alpha
Indonesia
Affective process (Kansei) 0.498 0.937 0.928
Perceived service quality 0.510 0.971 0.970
Behavioural intention 0.713 0.882 0.801
Singapore
Affective process (Kansei) 0.492 0.911 0.897
Perceived service quality 0.494 0.946 0.941
Behavioural intention 0.588 0.809 0.655
Japanese
Affective process (Kansei) 0.491 0.862 0.827
Perceived service quality 0.480 0.919 0.908
Behavioural intention 0.654 0.849 0.741
Note: *Average variance extracted
In terms of convergent validity, according to Fornell and Larcker (1981), the following are used:
1 all item factor loadings and construct validities should exceed 0.7 2 average variance extracted (AVE) by each construct should exceed 0.5.
In terms of discriminant validity, the square root of AVE for a particular construct must be greater than its corresponding inter-construct correlation coefficients (Gefen and Straub, 2005). Regarding reliability, Cronbach’s alpha and composite reliability of 0.7 are used (Nunnally, 1978; Gorla et al., 2010). Items with unsatisfying values were deleted. Overall, the findings show that all constructs were assumed to be valid and reliable.
3.5 Analysis of Kano’s model and Kansei
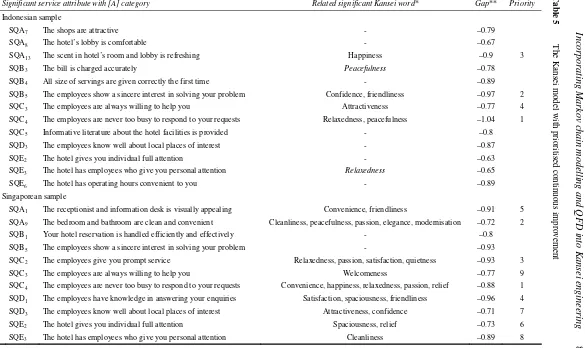
The perceived service quality and Kansei responses were met and modelled using a stepwise linear regression (Efroymson, 1960). Data from Indonesian and Singaporean perspectives were reported.
In
SQA13 The scent in hotel’s room and lobby is refreshing Happiness –0.9 3
SQB3 The bill is charged accurately Peacefulness –0.78
SQB4 All size of servings are given correctly the first time - –0.89
SQB5 The employees show a sincere interest in solving your problem Confidence, friendliness –0.97 2
SQC3 The employees are always willing to help you Attractiveness –0.77 4
SQC4 The employees are never too busy to respond to your requests Relaxedness, peacefulness –1.04 1
SQC5 Informative literature about the hotel facilities is provided - –0.8
SQD3 The employees know well about local places of interest - –0.87
SQE2 The hotel gives you individual full attention - –0.63
SQE3 The hotel has employees who give you personal attention Relaxedness –0.65
SQE6 The hotel has operating hours convenient to you - –0.89
Singaporean sample
SQA1 The receptionist and information desk is visually appealing Convenience, friendliness –0.91 5
SQA9 The bedroom and bathroom are clean and convenient Cleanliness, peacefulness, passion, elegance, modernisation –0.72 2
SQB1 Your hotel reservation is handled efficiently and effectively - –0.8
SQB5 The employees show a sincere interest in solving your problem - –0.93
SQC2 The employees give you prompt service Relaxedness, passion, satisfaction, quietness –0.93 3
SQC3 The employees are always willing to help you Welcomeness –0.77 9
SQC4 The employees are never too busy to respond to your requests Convenience, happiness, relaxedness, passion, relief –0.88 1
SQD1 The employees have knowledge in answering your enquiries Satisfaction, spaciousness, friendliness –0.96 4
SQD3 The employees know well about local places of interest Attractiveness, confidence –0.71 7
3.6 Analysis of Kansei structural model
This process was devised to analyse the relationships among constructs of the Kansei framework (i.e., perceived service quality, cognitive process, affective process, overall satisfaction, and behavioural intention). The data were then standardised using SPSS® 13 to build a path model using PLS-Graph 2.0.
Figure 6 A structural model with path coefficients and R2 (see online version for colours)
Tan_SQ
Thereafter, it was necessary to assess the structural model by looking at the explanatory power of the structural model and the path coefficients (see Figure 6). All statistical tests were assessed using a one-tailed t-test since the hypotheses were unidirectional in nature, as the following demonstrates:
Hypothesis 1 Perceived service quality is positively related to cognitive process. The paths for all three groups were significant. Both Indonesian and Singaporean rated a larger effect of perceived service quality on cognitive process than Japanese.
Hypothesis 2 Perceived service quality is positively related to affective process. All paths in the three groups were supported. The largest effect of perceived service quality on the affective process was shown by Japanese.
Hypothesis 3 Cognitive process is positively related to affective process. This
Hypothesis 4 Cognitive process is positively related to overall satisfaction. This hypothesis was supported by the Indonesian and Singaporean samples. However, it had a reverse outcome for the Japanese group.
Hypothesis 5 Affective process is positively related to overall satisfaction. The paths for all three groups were significant. The Japanese group had the highest effect of affective process on overall satisfaction, whilst Indonesian and Singaporean relatively rated the same. This confirms that Japanese people tend to rely their overall satisfaction on affect/emotion/Kansei rather than cognition.
Hypothesis 6 Overall satisfaction is positively related to behavioural intention. All paths in three groups were supported.
This study presents empirical evidence that affective process/Kansei played an important role in service experiences. Though affective and cognitive processes were independent, the direct impact of the affective process on overall satisfaction in the present study was more significant than the direct effect of the cognitive process on overall satisfaction.
3.7 Analysis of Kansei response incorporating cultural difference
In general, Singaporean and Indonesian tended to show a similar pattern (see Figure 7). The highest score was Kansei ‘quiet’ rated by Japanese group (4.09). The Kruskal-Wallis test was used to test the difference on Kansei response.
H0 Mi1 = Mi2 = Mi3 (The median of the Kansei-i response scores are equal for three sample groups in each gender).
H1 Not all the medians are equal.
For the male group, 11 out of 13 Kansei words were significantly different among three populations, whilst eight out of 13 Kansei words were significantly different at the female counterpart (with p-values ≤ 0.05). For the male group, Kansei ‘clean’, ‘relieved’, ‘quiet’, and ‘confident’ were highly significant (dominated by Japanese). For the female group, Kansei ‘attractive’, ‘clean’, and ‘quiet’ were the most significant. In general, Japanese people perceived luxury hotels as a very clean and quiet place.
According to the cultural dimensions proposed by Hofstede and Bond (1988), as shown in Table 6, Japanese have the greatest scores among all subjects on ‘uncertainty avoidance’ (92/100), ‘masculinity’ (95/100), and ‘long-term orientation’ (80/100). Related to uncertainty avoidance, Japanese people are easily worried, nervous, and irritable. They need a more stable environment to guard against the occurrence of any uncertainty. With high scores on masculinity, Japanese tend not to value the empathy perspective of service quality. In addition, based on long-term orientation value, Japanese people are more patient with time and demand efficiency upon everything. Resting and a peaceful environment are desirable and expected. Thus, Japanese tourists tend to value luxury hotels as clean and quiet places to stay.
Table 6 The scores of national cultural dimension
Nation
Power distance Individualism Masculinity Uncertainty avoidance
Source: Hofstede and Bond (1988)
By identifying the three highest responses on luxury hotel services, both Indonesian and Singaporean shared a common Kansei: ‘elegant’. This finding was supported by the same cultural value of Singaporean and Indonesian, i.e., power distance. According to Hofstede and Bond (1988), they have high scores on power distance. In this particular culture, people believe in the unequal distribution of power and tend to easily obey authority (Hofstede and Bond, 1988). According to Furrer et al. (2000), in a society with strong ‘power distance’, customers with their superior power would expect the service providers to have less power. In addition, the grandeur of luxury hotels is perceived to be tangible objects which reveal the extent to which the service providers respect ‘the power of the superiority’ and represents the customers’ statuses (Hsieh and Tsai, 2008). The Kansei ‘elegant’ is quite related to the impression of superior tangible goods.
3.8 Analysis of future customer preference using Markov chain modelling
0.13 0.74 0.13 P 0.35 0.53 0.12 0.5 0.25 0.25
⎡ ⎤
⎢ ⎥
= ⎢ ⎥
⎢ ⎥
⎣ ⎦
where, for instance, P21 = 0.35 represents the 1-step transition probability of shifting from M (medium) to H (high), and assumed that probabilities are stationary over time. Afterwards, the future condition/steady-state probability and expected weight of each service attribute were computed using Gauss-Jordan method and solved by Microsoft® Excel solver. For instance, the steady-state probabilities for SQA1 at Indonesian group were V1 = 0.32, V2 = 0.57, and V3 = 0.11. Hence, its expected weight became 5(0.32) + 3(0.57) + 1(0.11) = 3.41. Figure 8 shows the visualisation of transition between the initial and expected steady-state weights for the first five service items.
Figure 8 Illustration of the trends for the first five service attributes
importance (with a score of 3) is used for a complementary threshold. The findings show that the most preferred service attribute in the future was SQA6 “The atmosphere of restaurant is inviting appetite” (in Indonesian) and SQD4 “The hotel provides a safe environment” (in Singaporean).
Table 7 Comparison between current and future weight values
Indonesia Singapore Item
Current weight Future weight w-gap* Current weight Future weight w-gap*
SQA1 4.00 3.41 0.59 4.03 3.16 0.87
Note: *w-gap = current weight – future weight
3.9 Incorporating the HOQ into the integrated framework for future preference
Through an inclusion of only the interesting service attributes, we analysed their importance incorporating the Kano categorisation, Kansei model, and the house of quality (HOQ) (as shown in Table 8). This was then followed by the related technical responses for improvement strategy as adopted from a study by Chang and Chen (2011) on luxury hotel services.
Table 8 Future weight of service attribute incorporated with the Kano and Kansei model
Indonesia Singapore
Item w-gap* Kano cat. Kansei-related Item w-gap* Kano cat. Kansei-related
SQA5 0.5 O Peacefulness,
Figure 9 HOQ in Indonesian group
Figure 10 HOQ in Singaporean group
Importance of ‘hows’i = j = 1n adjusted future weightji × relationship matrix value,
where j = index for ‘whats’ = 1, 2…n; and i = index for ‘hows’ = 1, 2…m. In achieving total customer satisfaction for Indonesian tourists in the future, intensive training to all employees was given the greatest priority as the improvement programme strategy.
4 Discussion
This KE study introduces the Kano model with a focus on the attractive (delighter) quality. This category is of interest to fulfil customer Kansei. According to Yang (2011), it provides several benefits such as to drive customer loyalty, differentiation, and total customer delight. From a business perspective, Collins and Porras (2004) argue that it is essential to invest in proactive and generative markets which are reflected by customer delight. The other two common Kano categories (i.e., one-dimensional and must-be) are considered as primary features to be satisfied on a regular basis. Since these qualities are less sensitive and less satisfaction-driven (Yang, 2011), as a consequence, they are unlikely to be associated with a strong emotion such as delight.
The more the Kansei are significantly influenced, the more important the service attributes are. In order to engage customer loyalty and satisfaction in the future, Markov chain model and HOQ were adopted. The research findings show that, for example, there are three service attributes still interesting in the future for Indonesians, i.e., “The outdoor environment is visually clean”, “The employees are never too busy to respond to your requests”, and “The employees are consistently courteous with you”. Using a modified HOQ methodology, service item “The employees are never too busy to respond to your requests” was given the greatest priority for improvement. The improvement relates to personnel management, general affair management, employee training, complaint responses, and information services.
Even though the debate regarding whether cognition precedes affect or affect antecedes cognition still remains unresolved (Lin, 2004), this study confirmed that Kansei was a function of perceived service quality and cognitive process.
5 Conclusions and further research
The trend of the 21st century is hedonism and pleasure. Delighting customers is an essential key in achieving total emotional satisfaction and customer retention in services. KE has shown its ability to deal with customer emotional needs in products and services. The application of KE in hospitality services is recognised as Kansei quality management (KQM) (Nagamachi and Lokman, 2011).
This study offers some potential contributions. First, the results can be used as a prioritisation tool in service quality improvement where resources are limited (e.g., budget, time, workforce, and other technical reasons). Second, this study provides a well grounded theoretical contribution to the academic literature on Kansei ergonomics, service science, quality management, and cultures. A case study that involved several different groups showed that Kansei was influenced significantly by cultural backgrounds. Third, a practical contribution is presented by giving a guideline for service managers in investigating which service attributes are significantly sensitive to customer delight and given a priority for improvement or maintenance. In addition, by using the Markov chain model, it provides valuable information for a manager or decision maker to understand how the dynamics of customer needs as time goes by so that appropriate strategy can be prepared at the early stage.
The findings of the current study have two implications for future research. First, due to resource limitation, further research should focus on investigation of the effect and causality of culture dimensions on Kansei. Second, the emotions/Kansei experienced by tourists might vary according to the type of hotel in which they stay or the different service settings. Thus, future studies could test the framework applicability either in different types of hotels (e.g., economy hotels, resort hotels, motels, and so on) or different service settings (e.g., shopping centres, restaurants, airports, and so on). These considerations of future studies are essential to verify the validity of the proposed integrative framework of Kano’s model, Markov chain, QFD, and KE in services.
References
Akao, Y. (1997) ‘QFD: past, present, and future’, Paper presented at International Symposium on QFD 1997, Linköping, Sweden.
Bagozzi, R.P. (1994) ‘Structural equation models in marketing research: basic principles’, in Bagozzi, R.P. (Ed.): Principles of Marketing Research, pp.317–385, Blackwell, Cambridge. Barsky, J. and Nash, L. (2002) ‘Evoking emotion: affective keys to hotel loyalty’, Cornell Hotel
and Restaurant Administration Quarterly, Vol. 43, No. 1, pp.39–46.
Bitner, M.J. (1992) ‘Servicescapes: the impact of physical surroundings on customers and employees’, Journal of Marketing, Vol. 56, No. 2, pp.57–71.
Chang, K-C. and Chen, M-C. (2011) ‘Applying the Kano model and QFD to explore customers’ brand contacts in the hotel business: a study of a hot spring hotel’, Total Quality Management & Business Excellence, Vol. 22, No. 1, pp.1–27.
Child, D. (1990) The Essentials of Factor Analysis, 2nd ed., Cassel Educational Limited, London. Collins, J. and Porras, J. (2004) Built to Last: Successful Habits of Visionary Companies, Harper
Efroymson, M.A. (1960) ‘Multiple regression analysis’, in Ralston, A. and Wilf, H.S. (Eds.): Mathematical Methods for Digital Computers, pp.191–203, Wiley, New York.
Fornell, C. and Larcker, D.F. (1981) ‘Evaluating structural equation models with unobservable variables and measurement error’, Journal of Marketing Research, Vol. 18, No. 1, pp.39–50. Furrer, O., Liu, B. and Sudharshan, D. (2000) ‘The relationships between culture and service
quality perceptions’, Journal of Service Research, Vol. 2, No.4, pp.355–371.
Gefen, D. and Straub, D. (2005) ‘A practical guide to factorial validity using PLS-graph: tutorial and annotated example’, Communications of the AIS, Vol. 16, No. 25, pp.91–109.
Gorla, N., Somers, T.M. and Wong, B. (2010) ‘Organizational impact of system quality, information quality, and service quality’, Journal of Strategic Information Systems, Vol. 19, No. 3, pp.207–228.
Hartono, M. and Tan, K.C. (2011) ‘A proposed integrative framework of Kansei Engineering and Kano model applied to services’, Paper presented at the 2nd International Research Symposium on Service Management (IRSSM-2), 26–30 July 2011, Yogyakarta, Indonesia. Herzberg, F. (1968) ‘One more time: how do you motivate employees?’, Harvard Business Review,
Vol. 46, No. 1, pp.53–62.
Hofstede, G. and Bond, M.H. (1988) ‘The Confucius connection: from cultural roots to economic growth’, Organizational Dynamics, Vol. 16, No. 4, pp.4–21.
Hsieh, A-H. and Tsai, C-W. (2008) ‘Does national culture really matter? Hotel service perceptions by Taiwan and American tourists’, International Journal of Culture, Tourism and Hospitality Research, Vol. 3, No. 1, pp.54–69.
Huang, A.H., Yen, D.C. and Zhang, X. (2008) ‘Exploring the potential effects of emoticons’, Information & Management, Vol. 45, No. 7, pp.466–473.
Ishihara, S., Tsuchiya, T., Nagamachi, M., Nishino, T. and Ishihara, K. (2005) ‘Catalytic effect of Kansei Engineering system at collaborative design process’, Paper presented at the 8th International Symposium on Human Factors in Organizational Design and Management, 22–25 June 2005, Maui, Hawaii, USA, North-Holland, pp.401–406.
Kano, K.H., Hinterhuber, H.H., Bailon, F. and Sauerwein, E. (1984) ‘How to delight your customers’, Journal of Product & Brand Management, Vol. 5, No. 2, pp.6–17.
Khalid, H.M. and Helander, M.G. (2006) ‘Customer emotional needs in product design’, Concurrent Engineering: Research and Applications, Vol. 14, No. 3, pp.197–206.
Ladhari, R. (2009) ‘Service quality, emotional satisfaction, and behavioral intentions: a study in the hotel industry’, Managing Service Quality, Vol. 19, No. 3, pp.308–331.
Liljander, V. and Strandvik, T. (1997) ‘Emotions in service satisfaction’, International Journal of Service Industry Management, Vol. 8, No. 2, pp.148–169.
Lin, I.Y. (2004) ‘Evaluating a servicescape: the effect of cognition and emotion’, Hospitality Management, Vol. 23, No. 2, pp.163–178.
Lovelock, C. and Wirtz, J. (2007) Services Marketing: People, Technology, Strategy, 6th ed., Pearson/Prentice Hall, New Jersey.
Lovelock, C.H. (1991) Services Marketing, 2nd ed., Prentice-Hall, Englewood Cliffs, New Jersey. Nagamachi, M. (1991) ‘An image technology expert system and its application to design
consultation’, International Journal of Human-Computer Interaction, Vol. 3, No. 3, pp.267–279.
Nagamachi, M. (1995) ‘Kansei engineering: a new ergonomic consumer-oriented technology for product development’, International Journal of Industrial Ergonomics, Vol. 15, No. 1, pp.3–11.
Nagamachi, M. (2002a) ‘Kansei engineering in consumer product design’, Ergonomics in Design – The Quarterly of Human Factors Applications, Vol. 10, No. 2, pp.5–9.
Nagamachi, M. and Lokman, A.M. (2011) Innovations of Kansei Engineering, CRC Press, Boca Raton.
Norman, D.A. (2004) Emotional Design: Why Do We Love (or Hate) Everyday Things, Basic Books, New York.
Nunnally, J.C. (1978) Psychometric Theory, 2nd ed., McGraw-Hill, New York.
Osgood, C.E., Suci, G.J. and Tannenbaum, P.H. (1957) The Measurement of Meaning, University of Illinois Press, Illinois.
Overby, J.W., Woodruff, R.B. and Gardial, S.F. (2005) ‘The influence of culture upon consumers’ desired value perceptions: a research agenda’, Marketing Theory, Vol. 5, No. 2, pp.139–163. Parasuraman, A., Berry, L.L. and Zeithaml, V.A. (1988) ‘SERVQUAL: a multiple-item scale for
measuring consumer perceptions of service quality’, Journal of Retailing, Vol. 64, No. 1, pp.12–40.
Pawitra, T.A. and Tan, K.C. (2003) ‘Tourist satisfaction in Singapore – a perspective from Indonesian tourists’, Managing Service Quality, Vol. 13, No. 5, pp.399–411.
ReVelle, J.B., Moran, J.W. and Cox, C.A. (1998) The QFD Handbook, John Wiley, New York. Ringle, C.M., Wende, S. and Will, A. (2005) Smart PLS, University of Hamburg, Hamburg. Schifferstein, H.N.J. and Hekkert, P. (2008) Product Experience, 1st ed., Elsevier Ltd., Oxford. Schütte, S., Eklund, J., Ishihara, S. and Nagamachi, M. (2008) ‘Affective meaning: the Kansei
engineering approach’, in Schifferstein, H.N.J. and Hekkert, P. (Eds.): Product Experience, pp.477–496, Elsevier Ltd., Oxford.
Shaw, C. and Ivens, J. (2002) Building Great Customer Experiences, Palgrave Macmillan, New York.
Shen, X.X., Tan, K.C. and Xie, M. (2000) ‘An integrated approach to innovative product development using Kano’s model and QFD’, European Journal of Innovation Management, Vol. 3, No. 2, pp.91–99.
Steinar, K. (2007) Doing Interviews, Sage Publications, London.
Sullivan, L.P. (1986) ‘Quality function deployment’, Quality Progress, Vol. 19, No. 6, pp.39–50. Taha, H.A. (1997) Operations Research: An Introduction, 6th ed., Prentice-Hall, New York. Tan, K.C. and Pawitra, T.A. (2001) ‘Integrating SERVQUAL and Kano’s model into QFD for
service excellent development’, Managing Service Quality, Vol. 11, No. 6, pp.418–430. Vargo, S.L. and Lusch, R.F. (2004) ‘The four service marketing myths-remnants of goods-based,
manufacturing model’, Journal of Service Research, Vol. 6, No. 4, pp.324–335.
Wong, A. (2004) ‘The role of emotional satisfaction in service encounters’, Managing Service Quality, Vol. 14, No. 5, pp.365–376.
Wu, H-H. and Shieh, J-I. (2006) ‘Using a Markov chain model in quality function deployment to analyze customer requirements’, International Journal of Advanced Manufacturing Technology, Vol. 30, Nos. 1–2, pp.141–146.