Summary In June 1993, net photosynthetic rates, stomatal conductance and isoprene emission rates of sweetgum leaves (Liquidambar styraciflua L.) were measured at the top of the forest canopy (sun leaves) and within the canopy at a height of 8--10 m above ground level (shade leaves). Large differences in net photosynthetic rates and stomatal conductance were found between sun and shade leaves. Mean rates of isoprene emission, expressed on a leaf area basis, were significantly lower in shade leaves than in sun leaves (4.1 versus 17.1 nmol m−2 s−1); however, because specific leaf area of sun leaves was lower than that of shade leaves (0.0121 versus 0.0334 m2 g−1), the difference between sun and shade leaves was less, though still significant, when isoprene emissions were expressed on a dry mass basis (45.5 versus 29.0 µg C g−1 h−1). Saturation of both net photosynthesis and isoprene emission occurred at lower PPFDs in shade leaves than in sun leaves. The effect of leaf temperature on isoprene emissions also differed between sun and shade leaves. Sun leaves lost a significantly greater percentage of fixed carbon as isoprene than shade leaves. The leaf-level physiological measurements were used to derive parameters for a canopy-level isoprene flux model. The impor-tance of incorporating differences between sun- and shade-leaf properties into existing models is discussed.
Keywords: canopy model, hydrocarbons, stomatal conduc-tance.
Introduction
Forests and the atmosphere exchange large amounts of gase-ous species. In addition to exchanges of CO2 and H2O vapor,
many volatile organic compounds (VOCs) are emitted by vegetation. Although VOC fluxes may be several orders of magnitude less than those of CO2 and H2O, VOCs are of
interest to atmospheric scientists because they play a crucial role in tropospheric chemistry.
The 10-carbon monoterpenes, such as the pinenes, play a biological role within the plant (Harborne 1988) and, in addi-tion, a fraction of the monoterpenes escape to the atmosphere where they participate in a variety of chemical reactions.
Isoprene (2-methyl-1,3-butadiene) is a 5-carbon molecule formed by the elimination of a phosphate group from di-methylallyl pyrophosphate (DMAPP), either in an acid-cata-lyzed (Deneris et al. 1985) or an enzyme-cataacid-cata-lyzed reaction (Silver and Fall 1991). Although DMAPP and its isomer, isopentenyl pyrophosphate (IPP), are the basic building blocks of many so-called isoprenoid compounds, including sterols, monoterpenes and carotenoids, isoprene itself plays no known biological role in plants, although recent evidence suggests it may contribute to thermal protection at high temperatures (Sharkey and Singsaas 1995). Isoprene, unlike monoterpenes, is not stored within the leaf, but emitted through the stomata immediately upon its production (Sharkey et al. 1991a, Hewitt and Street 1992, Guenther et al. 1994). In areas of high emis-sions, it is a principal reactant in the formation of tropospheric ozone (Trainer et al. 1987, Chameides et al. 1988). Because of its high reactivity, the atmospheric lifetime of isoprene is short, about one hour, but some of its oxidation products are longer lived and may be capable of affecting the global atmosphere (Fehsenfeld et al. 1992). Approximately 90% of non-methane hydrocarbon emissions are biogenic in origin (Singh and Zim-merman 1992), and their oxidation may contribute as much as 25% of the global source of carbon monoxide (Seiler and Conrad 1987).
An increased understanding of the physiological and bio-chemical controls over isoprene emission at the leaf level is needed so that we can refine existing regional and global isoprene emission models and improve our ability to predict source strengths of this important tropospheric constituent. We have, therefore, conducted a physiological and microme-teorological study of isoprene fluxes in a temperate forest in Atlanta, GA, USA, described elsewhere in this volume (Guen-ther et al. 1996). In June 1993, we made leaf-level physiologi-cal measurements on sun and shade leaves of sweetgum (Liquidambar styraciflua L.) to compare rates of isoprene emission and net photosynthesis, to determine how incident photosynthetic photon flux density (PPFD) and leaf tempera-ture affect isoprene emissions, and to derive parameters needed to drive a canopy-level isoprene flux model.
Effects of light, temperature and canopy position on net photosynthesis
and isoprene emission from sweetgum (
Liquidambar styraciflua
) leaves
P. HARLEY, A. GUENTHER and P. ZIMMERMAN
Atmospheric Chemistry Division, National Center for Atmospheric Research, P.O. Box 3000, Boulder, CO 80307, USA
Received March 16, 1995
Materials and methods
Site description
Physiological and micrometeorological measurements were made in the Fernbank Forest, a 26-ha mixed hardwood--conifer woodland in northeast Atlanta, GA. The forest is representative of the eastern deciduous biome, and is dominated by tulip poplar (Liriodendron tulipifera L.), oaks (Quercus spp.), hickories (Carya spp.), loblolly pine (Pinus taeda L.) and sweetgum (L. styraciflua). The forest has been largely uncut since 1820 and represents a mature remnant stand of Georgia Piedmont forest. A 44-m walk-up tower provided access to sun leaves of sweetgum at the top of the canopy (about 22 m above ground) and shade leaves within the canopy at approximately 8--10 m above ground. Leaf area index, which was measured near the tower with a plant canopy analyzer (Model LAI-2000, Li-Cor, Inc., Lincoln, NE), averaged 4.8.
Experimental techniques
Leaves were collected from the top of the canopy (22 m) (sun leaves) and from within the canopy at a height of 8--10 m above ground (shade leaves). Leaf-level net photosynthetic rates, stomatal conductance and rates of isoprene emission were measured in an open-path gas exchange system (MPH-1000, Campbell Scientific, Logan, UT), consisting of a temperature-controlled cuvette connected to a measurement and control system. Air of specified water vapor and CO2 concentration
was generated by mass flow controllers (Model 825, Edwards High Vacuum International, Wilmington, MA) and passed to the cuvette. The flow rate of gas entering the cuvette was measured with a mass flow meter (Model 831, Edwards). The difference in water vapor content of the air entering and leav-ing the cuvette was measured with two dew point mirrors (General Eastern, Watertown, MA), and the difference in CO2
concentration was determined by infrared gas analysis (Model 225 Mk3, Analytical Development Corp., Hoddesdon, UK). A portion of gas exiting the cuvette was diverted to a 2-ml sample loop of a portable, isothermal gas chromatograph, and isoprene was separated on a stainless steel column (1.3m long × 2mm id) packed with Unibeads 3S, 60--80 mesh (Alltech Assoc., Deerfield, IL). Isoprene eluting from the column was meas-ured with a reduction gas detector (Model RGD2, Trace Ana-lytical, Menlo Park, CA), and peak integration was accomplished by means of a commercial integrator (Model 3390, Hewlett-Packard, Avondale, PA). Details of this analyti-cal system are given in Greenberg et al. (1993). The isoprene detection system was calibrated several times daily against a standard cylinder containing 70 ppbv isoprene, referenced to an NIST propane standard using GC/FID (Model 5880A, Hewlett-Packard).
Artificial light was provided by a portable system consisting of a quartz halogen lamp (ELH 120V-300W, General Electric, Cleveland, OH) mounted in a slide projector lamp holder and directed at a Tempax cold mirror (Optical Coating Labs, Inc., Santa Rosa, CA) mounted at a 45° angle to reflect visible light
onto the cuvette. Neutral density filters of blackened window screen were inserted in the light path to vary the intensity.
When a new leaf was placed in the cuvette, a minimum of 30 min was allowed for equilibration, and all measurements were made after steady-state conditions were realized, as indi-cated by continuous real-time monitoring of CO2 and H2O
fluxes. Isoprene fluxes are based on the average isoprene concentration calculated from the final two or three measure-ments made under a given set of environmental conditions. When PPFD was varied, an equilibration time of 15 to 20 min was required; when the cuvette temperature was varied, the equilibration time was about 30 min.
Tracings of the portion of a leaf that was inside the cuvette were measured with a leaf area meter (CID, Moscow, ID). All experimental leaves were oven-dried at 60 °C for 48 h and weighed. Dried samples were assayed for total Kjeldahl nitro-gen (Jaeger and Monson 1992).
Results
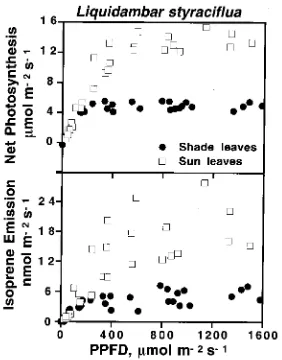
Although leaf morphology and physiology change in a con-tinuous manner as PPFD decreases with depth in a tree canopy, for simplicity, we have used the discrete terms ‘‘sun’’ and ‘‘shade’’ leaves to distinguish between leaves growing in more or less full sun at the top of the canopy and those found in deep shade within the canopy at a height of 10 m above ground. Rates of net photosynthesis and isoprene emission were higher in sun leaves than in shade leaves (Figure 1). The rates of both processes increased more or less linearly in the quantum yield region and leveled off as PPFD became saturating. The amount of PPFD required for rate saturation was substantially less for both processes in shade leaves than in sun leaves.
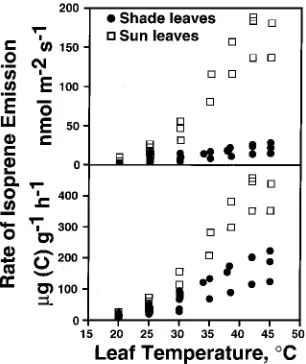
The rate of isoprene emission increased exponentially be-tween 20 and 35 °C, reached an optimum above 40 °C and subsequently declined (Figure 2). On a leaf area basis, sun leaves had higher rates of isoprene emission than shade leaves;
however, when isoprene emission rates were expressed on a leaf dry mass basis, differences between sun and shade leaves were reduced by about 60%, but sun leaves still emitted over 50% more isoprene than shade leaves (P = 0.01). This discrep-ancy was caused by the large differences in specific leaf area (SLA), which averaged 0.0121 m2 g−1 (SD = 0.0010, n = 20) at the top of the canopy (22 m), 0.0239 m2 g−1 (SD = 0.0025, n = 5) at 15 m and 0.0334 m2 g−1 (SD = 0.0032, n = 22) at 8--10 m above ground.
Leaf nitrogen, expressed per unit leaf area, also varied more than twofold with canopy position, averaging 0.55 g m−2 (SD = 0.11, n = 17) for shade leaves and 1.26 g m−2 (SD = 0.20, n = 15) for sun leaves. However, because SLA increased with decreasing PPFD, shade leaves contained more nitrogen (18.3
mg g−1, SD = 3.7) than sun leaves (15.2 mg g−1, SD = 2.2) on a dry mass basis.
Mean net photosynthetic rates, stomatal conductance and isoprene emission rates expressed on a leaf area basis were all significantly higher for sun leaves than for shade leaves (P = 0.01) (Table 1). However, when these parameters were ex-pressed on a dry mass basis, the differences between sun and shade leaves were reduced, and only isoprene emission rates remained significantly different (57% higher in sun leaves than in shade leaves). Rates of net photosynthesis and isoprene emission expressed per unit of leaf N were 29 and 83% greater, respectively, in sun leaves than in shade leaves (P = 0.01). The percentage of fixed carbon re-emitted as isoprene (assuming a loss of five carbon atoms for each molecule of isoprene emit-ted) was independent of the units of expression. At 25 °C, sun leaves lost an average of 53% more carbon than shade leaves (P = 0.01).
Modeling PPFD and leaf temperature effects on isoprene emission
Because the algorithms developed by Guenther et al. (1991, 1993) closely mimic the effects of PPFD and leaf temperature on isoprene emissions, we have used these functions to model our data. Before attempting to model the PPFD response of isoprene emission, Guenther et al. (1993) removed much of the leaf to leaf variation by normalizing their data, i.e., by assign-ing a value of 1.0 to the measured rate at PPFD = 1000 µmol m−2 s−1 and then adjusting the rest of the data proportionately, as we have done in Figure 3 using the raw data from Figure 1. Guenther et al. (1993) developed the following function to describe a light scaling factor, CL, which assumes a value of 1.0 at PPFD = 1000 µmol m−2 s−1:
CL = α CL1 PPFD
√1 +α2 PPFD2 , (1)
Table 1. Comparison of net photosynthesis, stomatal conductance and isoprene emission measured at 25 °C and PPFD of 1000 µmol m−2 s−1 for sun and shade leaves of sweetgum. Data are expressed on a leaf area, a leaf dry mass, or a leaf nitrogen basis. The percentage of fixed carbon emitted as isoprene, which is independent of the units of expression, is also shown. Values are means ± SD. Different letters following the means indicate significant differences (P = 0.01). Sample size was 15--17.
Leaf area Leaf dry mass Leaf nitrogen
Shade Sun Shade Sun Shade Sun
Net photosynthesis Units µmol CO2 m−2 s−1 µmol CO2 g−1(DM) s−1 µmol CO2 g−1(N) s−1
Mean 4.53 ± 1.16a 13.44 ± 1.39b 539 ± 123a 590 ± 97a 8.52 ± 2.73a 10.98 ± 2.35b
Ratio (sun/shade) 2.97 1.09 1.29
Stomatal conductance Units mmol H2O m−2 s−1 mmol H2O g−1 (DM) s−1
Mean 93 ± 30a 239 ± 43b 3.08 ± 0.95a 2.91 ± 0.62a --
--Ratio (sun/shade) 2.57 0.94
--Isoprene emission Units nmol Isoprene m−2 s−1 µg C g−1 s−1 nmol Isoprene g−1 (N) s−1
Mean 4.11 ± 2.52a 17.13 ± 3.85b 29.0 ± 16.5a 45.5 ± 13.9b 7.64 ± 4.79a 13.97 ± 4.04b
Ratio (sun/shade) 4.17 1.57 1.83
% C lost as isoprene Mean 0.42 ± 0.18a 0.64 ± 0.12b -- -- --
--Ratio (sun/shade) 1.53 --
where α determines the initial slope of the normalized re-sponse, and CL1 is the predicted normalized rate of emission
as PPFD → ∞. We used non-linear least squares regression to arrive at best fit values of α and CL1. When this function was
fitted to the normalized data for sun and shade leaves, we obtained the model fits shown in Figure 3.
Although the normalization procedure reduces variation in the PPFD-saturated rates of isoprene emission, it introduces a systematic difference in the initial slope of the normalized response. This is because the raw emission rates of sun leaves, which on average have a higher rate of emission at PPFD = 1000 µmol m−2 s−1 than shade leaves, are divided by a larger number than that used for the shade leaf data, and this de-presses the initial slope of the normalized response in Figure 3. Therefore, the apparent difference in initial slope should not be taken as evidence of a difference in the quantum use efficiency of isoprene production between sun and shade leaves.
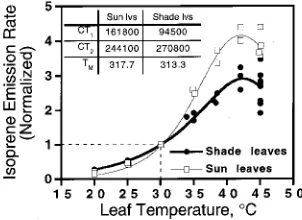
To compare the temperature response of sun leaves versus shade leaves, we normalized the data in Figure 2, following Guenther et al. (1991). For each curve obtained from a given leaf, we assigned a value of 1.0 to the measured value at 30 °C and PPFD = 1000 µmol m−2 s−1, and scaled other data propor-tionately. These normalized data (Figure 4) revealed large differences in the shape of the temperature responses of sun and shade leaves. By means of non-linear least squares regres-sion, we fitted the normalized temperature data for sun and shade leaves to the temperature algorithm developed by Guen-ther et al. (1991, 1993), which defines a temperature scaling factor (CT) and assumes a value of 1.0 at temperature Ts
(30 °C):
CT = e CT1(Tk−Ts)
RTsTk
1 + e
CT2(Tk−TM) RTsTk
,
(2)
where Tk is leaf temperature (K), Ts is the leaf temperature to
which raw data are normalized (303.2 K), R is the gas constant (8.314 J K−1 mol−1), CT1 and CT2 are the activation energy and
energy of deactivation, respectively (J mol−1), and TM is an
empirical coefficient (K). The solid lines in Figure 4 represent
fits of this function to the data based on the normalized pa-rameter values. We used these functions to calculate the Q10 for
isoprene emission. Between 15 and 25 °C, the Q10 values for
sun and shade leaves were 9.6 and 3.7, respectively, and be-tween 25 and 35 °C, the values were 7.0 and 3.3, respectively. The lower Q10 values for shade leaves agree well with the
values reported by Guenther et al. (1993) based on measure-ments from a variety of species, including sweetgum, although the temperature optimum in the current study was several degrees higher. However, the Q10 values for sun leaves were
much higher than the values reported by Guenther et al. (1993), possibly because all the leaves used in their analysis were from plants grown in a growth chamber or greenhouse where light intensities were low relative to the full sun conditions experi-enced by the sun leaves in our study. The Q10 values for
sweetgum sun leaves were more similar to the high Q10 values
obtained by Sharkey and Loreto (1993) for isoprene emission in leaves of kudzu (Pueraria lobata C.K. Schneid.).
Discussion
Variation between sun and shade leaves
Sun leaves had higher rates of physiological activity than shade leaves when activity was expressed on a leaf area basis (Figures 1 and 2, Table 1). Net photosynthetic rates, stomatal conductance and rates of isoprene emission were all greater in sun leaves than in shade leaves by a factor of about 3, 2.5 and 4, respectively. Similar results have been reported for aspen (Populus tremuloides Michx.) and red oak (Quercus rubra L.) (Sharkey et al. 1991b). However, the differences between sun and shade leaves were greatly reduced when values were expressed on a leaf dry mass basis, because SLA increased with depth in the canopy (Table 1), reflecting leaf acclimation to reduced irradiance (Boardman 1977).
Differences between sun and shade leaves in leaf area based rates of photosynthesis and isoprene emission may be partially explained by the higher unit area N content of sun leaves than of shade leaves. However, N allocation alone cannot explain these differences, because isoprene emission rates expressed on a unit N basis were 80% higher in sun leaves than in shade Figure 3. Effects of incident PPFD on isoprene emission in sun and
shade leaves of sweetgum. Emission rates have been normalized to a value of 1.0 at a PPFD of 1000 µmol m−2 s−1. Leaf temperature was 25 °C. The solid lines were fitted with Equation 1, using the parameter values shown.
leaves (14.0 versus 7.6 nmol g−1 N s−1). To the extent that isoprene emission rate is controlled by the activity of isoprene synthase, this result suggests that leaves growing in high light devote a higher proportion of their leaf N to isoprene synthase. This is consistent with the finding that, in velvet beans, for a given light treatment, isoprene emission showed a strong posi-tive correlation with percent leaf N (Harley et al. 1994).
The percentage of carbon fixed in photosynthesis and imme-diately re-emitted as isoprene was 53% greater in sun leaves than in shade leaves at 25 °C (Table 1). The percentage of carbon lost as isoprene increased with temperature for both sun and shade leaves (Figure 5); however, the disparity between sun and shade leaves increased with increasing temperature (Figure 4).
Modeling at different scales
At the individual leaf scale, isoprene emission responds to variation in PPFD and temperature in a well characterized and easily modeled fashion; however, our ability to model isoprene emission from forest stands is limited primarily by our ability to model the light and temperature environment to which leaves are exposed, and our ability to determine the distribu-tion of isoprene emitting biomass within a forest stand. Light interception in canopy models is best handled on a leaf area basis. If we express isoprene emission on a leaf-area basis, we need to incorporate the fourfold difference in emission rate between leaves at the top and at the bottom of the canopy into a multilayer canopy-level model. Alternatively, if we express isoprene emission rates per unit dry mass, the difference in isoprene emission rate between sun and shade leaves is re-duced to less than a factor of two; however, we then need to incorporate systematic changes in SLA within the canopy into the model to allow conversion from mass-based leaf-scale emissions to ground-area-based canopy flux predictions. We investigated the potential significance of variations in both SLA and isoprene emission characteristics with depth in the canopy using a simple three-layer, canopy light interception model.
Early estimates of regional-scale isoprene fluxes did not take account of canopy light interception processes; instead light-dependent processes were driven by incident PPFD
(Zimmerman 1979). However, it was soon realized that to model strongly light-dependent processes such as isoprene emission, it is necessary to take account of canopy light inter-ception processes to avoid overestimation of fluxes. Accord-ingly, models were developed that incorporated multilayer canopy models, which calculated light extinction, and use calculated PPFD values to drive isoprene emission at different canopy depths (Pierce et al. 1991, Lamb et al. 1993). Geron et al. (1994) investigated the effects of leaf biomass distribution within a given canopy on model flux estimates and found that, given a typical distribution of SLA for deciduous forest cano-pies (Jurik 1986), a disproportionate share of isoprene emitting biomass occurs in the upper canopy layers where PPFD is higher. As a result, model flux estimates increased by about 10% if SLA was allowed to vary in a realistic fashion.
We tested the effects of varying leaf biomass within a sweet-gum canopy on model estimates of isoprene flux. We used the canopy radiation transfer model developed by Norman (1982), as modified by Guenther et al. (1995), to estimate global emissions of natural VOCs. Leaf area index was assumed to be 6, and the canopy was divided into three layers of equal LAI. The sunlit and shaded leaf fraction in each layer was calcu-lated, assuming a solar elevation of 60° and average leaf angle of 60°, and the average PPFD incident on sunlit and shaded leaves in each layer was also calculated (Guenther et al. 1995). Initially, leaves in the top, middle and bottom canopy layers were assigned SLA values of 0.012, 0.024 and 0.033 m2 g−1,
respectively. Total leaf biomass was thus 312 g m−2 ground area (LAI = 6 and three canopy layers). We assigned a base isoprene emission rate (at 30 °C and PPFD = 1000 µmol m−2 s−1) to the top (109 µg C g−1 h−1) and bottom canopy layers (56 µg C g−1 h−1), and a value of 82 µg C g−1 h−1 to the middle layer. Assuming PPFD = 2000 µmol m−2 s−1 above the canopy
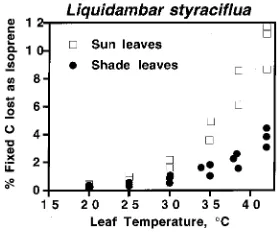
Figure 5. The percentage of fixed carbon lost immediately as isoprene by sun and shade leaves of sweetgum as a function of leaf temperature. Values were calculated on the assumption that five carbon atoms are lost per isoprene molecule emitted.
and a uniform leaf temperature of 30 °C, the model, incorpo-rating the light algorithms in Figure 3, predicted a canopy flux of 18.9 mg C m−2 h−1, with over 75% of the emissions origi-nating in the top third of the canopy (Figure 6, bottom). When we replaced the measured values of SLA and isoprene emis-sion characteristics with average values of 0.019 m2 g−1 and 82 µg C g−1 h−1, respectively, isoprene emissions were more evenly distributed through the canopy (Figure 6, top) and overall emissions declined by 29%. If SLA was held constant while isoprene emission potential was allowed to vary, canopy emissions were reduced by 21%, whereas if isoprene emission potential was held constant while SLA was allowed to vary, canopy emissions were reduced by 17% (Table 2).
Our canopy model does not incorporate an energy budget routine to calculate leaf temperature, but assumes that leaf and air temperatures are equal. However, given the strong tempera-ture dependency of isoprene emission, especially for sun leaves, and the likelihood that leaf temperature may differ from air temperature by several degrees (Gates 1968), it may be important to calculate average leaf temperatures for sun and shade leaves in each canopy layer.
Potential carbon losses due to isoprene emission
Sharkey et al. (1991a) used 13CO2 to demonstrate that isoprene
is produced from recently fixed carbon, and that the isoprene precursor pool is small and is flushed within 10 min in oak leaves. Thus, some fraction of fixed carbon is lost almost immediately in isoprene-emitting species. In the short term, the percentage of carbon lost varies from near zero to over 20% (Sharkey et al. 1991a), depending on environmental condi-tions. In sweetgum, the average loss of carbon at 25 °C and high PPFD was about 0.5% (Table 1), which is probably not of great significance to the plant (Lambers and Poorter 1992). However, as a result of the large differences in the temperature dependences of net photosynthesis and isoprene emission, the percentage of fixed carbon lost due to isoprene emissions increased dramatically with increasing leaf temperature (Fig-ure 5). Thus, during midsummer when leaf temperat(Fig-ures reach 35 °C, losses may reach 1--2% for shade leaves and 3--5% for sun leaves.
In addition to the short-term effects of leaf temperature, the percentage of carbon lost also varies over time, because the capacity for photosynthesis and isoprene production follow different developmental paths. Early in the growing season, the onset of isoprene production lags behind photosynthesis in leaves of velvet bean (Grinspoon et al. 1991), Eucalyptus globulus Labill. (Guenther et al. 1991) and aspen (Populus tremuloides Michx.) (Monson et al. 1994), and during this growth phase, volatile carbon losses are very small. In mature leaves, isoprene production may remain high after photosyn-thetic competence has begun to decline with leaf aging (un-published data of Jaeger and Monson, cited in Fehsenfeld et al. 1992), resulting in increased carbon losses (as a percentage of carbon fixed) during senescense. We have preliminary evi-dence that, in Quercus stellata Wangenh., Mahonia trifoliata Moric. and Condalia obovata Hook., photosynthesis is more sensitive than isoprene production to increasing water stress (authors’ unpublished observations). Similar findings have been reported for container-grown sweetgum subjected to re-peated cycles of short-term drought (C. Fang, R.K. Monson and E.B. Cowling, unpublished observations). Although sto-matal closure has little direct effect on isoprene emission rates (Fall and Monson 1992), drought-induced stomatal closure could have a large indirect effect on isoprene emission rates by increasing leaf temperature.
Thus, instantaneous losses of fixed C due to isoprene emis-sion may exceed 10--20% under conditions of high tempera-ture or drought. Integrated over the longer term, however, losses will be much less. In the most recent estimate of annual global scale isoprene and monoterpene emissions, isoprene volatilization is equivalent to about 1.3% of annual net primary productivity (NPP) (Guenther et al. 1995). Furthermore, if other less reactive compounds volatilized from leaves, such as methanol (MacDonald and Fall 1992, Nemecek-Marshall et al. 1995), and other alcohols and aldehydes are included in the global estimates, total global carbon losses may be as great as 2.4% of NPP (Guenther et al. 1995), and for ecosystems in warm, highly productive regions, such as tropical forests, the predicted losses exceed 4% of NPP. These estimates assume that only about 25% of the tree biomass in a given region is composed of species with high isoprene emission rates. In monospecific stands of forest plantation species which are known to be high emitters of isoprene, such as Populus and Eucalyptus spp., predicted losses exceed 8--10% of NPP.
All of the above calculations are based on the assumption that the carbon cost of producing and emitting a single mole-cule of isoprene (C5H8) is five; however, Sharkey et al. (1991a)
have pointed out that an additional CO2 molecule is lost in the
production of each of the three molecules of acetyl CoA necessary for the formation of IPP, the precursor of isoprene and the monoterpenes, and a fourth CO2 molecule is lost in the
final conversion of mevalonic acid to IPP, bringing the total carbon cost to nine for each isoprene produced. In determining the true carbon cost to the plant of VOC emissions, therefore, these hidden carbon costs must be taken into account.
In summary, despite large uncertainties in current estimates, it appears that losses of volatile carbon may be significant for Table 2. Predictions of isoprene emissions from a sweetgum canopy
according to a three-layer canopy model, assuming an LAI of 6, leaf biomass of 312 g m−2 (ground area), leaf temperature of 30 °C and PPFD of 2000 µmol m−2 s−1. The model assesses the consequences for canopy isoprene emission of assuming constant or variable SLA (0.012, 0.024 and 0.033 m2 gDW−1 for the top, middle and bottom of
the canopy, respectively), and constant or variable isoprene emission rates (109, 82 and 56 µg C g−1 h−1 for the top, middle and bottom of the canopy, respectively).
SLA Isoprene emission Canopy isoprene emission mg C m−2 h−1
Variable Variable 18.94
Uniform Variable 14.90
Variable Uniform 15.79
species with inherently high rates of VOC emissions, and in areas experiencing warm growing seasons. Although experi-mental evidence is lacking, Field et al. (1992) suggest that projected increases in CO2 may lead to increased production
and presumably emission of carbon-based secondary com-pounds such as monoterpenes. Furthermore, if average tem-peratures in a region increase, or if a region is subject to higher temperature extremes, rates of volatilization of isoprene, monoterpenes and presumably other VOCs are likely to in-crease in parallel.
Acknowledgments
The authors thank Dr. Russ Monson for analyzing leaf nitrogen sam-ples, Dr. Lee Klinger for LAI measurements, Dr. Jim Greenberg for analytical support, and all for helpful comments on the manuscript. This research was supported in part by the U.S. Environmental Protec-tion Agency (Interagency Agreement DW49935389-01-0), and the Southern Oxidants Study (Southern Oxidants Research Program on Emissions and Effects). The National Center for Atmospheric Re-search is sponsored by the National Science Foundation.
References
Boardman, N.K. 1977. Comparative photosynthesis of sun and shade plants. Annu. Rev. Plant Physiol. 28:355--377.
Chameides, W., R. Lindsay, J. Richardson and C. Kiang. 1988. The role of biogenic hydrocarbons in urban photochemical smog: At-lanta as a case study. Science 241:1473--1475.
Deneris, E.S., R.A. Stein and J.F. Mean. 1985. Acid-catalyzed forma-tion of isoprene from a mevalonate-derived product using a rat liver cytosol fraction. J. Biol. Chem. 260:1382--1385.
Fall, R. and R.K. Monson. 1992. Isoprene emission rate and intercel-lular isoprene concentration as influenced by stomatal distribution and conductance. Plant Physiol. 100:987--992.
Fehsenfeld, F., J. Calvert, R. Fall, P. Goldan, A.B. Guenther, C.N. Hewitt, B. Lamb, S. Liu, M. Trainer, H. Westberg and P. Zimmer-man. 1992. Emissions of volatile organic compounds from vegeta-tion and the implicavegeta-tions for atmospheric chemistry. Global Biogeochem. Cycles 6:390--430.
Field, C.B., F.S. Chapin, P.A. Matson and H.A. Mooney. 1992. Re-sponses of terrestrial ecosystems to the changing atmosphere: a resource-based approach. Annu. Rev. Ecol. Syst. 23:201--235. Gates, D.M. 1968. Transpiration and leaf temperature. Annu. Rev.
Plant Physiol. 19:211--238.
Geron, C.D., A.B. Guenther and T.E. Pierce. 1994. An improved model for estimating emissions of volatile organic compounds from forests in the eastern United States. J. Geophys. Res. 99:12773--12791.
Greenberg, J.P., P.R. Zimmerman, B.E. Taylor, G.M. Silver and R. Fall. 1993. Subparts per billion detection of isoprene using a reduc-tion gas detector with a portable gas chromatograph. Atmos. Envi-ron. 27A:2689--2692.
Grinspoon, J., W. Bowman and R. Fall. 1991. Delayed onset of isoprene emission in developing velvet bean (Mucuna sp.) leaves. Plant Physiol. 97:170--174.
Guenther, A., R. Monson and R. Fall. 1991. Isoprene and monoterpene emission rate variability: observations with eucalyptus and emis-sion rate algorithm development. J. Geophys. Res. 96:10799--10808.
Guenther, A., P. Zimmerman, P. Harley, R. Monson and R. Fall. 1993. Isoprene and monoterpene emission rate variability: model evalu-ation and sensitivity analysis. J. Geophys. Res. 98:12609--12617.
Guenther, A., P. Zimmerman and M. Wildermuth. 1994. Natural vola-tile organic compound emission rate estimates for U.S. woodland landscapes. Atmos. Environ. 28:1197--1210.
Guenther, A., C.N. Hewitt, D. Erickson, R. Fall, C. Geron, T. Graedel, P. Harley, L. Klinger, M. Lerdau, W.A. McKay, T. Pierce, B. Scholes, R. Steinbrecher, R. Tallamraju, J. Taylor and P. Zimmer-man. 1995. A global model of natural volatile organic compound emissions. J. Geophys. Res. 100:8873--8892.
Guenther, A., J. Greenberg, P. Harley, D. Helmig, L. Klinger, L. Vierling, P. Zimmerman and C. Geron. 1996. Leaf, stand and landscape scale measurements of volatile organic compound fluxes. Tree Physiol. 16:17−24.
Harborne, J.B. 1988. Introduction to ecological biochemistry. Aca-demic Press, London, 356 p.
Harley, P.C., M.E. Litvak, T.D. Sharkey and R.K. Monson. 1994. Isoprene emission from velvet bean leaves. Interactions among nitrogen availability, growth photon flux density, and leaf develop-ment. Plant Physiol. 105:279--285.
Hewitt, C.N. and R.A. Street. 1992. A qualitative assessment of the emission of non-methane hydrocarbon compounds from the bio-sphere to the atmobio-sphere in the U.K.: present knowledge and uncertainties. Atmos. Environ. 26A:3069--3077.
Jaeger, C.H. and R.K. Monson. 1992. The adaptive significance of nitrogen storage in Bistorta bistortoides, an alpine herb. Oecologia 92:578--585.
Jurik, T.W. 1986. Temporal and spatial patterns of specific leaf weight in successional northern hardwood tree species. Am. J. Bot. 73:1083--1092.
Lamb, B., D. Gay and H. Westberg. 1993. A biogenic hydrocarbon emission inventory for the USA using a simple forest canopy model. Atmos. Environ. 27A:1673--1690.
Lambers, H. and H. Poorter. 1992. Inherent variation in growth rate between higher plants: a search for physiological causes and eco-logical consequences. In Advances in Ecological Research. Eds. M. Begon and A.H. Fitter. Academic Press, London, pp 187--240. MacDonald, R.C. and R. Fall. 1992. Detection of substantial
emis-sions of methanol from plants to the atmosphere. Atmos. Environ. 27:1709--1713
Monson, R.K., P.C. Harley, M.E. Litvak, M. Wildermuth, A.B. Guen-ther, P.R. Zimmerman and R. Fall. 1994. Environmental and devel-opmental controls over the seasonal pattern of isoprene emission from aspen leaves. Oecologia 99:260--270.
Nemecek-Marshall, M., R.C. MacDonald and R. Fall. 1995. Methanol emission from leaves. Enzymatic detection of gas-phase methanol and relation of methanol fluxes to stomatal conductance and leaf development. Plant Physiol. 108:1359--1368.
Norman, J. 1982. Simulation of microclimates. In Biometeorology in Integrated Pest Management. Eds. J.L. Hatfield and I.J. Thomason. Academic Press, New York, pp 65--99.
Pierce, T.E. and P.S. Waldruff. 1991. PC-BEIS: A personal computer version of the biogenic emissions inventory system. J. Air Waste Manage. Assoc. 41:937--941.
Seiler, W. and R. Conrad. 1987. Contribution of tropical ecosystems to the global budget of trace gases, especially CH4, H2, CO, and N2. In The Geophysiology of Amazonia. Ed. R.E. Dickinson. John Wiley, New York, pp 133--160.
Sharkey, T.D. and F. Loreto. 1993. Water stress, temperature, and light effects on the capacity for isoprene emission and photosynthesis of kudzu leaves. Oecologia 95:328--333.
Sharkey, T.D., F. Loreto and C.F. Delwiche. 1991b. High carbon dioxide and sun/shade effects on isoprene emission from oak and aspen tree leaves. Plant Cell Environ. 14:333--338.
Sharkey, T.D. and E.L. Singsaas. 1995. Why plants emit isoprene. Nature 374: 769.
Silver, G. and R. Fall. 1991. Enzymatic synthesis of isoprene from dimethylallyl diphosphate in aspen leaf extracts. Plant Physiol. 97:1588--1591.
Singh, H.B. and P.B. Zimmerman. 1992. Atmospheric distribution and sources of nonmethane hydrocarbons. In Gaseous Pollutants: Char-acterisation and Cycling. Ed. J.O.Nriagu. John Wiley, New York, pp 177--235.
Trainer, M., E. Williams, D. Parrish, M. Buhr, E. Allwine, H. West-berg, F. Fehsenfeld and S. Lui. 1987. Models and observations of the impact of natural hydrocarbons on rural ozone. Nature 329:705-707.