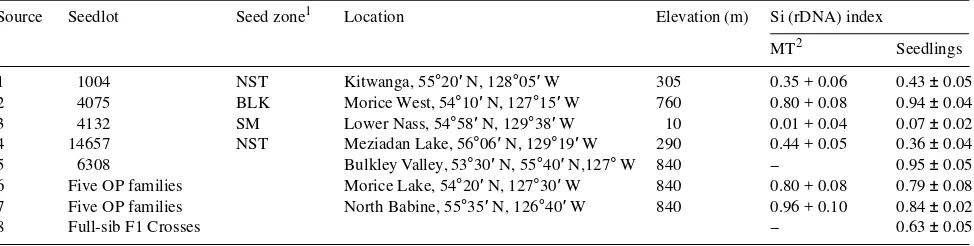
Summary Eight populations of Sitka spruce (Picea sitchen-sis (Bong.) Carr.) and interior spruce (Picea glauca (Moench) Voss × Picea engelmannii Parry ex. Engelm.) seedlings were sampled from a zone of Sitka--interior spruce introgression in British Columbia, Canada. Restriction fragment length poly-morphisms of the nuclear ribosomal RNA genes (rDNA) were used to define species-specific hybridization patterns for the Sitka spruce and interior spruce populations. Hybridization was estimated from an index based on the relative abundance of polymorphic rDNA combining bands for each population. Sitka × interior hybrid seedlings had an index value for the relative abundance of interior spruce rDNA (Si-rDNA) ranging from 0.07 (Lower Nass; the most westerly collected source) to 0.95 (Bulkley Valley low-elevation seed orchard). During shoot elongation, osmotic potential at saturation (Ψsat) and turgor loss
point (Ψtlp) increased, whereas total turgor (ΨPTotal) decreased.
After bud set in the summer and throughout the fall, Ψsat and
Ψtlp decreased, whereas ΨPTotal increased. At all times of year,
populations with a higher Si-rDNA index had lower Ψtlp and
Ψsat and higher ΨPTotal than populations with a lower Si-rDNA
index. During the fall, Sitka × interior hybrid seedlings exhib-ited a seasonal decline in the temperature causing 50% needle electrolyte leakage (LT50) and in the critical temperature
indi-cating the initial point of freezing injury. Seedlings with a higher Si-rDNA index had lower LT50 and critical temperature
values indicating greater freezing tolerance in the fall. Throughout most of the year, seedling population Si-rDNA index was related to the degree of drought and freezing toler-ance.
Keywords: freezing tolerance, nuclear DNA markers, Picea engelmannii, Picea glauca, Picea sitchensis, water relations parameters.
Introduction
Introgression zones are areas where tree species mix genes through repeated crossing and back crossing. The Nass Skeena Transition in British Columbia, Canada, is a zone where intro-gressive hybridization occurs between Sitka spruce (Picea sitchensis (Bong.) Carr.) and interior spruce (Picea glauca
(Moench) Voss ×Picea engelmannii Parry ex. Engelm.) (Little 1953, Daubenmire 1968, Roche 1969). Sitka spruce occurs naturally in wet, maritime climates that do not experience extreme winter freezing conditions, whereas white spruce and Engelmann spruce grow in continental areas that experience summer droughts and severe winters (Burns and Honkala 1990). The exact extent of the introgression zone between these species is unclear and there is little information on representative genotypes. There are risks associated with using seed from the Sitka × interior transition zone that has unknown genetic characterization because this might result in progeny being planted off site, thereby resulting in poor survival or growth.
Yeh and Arnott (1986) examined spruce introgression by comparing isozyme alleles with morphological characteristics to calculate genetic distance between seedlots. Recently, DNA markers have been used to identify polymorphisms within a given taxon (Wagner 1992) and to identify distinct populations that occur within introgression zones. Use of chloroplast DNA to estimate species components of Sitka and interior spruce hybrid seedlots gave good agreement with growth patterns and seedling morphological development (Sutton et al. 1991a). In addition, restriction fragment length polymorphisms (RFLP) of nuclear ribosomal RNA genes (rDNA) have identified spe-cies-specific hybridization patterns for Sitka and interior spruce populations (Sutton et al. 1994). Intermediate rDNA patterns between these two species were found in their intro-gression zone and were used to generate an index that repre-sents the contribution of each species to the nuclear genome (Sutton et al. 1994).
Successful reforestation of the Nass Skeena Transition would be facilitated by use of seedlings with appropriate adaptive traits. Not only do populations need to be identified, but information is also needed on how the rDNA index relates to seasonal physiological patterns of Sitka × interior geno-types. There have been few attempts to use genetic markers as indicators of physiological patterns in conifers (Mitton 1995); however, the use of genetic markers that are related to physi-ological traits that respond to environmental factors could provide an opportunity to improve the matching of genotypes
Relationship between nuclear DNA markers and physiological
parameters in Sitka
×
interior spruce populations
STEVEN C. GROSSNICKLE, BEN C. S. SUTTON, RAYMUND S. FOLK and
ROBERT J. GAWLEY
Forest Biotechnology Centre, B.C. Research Inc., 3650 Wesbrook Mall, Vancouver, B.C. V6S 2L2, Canada
Received March 7, 1995
to site conditions. Although tightly linked RFLP markers are used in marker-aided selection (Tauer et al. 1992) in advanced breeding programs, these markers are not suitable for discrimi-nating among a wide range of populations. For this purpose, genetic markers are needed that provide a rapid measure of population differences in physiological traits.
We have assessed the ability of DNA analysis to characterize seasonal physiological profiles of Sitka × interior spruce hy-brids collected from sites in the Nass Skeena Transition zone. The specific objectives of the study were to: (1) characterize a range of Sitka × interior spruce hybrid populations by DNA analysis, (2) characterize the seasonal drought and freezing tolerance profiles of these populations, and (3) examine the relationship between DNA analysis and the seasonal drought and freezing tolerance profiles.
Materials and methods Plant material
Eight seed sources were obtained from locations across the Nass Skeena Transition in British Columbia, Canada (Table 1; a map identifying collection sites is given in Sutton et al. 1994). Four seed sources were from wild seed collections (1004, 4075, 4132 and 14657) in three seed zones. One seed source was an operational seedlot pooled from the entire Bulk-ley ValBulk-ley seed orchard (Seedlot 6308). Two seed sources were from open-pollinated families in the Bulkley Valley seed or-chard (each seedlot was pooled in groups of five families based on the locations of original parent trees). One seed source came from a pool of six crosses between interior and Sitka spruce sources. One seed source comprised full-sib F1 crosses derived from crosses between selected interior spruce parent trees from Prince George (PG) combined with Sitka spruce from the Queen Charlotte Islands (QCI) or Vancouver Island (VI) (i.e., PG4 × VI187, PG21 × VI130, PG135 × QCI266, PG4 × QCI242, PG135 × VI161, PG42 × VI58).
Sitka × interior spruce seedlings were grown in 615 Styro-block containers under an intensive nursery culture from March until September 1992 at the Saanich Nursery Facility, B.C. Ministry of Forests, British Columbia (48°28′ N, 124°10′ W). All seedlings had set bud by mid-September and populations ranged in height from 47.9 ± 1.2 to 36.9 ± 1.3 cm, and diameter from 7.8 ± 0.2 to 6.9 ± 0.2 mm. After bud set, seedlings were maintained outdoors to acclimate to fall envi-ronmental conditions.
Field site
Seedlings were planted in mid-November 1992 at the Plant Sciences Field Reseach Facility, University of British Colum-bia (49°15′ N, 123°15′ W, 25 m elev.). The field site has a homogeneous cultivated sandy loam soil. Seedlings were planted at a 1.0 × 1.0 m spacing with ten rows per seed source randomly located across the site, with 15 seedlings per row. Within each row, seedlings used for drought tolerance meas-urements were randomly selected from each seed source popu-lation and planted in 11-liter plastic containers that were then buried within each row. Seedlings used for freezing tolerance
measurements were randomly selected from each seed source population and tagged. Site environmental conditions were monitored daily throughout the study. Fall mean daily air temperatures were calculated for periods between freezing tolerance tests. Precipitation was not recorded on site, though a nearby (5 km) Environment Canada weather station reported typically high amounts of precipitation from January through June, moderate amounts from July through September, and high amounts from October through December. Vegetation around the seedlings was cut on a regular basis to remove aboveground competition.
Sampling procedure
Bud break, shoot elongation and bud set patterns were moni-tored during the growing season. Because of seedling size, physiological measurements and DNA analysis were taken from two separate samplings of the same population. Eighteen seedlings from each seed source were repeatedly measured for seasonal physiological patterns. At each drought tolerance sampling, measurements alternated between two sample groups, each of six seedlings per seed source. Fall--early winter freezing tolerance patterns were measured on a third group of six seedlings from each seed source. From the test population used for physiological measurements, DNA analysis was con-ducted on 12 randomly selected seedlings from each seed source.
DNA Analysis
Each DNA analysis was made on three buds from each selected seedling as described by Sutton et al. (1994). The DNA was extracted by digestion with restriction enzyme, HindIII, fol-lowed by electrophoresis and Southern blotting. Hybridization was carried out with yeast 18S rRNA gene. Autoradiograms obtained with the 18S rRNA gene probe were quantified by image analysis. For each individual, the total optical density (OD) for each band was recorded relative to total OD in the lane (to correct for differences in DNA loading) and then compared to the relative intensities of the bands in pure interior or pure Sitka spruce populations as determined by Sutton et al. (1994). A maximum of five bands was observed in the interior spruce species, two of which were absent in Sitka spruce. For pure interior spruce, optical densities (i.e., %OD per band) of bands one through five were: 2.70 ± 1.72, 55.87 ± 5.30, 13.78 ± 2.10, 5.82 ± 1.30, and 21.92 ± 1.99, respectively. For pure Sitka spruce, optical densities of bands one through five were: 39.82 ± 2.46, 16.54 ± 2.87, 43.66 ± 1.97, 0, and 0, respectively. The average of the ratios for all five bands per tree was used to calculate an index of interior spruce (Si) rDNA in the nuclear genome from the equation: Si-rDNA Index = Σ((%ODx − %ODSs)/(%ODSi − %ODSs))/5, where %OD is the relative band
Drought tolerance
Pressure-volume data were collected as described by Gross-nickle (1989). Seedlings in 11-liter containers were removed from the field and rehydrated in the dark at 22 °C in a control-led environment. After 14 h in the dark, lateral shoots were removed from the potted seedlings and their saturated weight measured. The seedlings were returned to the field, within 24 h of being sampled, and placed in their original location. Pres-sure-volume curves were determined by periodic measure-ments of shoot mass and water potential. Between measurements, shoots transpired in a controlled environment room (air temperature = 22 °C, relative humidity = 50% and PFD = 300 µmol m−2 s−1). Dry weights of shoots were
meas-ured after oven drying at 65 °C for 48 h. Shoots consisted of one-year-old needles for pressure-volume analysis in Febru-ary, one-year-old and current-year needles in March and April, and current-year needles from May through November. Data were collected at 4- to 8-week intervals from February through November.
Pressure-volume curves were used to determine osmotic potential at saturation (Ψsat) and turgor loss point (Ψtlp) and
relative water content at turgor loss point (RWCtlp) as outlined
by Schulte and Hinckley (1985). Höfler diagrams were used to determine total turgor (ΨPTotal, MPa) (Roberts and Knoerr
1977, Grossnickle 1988, Colombo and Teng 1992).
Freezing tolerance
Freezing tolerance of needles was monitored every two weeks from September until mid-December. At each sampling, need-les were removed from three branches on the middle third of the stem and subjected to a freeze-induced electrolyte leakage (FIEL) procedure (Burr et al. 1990). Needles from each seed-ling were cut at both ends into 0.5 cm lengths, washed in deionized water and transferred, in random groups of 24, to glass culture tubes containing 0.5 ml of deionized water. One tube from each seedling was stoppered and placed in ice water as a control at 1 °C. Four tubes from each seedling were placed in an ethanol bath at −2 °C (Forma Scientific MC-8-80). Water in all tubes in the ethanol bath was nucleated simultaneously with ice crystals after 0.5 h, and tubes were stoppered. The ethanol bath was then cooled at 5 °C h−1.
Four temperatures were selected to bracket the anticipated 50% tissue electrolyte leakage value. When one of the selected temperatures was reached, a tube for each seedling was re-moved and the contents were allowed to thaw in ice water. After the contents of all tubes had thawed, 5.5 ml of deionized water was added to each tube. Tubes were then stoppered and placed on a 100-rpm shaker at 24 °C for 20--24 h. Conductivity of the solution in each tube was measured after incubation. Tubes were then placed in a 90 °C water bath for 15 min to induce maximum tissue injury and conductivity was remeas-ured after an additional 20 h on a 100-rpm shaker at 24 °C.
Measured FIEL values were converted to an index of injury (II) (Dexter et al. 1930, Flint et al. 1967, Burr et al. 1990):
II = 1 −(T1/T2) 1 −(C1/C2)
100,
where T1 and T2 are the conductivity of treatment tubes after
freezing and after boiling, respectively, and C1 and C2 are the
conductivity of control tubes before and after boiling, respec-tively. Temperatures at which 50% needle electrolyte leakage occurred (i.e., LT50), were calculated from a linear regression
model for each seedling.
For each measurement period, a critical temperature, de-fined as the highest temperature at which freezing injury can be detected, was determined for each Sitka × interior spruce population by a modification of the procedures described by DeHayes and Williams (1989). On each measurement date, a one-way analysis of variance was conducted for each Sitka × interior spruce population (n = 6); the ANOVA table included a relative conductivity value for each temperature and an error term with 4 and 25 degrees of freedom, respectively. For each population, the mean square error (MSE) and error degrees of freedom (df) were used in the Dunnett’s equation to determine a critical value, d′:
d′=t√2MSE/df,
where t is a statistical value (2.65) der ived from a t-table. The calculated d′ value was added to the needle relative conductiv-ity value for the control sample of each seedling within each Sitka × inter ior spruce population. Individual seedling critical temperatures were then calculated by interpolating between two test temperatures that had relative conductivities that were bracketing the critical relative conductivity.
Statistical analysis
For all tests we used a randomized experimental design with n = 6 for each seed source. For each test time, a one-way analysis of var iance was conducted to compare the responses of the eight seed sources: for clar ity, only four seed sources, showing the full range of sources, are presented in the figures. When there were significant treatment differences (based on the one-way analysis of variance), a Pearson product moment coefficient of correlation was conducted using all eight seed sources to measure linear relationships between an ecophysi-ological parameter (y var iable) and the rate of Sitka × interior spruce hybridization, Si-rDNA index, (x var iable). Because of atypical freezing tolerance patterns in the full-sib F1 crosses, data are shown but not included in the correlation analysis for freezing tolerance parameters with other spruce hybrid popu-lations. Regression analysis of freezing tolerance in relation to mean daily air temperature in the fall was conducted on data from four seed sources.
Results and discussion DNA Analysis
No. 1) exhibited a large variation in Si-rDNA index between the drought tolerant (0.51 ± 0.08) and freezing tolerant (0.35 ± 0.07) populations (Grossnickle and Sutton, unpublished data). The spruce seedling populations had similar Si-rDNA index values to the mature trees that were surveyed previously from the same approximate locations (Sutton et al. 1994, and Ta-ble 1).
Seed from the full-sib F1 crosses had an Si-rDNA index of 0.63, indicating that the contribution from each of the parental species to the nuclear genome was not equal. Based on esti-mates of rDNA copy number from hybridization intensities, Sitka spruce has a copy number of approximately 80% that of interior spruce. The Si-rDNA index averaged over all F1 seed-lings measured was 0.58 ± 0.16 (n = 22), which may reflect the difference in copy number. Another possibility is that some individuals may not be hybrids, as a result of errors in pollina-tion. However, when Sutton et al. (1991) analyzed repre-sentatives of these crosses using chloroplast probes the
expected inheritance pattern was observed in every case, indi-cating that it is unlikely that errors have occurred in the gen-eration of F1 hybrids.
Drought tolerance
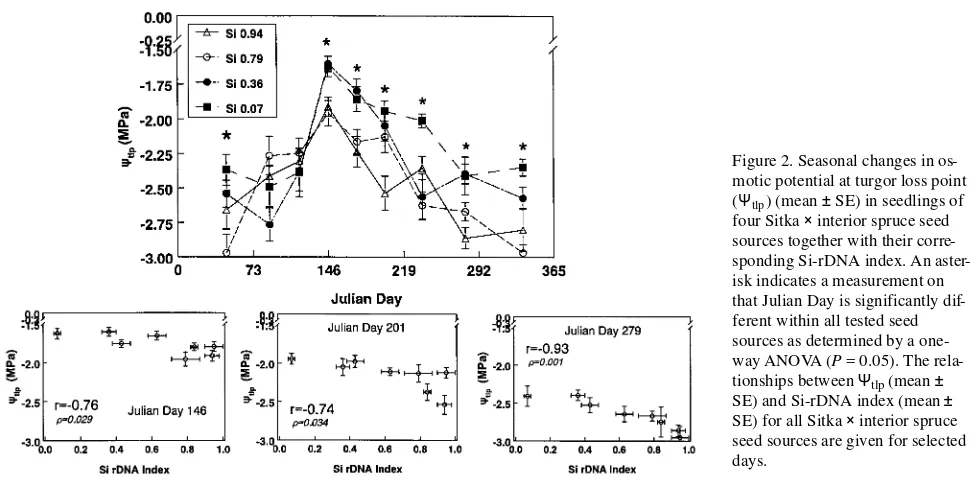
Before bud break (Julian Day (JD) 47), seedlings from all Sitka × interior spruce populations had low osmotic potentials at saturation (Ψsat) (Figure 1) and turgor loss point (Ψtlp)
(Fig-ure 2). During bud break and at the start of shoot elongation (JD 90 to 140), Ψsat and Ψtlp increased in seedlings from all
origins (cf. Grossnickle 1989, Colombo and Teng 1992). The spring period was the only time during the year when osmotic potentials were lower in Sitka spruce populations than in interior spruce populations. Seedlings with a higher Si-rDNA index broke bud earlier than seedlings with a lower Si-rDNA index (Grossnickle and Sutton, unpublished observations) and this was reflected in their earlier seasonal increase in osmotic potential. Osmotic potentials decreased in seedlings from all Table 1. Summary of seed source information and the interior spruce rDNA index (mean ± SE; n = 12) of each Sitka × interior spruce seed source.
Source Seedlot Seed zone1 Location Elevation (m) Si (rDNA) index
MT2 Seedlings
1 1004 NST Kitwanga, 55°20′ N, 128°05′ W 305 0.35 + 0.06 0.43 ± 0.05
2 4075 BLK Morice West, 54°10′ N, 127°15′ W 760 0.80 + 0.08 0.94 ± 0.04
3 4132 SM Lower Nass, 54°58′ N, 129°38′ W 10 0.01 + 0.04 0.07 ± 0.02
4 14657 NST Meziadan Lake, 56°06′ N, 129°19′ W 290 0.44 + 0.05 0.36 ± 0.04 5 6308 Bulkley Valley, 53°30′ N, 55°40′ N,127° W 840 -- 0.95 ± 0.05 6 Five OP families Morice Lake, 54°20′ N, 127°30′ W 840 0.80 + 0.08 0.79 ± 0.08 7 Five OP families North Babine, 55°35′ N, 126°40′ W 840 0.96 + 0.10 0.84 ± 0.02
8 Full-sib F1 Crosses -- 0.63 ± 0.05
1 NST = Nass Skeena Transition, BLK = Bulkley Valley, and SM = Spruce Maritime. 2 MT = Mature trees. Surveyed by Sutton et al. (1994).
Figure 1. Seasonal changes in os-motic potential at saturation (Ψsat) (mean ± SE) of seedlings
sources throughout the summer (JD 146--201) and early fall (JD 279) and Sitka spruce populations had higher Ψsat (up to
0.20--0.35 MPa higher) and higher Ψtlp (up to 0.35--0.6 MPa
higher) than interior spruce populations. After bud set and during fall acclimation, Ψsat and Ψtlp decreased in all Sitka ×
interior spruce populations (Figures 1 and 2, respectively). Similar declines in osmotic potential during fall acclimation have been reported for Sitka spruce (Hellkvist et al. 1974) and white spruce (Grossnickle 1989, Colombo and Teng 1992).
In all populations at all times of year, there was an inverse relationship between the Si-rDNA index and the values of
Ψsat and Ψtlp; i.e., populations with a high Si-rDNA index had
low values of Ψsat and Ψtlp (Figures 1 and 2, respectively). The
difference in Ψsat between the Sitka spruce and interior spruce
populations remained between 0.20 and 0.30 MPa throughout the year, indicating that there were only minor differences in active osmotic adjustment between Sitka spruce and interior spruce populations across the season. On the other hand, the difference in Ψtlp between Sitka spruce and interior spruce
populations changed seasonally from 0.50 MPa in the late fall when seedlings were in a dormant state (JD 279), to 0.30 MPa during the spring growth phase (JD 146), and up to 0.60 MPa just after summer bud set (JD 201). Interior spruce populations had greater seasonal changes in Ψtlp than Sitka spruce
popula-tions, indicating a greater capacity for passive osmotic adjust-ment through the concentration of existing solutes. Ecotypic differences in osmotic adjustment within a tree species have been related to soil water availability at the location of origin of the plant source (Bongarten and Teskey 1986, Abrams 1988, Collier and Boyer 1989, Russell 1993).
All seedlings had higher total turgor (ΨPTotal) in late winter
(JD 47) than at other times of year, and seedlings from popu-lations that were more interior in origin had higher values than more coastal populations (Figure 3). During bud break and shoot elongation (JD 90--140), ΨPTotal decreased in seedlings
from all origins (Figure 3). As a result of the decrease in
ΨPTotal during shoot elongation, seedlings were susceptible to
water stress during this period (Grossnickle 1988, Grossnickle and Major 1994). During shoot elongation (JD146), the inte-rior and Sitka spruce populations had similar ΨPTotal values.
Total turgor increased in all seedlings during the summer and fall, and the increase was greater in the interior spruce popula-tions than in the Sitka spruce populapopula-tions. By JD 201 and 279, the differences in ΨPTotal between the Sitka spruce and interior
spruce populations were 5.0 and 9.0 MPa, respectively. A similar increase in ΨPTotal occurs after bud set in white spruce
(Grossnickle 1988, Colombo and Teng 1992). The F1 cross between interior and Sitka spruce had ΨPTotal values that were
intermediate between those of interior spruce and Sitka spruce throughout the year.
In summary, interior spruce populations had greater osmotic adjustment (i.e., lower Ψsat and Ψtlp, Figures 1 and 2,
respec-tively) and greater turgor maintenance capacity (i.e., higher
ΨPTotal, Figure 3) throughout most of the year than Sitka spruce
populations. Seasonal precipitation patterns for sites across the Nass Skeena Transition area indicated that precipitation was high in maritime locations and declined through the mountain-ous transition area and was lowest at continental locations (Environment Canada 1980). Differences in drought tolerance among Sitka × interior spruce populations conformed to these regional precipitation patterns.
Freezing tolerance
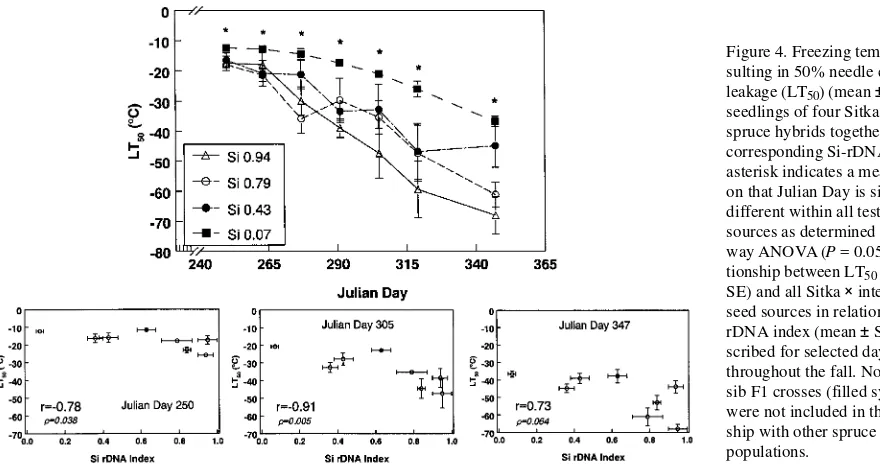
As daylength and air temperatures decreased in the fall, all Sitka × interior spruce populations exhibited a decrease in the temperature at which 50% needle electrolyte leakage occurred (LT50) (Figure 4) and in the critical temperature (Figure 5). A
rapid decline in freezing tolerance of spruce species in the fall has been observed in many studies (e.g., Cannell and Sheppard 1982, Cannell et al.1985, Burr et al. 1989, Simpson 1990, Figure 2. Seasonal changes in os-motic potential at turgor loss point (Ψtlp) (mean ± SE) in seedlings of
Bigras and D’Aoust 1992, Grossnickle et al. 1994).
Throughout the fall, populations with a high Si-rDNA index usually had lower LT50 (Figure 4) and critical (Figure 5)
tem-peratures than populations with a low Si-rDNA index. In the early fall (JD 250), there was up to a 10 °C difference in LT50
temperatures between Sitka and interior spruce populations. As the fall progressed (JD 305 and 347), LT50 values for
interior spruce populations were up to 30 °C lower than those of Sitka spruce populations. There were large differences in critical temperature between Sitka and interior spruce popula-tions in early (7 °C on JD 250) and mid (15 °C on JD 305) fall; however, by late fall (JD 347) the critical temperatures of Sitka
and interior spruce populations were similar. These results support earlier findings that Sitka spruce develops freezing tolerance more slowly in the fall than Engelmann spruce or white spruce (Sheppard and Cannell 1985, Kolotelo 1991) and that its survival under severe winter conditions is lower (Ying and Morgenstern 1982). At most measurement times, hybrids of the Sitka × interior spruce complex had an intermediate degree of freezing tolerance compared with the Sitka and interior spruce populations (cf. Ying and Morgenstern 1982, Sheppard and Cannell 1985, Kolotelo 1991). The difference in freezing tolerance patterns among spruce species and their hybrids has been explained on the basis of the theory of Figure 3. Seasonals change in to-tal turgor potential (ΨPTotal)
(mean ± SE) in seedlings of four Sitka × interior spruce seed sources together with their corre-sponding Si-rDNA index. An as-terisk indicates a measurement on that Julian Day is significantly dif-ferent within all tested seed sources as determined by a one-way ANOVA (P = 0.05). The rela-tionships between ΨPTotal (mean ± SE) and Si-rDNA index (mean ± SE) for all Sitka × interior spruce seed sources are given for selected days.
polygenic inheritance of hardiness (Ying and Morgenstern 1982), i.e., the combining of hardiness characteristics through independent acquisition of genetic information derived from more than one source.
Based on their Si-rDNA index of 0.63, progeny from the F1 cross between Sitka and interior spruce did not fit the patterns for LT50 and critical temperatures during the fall acclimation
period (Figures 4 and 5, respectively), but exhibited freezing tolerance characteristics more like those of Sitka spruce. How-ever, their drought tolerance characteristics did conform to their Si-rDNA index patterns. The origin of parent material for the F1 hybrids may account, at least in part, for their freezing tolerance behavior. Seeds from four of the six crosses tested were derived from Sitka spruce located on Vancouver Island; which is 4 to 5° further south than the Nass Skeena seed sources. Thus, these results indicate that the rDNA index also reflects differences between populations with respect to over-all hybrid nature, and this difference is only one factor that contributes to differences in drought or freezing tolerance among populations.
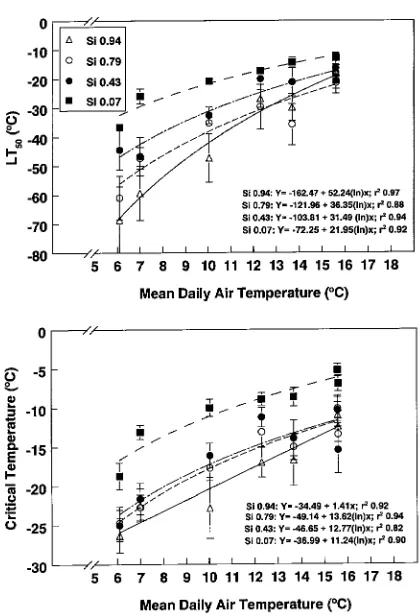
With declining mean daily air temperatures in the fall, both LT50 and critical temperature decreased in all Sitka × interior
spruce populations (Figure 6). The rate of freezing tolerance acclimation was related to the Si-rDNA index. Among spruce populations, differences in LT50 values increased as the mean
daily air temperature declined. At a mean daily air temperature of 6 °C, seedlings with Si-rDNA indices of 0.07 and 0.94 had LT50 values of −33 and −69 °C, respectively. Differences in
critical temperature among spruce populations was smaller than differences in LT50 values. All seedlings with an Si-rDNA
index > 0.36 exhibited similar decreases in their critical tem-peratures, with a critical temperature of around −25 °C
com-Figure 5. Critical temperature (mean ± SE) resulting in initial nee-dle electrolyte leakage of seedlings of four Sitka × interior spruce hy-brids during the fall together with their corresponding Si-rDNA in-dex. An asterisk indicates a meas-urement on that Julian Day is significantly different within all tested seed sources as determined by a one-way ANOVA (P = 0.05). The relationship between critical temperature (mean ± SE) and all Sitka × interior spruce seed sources in relation to their Si-rDNA index (mean ± SE) are described for se-lected days throughout the fall. The full-sib F1 crosses (filled symbols) were not included in the relation-ship with other spruce hybrid popu-lations.
Figure 6. Relationship between (a) freezing temperature resulting in 50% needle electrolyte leakage (LT50) (mean ± SE) and (b) critical
pared to −17 °C for seedlings with an Si-rDNA index of 0.07, at a mean daily air temperature of 6 °C. Field sites in the Nass Skeena Transition zone have average daily temperatures of between 4 and 5 °C by October, and extreme minimum tem-peratures range between −8 °C for maritime and −18 °C for interior locations (Environment Canada 1980). Extreme mini-mum temperatures in November can drop to −18 °C for mari-time and −37 °C for interior locations. From December to March, extreme minimum temperatures below −40 °C occur in the coastal--interior transition and interior locations. Spruce seedlings with an Si-rDNA index of at least 0.35 have a better chance of withstanding freezing temperatures that cause initial needle damage. Furthermore, a spruce population with a high Si-rDNA index can have low seasonal LT50 values and thus
greater freezing tolerance during fall acclimation.
Variation in freezing tolerance among populations of a spe-cies that spans coastal and interior ecosystems is not unique to the transition from Sitka to interior spruce populations. Interior populations of both Douglas-fir (Pseudotsuga menziesii (Mirb.) Franco) (Rehfeldt 1977) and western white pine (Pinus monticola Dougl. ex D Don) (Thomas and Lester 1992) have greater acclimation to freezing temperatures than coastal populations.
Conclusions
Our findings confirm previous work by Sutton et al. (1991a, 1991b, 1994) that DNA analysis is an effective way to identify genotypic differences in Sitka × interior spruce populations covering the Nass Skeena Transition zone within British Co-lumbia, Canada. Thus, a high Si-rDNA index was associated with high drought and freezing tolerance. These ecophysi-ological patterns were consistent throughout the yearly cycle indicating that screening Sitka × interior spruce populations based on their Si-rDNA index is a valid selection procedure. The use of genetic markers provides the opportunity to screen for a desired genetic makeup without having to subject all populations to ecophysiological testing. The incorporation of genetic marker procedures, based on freezing and drought tolerance patterns, should improve seed transfer guidelines for Sitka and interior spruce populations (Thomas and Lester 1992).
Acknowledgments
This research was supported by the Science Council of British Colum-bia (Contract No. 175 (T-5)) and British ColumColum-bia Ministry of Forests (Contract No. 18605-20/SXSS). The authors thank Drs. Shihe Fan, Kurt Johnsen and John Major for reviewing earlier versions of the manuscript.
References
Abrams, M.D. 1988. Genetic variation in leaf morphology and plant and tissue water relations during drought in Cercis canadensis L. For. Sci. 34:200--207.
Bigras, F.J. and A.L. D’Aoust. 1992. Hardening and dehardening of shoots and roots of containerized black spruce and white spruce seedlings under short and long days. Can. J. For. Res. 22:388--396.
Bongarten, B.C. and R.O. Teskey. 1986. Water relations of loblolly pine seedlings from diverse geographic regions. Tree Physiol. 1:265--276.
Burns, R.M. and B.H. Honkala. 1990. Silvics of North America. Volume 1, Conifers. USDA For. Serv. Agric. Handb. No. 654. Burr, K.E., R.W. Tinus, S.J. Wallner and R.M. King. 1989.
Relation-ship among cold hardiness, root growth potential and bud dormancy in three conifers. Tree Physiol. 5:291--306.
Burr, K.E., R.W. Tinus, S.J. Wallner and R.M. King. 1990. Compari-son of three cold hardiness tests for conifer seedlings. Tree Physiol. 6:351--369.
Cannell, M.G.R. and L.J. Sheppard. 1982. Seasonal changes in the frost hardiness of provenances of Picea sitchensis in Scotland. Forestry 55:137--153.
Cannell, M.G.R., L.J. Sheppard, R.I. Smith and M.B. Murray. 1985. Autumn frost damage on young Picea sitchensis. 2. Shoot frost hardening, and the probability of frost damage in Scotland. Forestry 58:145--166.
Collier, D.E. and M.G. Boyer. 1989. The water relations of Thuja occidentalis L. from sites of contrasting moisture availability. Bot. Gaz. 150:445--448.
Colombo, S.J. and Y. Teng. 1992. Seasonal variation in water relations of white spruce seedlings. Oecologia 92:410--415.
Daubenmire, R. 1968. Taxonomic and ecological relationships be-tween Picea glauca and Picea sitchensis and their ecological inter-pretation. Can. J. Bot. 46:787--798.
DeHayes, D.H. and M.W. Williams. 1989. Critical temperature: A quantitative method of assessing cold tolerance. USDA For. Serv. Gen. Tech. Rep. NE-134, 6 p.
Dexter, S.T., W.E. Tottingham and L.F. Graber. 1930. Preliminary results in measuring the hardiness of plants. Plant Physiol. 5:215--223.
Environment Canada. 1980. Canadian climate normals, 1951--1980, temperature and precipitation. Environment Canada, Atmospheric Environment Services, UDC:551.582 (711).
Flint, H.L., B.R. Boyce and D.J. Beattie. 1967. Index of injury----a useful expression of freezing injury to plant tissues as determined by the electrolytic method. Can. J. Plant Sci. 47:229--230 Grossnickle, S.C. 1988. Planting stress of bare-root jack pine and
white spruce seedlings. II. Changes in tissue water potential com-ponents. Tree Physiol. 4:85--97.
Grossnickle, S.C. 1989. Seasonal shoot phenology and water relations of Picea glauca. Can. J. For. Res. 19:1287--1290.
Grossnickle, S.C. and J.E. Major. 1994. Interior spruce seedlings compared to emblings produced from somatic embryogenesis. III. Physiological response and morphological development on a refor-estation site. Can. J. For. Res. 24:1397--1407.
Grossnickle, S.C., J.E. Major and R.F. Folk. 1994. Interior spruce seedlings compared to emblings produced from somatic embryo-genesis. I. Nursery development, fall acclimation and frozen stor-age. Can. J. For. Res. 24:1376--1384.
Hellkvist, J., G.P. Richards and P.G. Jarvis. 1974. Vertical gradients of water potential and tissue water relations in Sitka spruce trees measured with the pressure chamber. J. Appl. Ecol. 11:637--668. Kolotelo, D. 1991. Artificial hybrids of B.C. spruce species: growth,
phenology and cold hardiness. MS Thesis, Univ. British Columbia, Vancouver, 106 p.
Little, E.L. 1953. A natural hybrid spruce in Alaska. J. For. 51:745--747.
Rehfeldt, G.E. 1977. Growth and cold hardiness of intervarietal hy-brids of Douglas-fir. Theor. Appl. Gen. 50:3--15.
Roberts, S. W. and K.K. Knoerr. 1977. Components of water potential estimated from xylem pressure measurements in five tree species. Oecologia 28:191--202.
Roche, L. 1969. A genecological study of the genus Picea in British Columbia. New Phytol. 68:505--554.
Russell, J.H. 1993. Genetic architecture, genecology and phenotypic plasticity in seed and seedling traits of yellow-cedar (Chamaecy-paris nootkatensis (D. Don) Spach). PhD Diss., Univ. British Co-lumbia, Vancouver, 168 p.
Schulte, P.J. and T.M. Hinckley. 1985. A comparison of pressure-vol-ume curve data analysis technique. J. Exp. Bot. 36:1590--1602. Sheppard, L.J. and M.G.R. Cannell. 1985. Performance and frost
hardiness of Picea sitchensis × Picea glauca hybrids in Scotland. Forestry 58:67--74.
Simpson, D.G. 1990. Frost hardiness, root growth capacity and field performance relationships in interior spruce, lodgepole pine, Douglas-fir and western hemlock seedlings. Can. J. For. Res. 20:566--572.
Sutton, B.C.S., D.J. Flanagan and Y.A. El-Kassaby. 1991a. A simple and rapid method for species determination of spruce seedlots using restriction fragment length polymorphism. Silvae Gen. 40:119--123.
Sutton, B.C.S., D.J. Flanagan, R. Gawley, C.H. Newton, D. Lester and Y.A. El-Kassaby. 1991b. Inheritance of chloroplast and mitochon-drial DNA in Picea and composition of hybrids from introgression zones. Theor. Appl. Gen. 82:242--248.
Sutton, B.C.S., S.C. Pritchard, J.R. Gawley, C.H. Newton and G. Kiss. 1994. Analysis of Sitka × interior spruce introgression in British Columbia using cytoplasmic and nuclear DNA probes. Can. J. For. Res. 24:278--285.
Tauer, C.G., S.W. Hallgren and B. Martin. 1992. Using marker-aided selection to improve tree growth response to abiotic stress. Can. J. For. Res. 22:1018--1030.
Thomas, B.R. and D.T. Lester. 1992. An examination of regional, provenance, and family variation in cold hardiness of Pinus monti-cola. Can. J. For. Res. 22:1917--1921.
Wagner, D.B. 1992. Nuclear, chloroplast, and mitochondrial DNA polymorphisms as biochemical markers in population genetic analysis of forest trees. New For. 6:373--390.
Yeh, F.C. and J.T. Arnott. 1986. Electrophoretic and morphological differentiation of Picea sitchensis, Picea glauca, and their hybrids. Can. J. For. Res. 16:791--798.