Summary We applied a semi-mechanistic model of fresh matter accumulation to peach fruit during the stage of rapid mesocarp development. The model, which is based on simple hypotheses of fluid flows into and out of the fruit, assumes that solution flow into the fruit increases with fruit weight and transpiration per unit weight, and decreases with the maximum daily shrinkage of the trunk, which was used as an indicator of water stress. Fruit transpiration was assumed to increase with fruit size and with radiation. Fruit respiration was considered to be related to fruit growth and to temperature. The model simulates variability in growth among fruits according to cli-matic conditions, degree of water stress and weight of the fruit at the beginning of the simulation. We used data obtained from well-watered and water-stressed trees grown in containers to estimate model parameters and to test the model. There was close agreement between the simulated and measured values. A sensitivity analysis showed that initial fruit weight partly determined the variation in growth among fruits. The analysis also indicated that there was an optimal irradiance for fruit growth and that the effect of high global radiation on growth varied according to the stage of fruit development. Water stress, which was the most important factor influencing fruit growth, rapidly depressed growth, particularly when applied late in the season.
Keywords: Prunus persica, solar radiation, solution flow, tran-spiration, trunk shrinkage, water balance.
Introduction
Water is the chief constituent, by weight, of most fleshy fruits; hence fruit growth largely depends on the rate of net water accumulation (Hardie and Considine 1976, Li et al. 1989). Because a large amount of water, along with assimilates, is transported in the phloem sap to the fruit in many species such as grape, apple and tomato (Ho et al. 1987, Lang and Thorpe 1989, Lang 1990), a detailed understanding of water-related interactions is essential for modeling fleshy fruit growth. How-ever, only a few models simulate water flow into the fruit (Bussières 1994) or the water budget of the fruit (Lee 1990). Most models of fleshy fruit growth attempt to simulate dry
matter accumulation without considering water flow (Gutier-rez et al. 1985, Harpaz et al. 1990, Buwalda 1991). Moreover, most of these models simulate the growth of either total fruit mass or an average fruit, without considering the wide variabil-ity in fruit growth within and among trees (Jackson 1966, Génard and Bruchou 1993).
Water flow into the fruit depends on the water potential difference between the plant and the fruit (e.g., Lee et al. 1989, Johnson et al. 1992). Several studies have emphasized the importance of transpiration in fruit water budgets, and Schroeder and Wieland (1956) and Jones and Higgs (1982) concluded that a large proportion of daily fruit shrinkage may be accounted for by transpiration from the fruit. The fraction of water imported into the fruit that is transpired varies among species. This fraction is small in tomato (Johnson et al. 1992) and large in peach and yucca (van Die and Willemse 1980, Selles 1988). If a large fraction of the water transported to the fruit is transpired, it may help to concentrate sugars in the fruit, resulting in a reduction in the osmotic potential of the fruit.
Peach trees are frequently cultivated in dry countries and are often subjected to water stress. Numerous studies have shown that fruit size at harvest is not affected by drought during the early phases of fruit growth, but fruit size decreases when drought occurs during the main period of cell enlargement (Chalmers et al. 1985, Li et al. 1989). The carbon budget of peaches has been extensively studied (Dejong and Goudrian 1989, Dejong and Walton 1989, Pavel and Dejong 1993) and modeled (Grossman and Dejong 1994), but relatively little has been published on the components of water balance of the developing fruit. We have developed a semi-mechanistic model of the effect of water stress on peach fruit growth that is based on fluid flows. Comparisons of simulated and observed fruit growth were performed to test the model. The model was used to study the sensivity of fruit growth to: (1) variation in fruit size during the early stages of development; (2) global radiation; and (3) water stress.
The model
Peach fruit growth follows a double sigmoidal pattern that can be divided into three stages: cell division and development of
Modeling the response of peach fruit growth to water stress
M. GÉNARD and J. G. HUGUET
Unité de Recherche en Ecophysiologie et Horticulture, Institut National de la Recherche Agronomique, Domaine Saint-Paul, Site Agroparc, 84914 Avignon Cedex 9, France
Received February 14, 1995
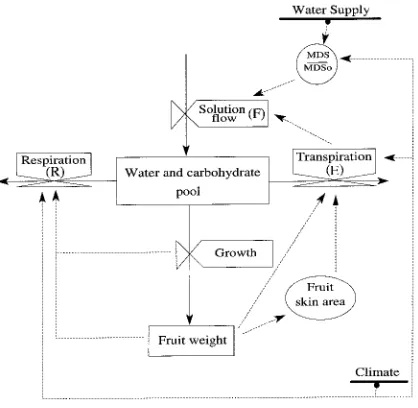
the endosperm (Stage I), endocarp sclerification (Stage II) and rapid expansion of mesocarp cells (Stage III, Gage and Stutte, 1991). Stage I determines the cell number and therefore the growth potential, whereas Stage III determines how much of this potential is realized. The model was designed to simulate the growth of individual peach (Prunus persica L. Batsch) fruits during Stage III. The model assumes that trees are optimally fertilized and that carbon acquisition by photosyn-thesis is sufficient for well-irrigated trees to reach their full potential for fruit growth. A general outline of the model is presented in Figure 1 in the form of a relational diagram of the fruit system. The model is based on simple laws of water and soluble matter transfer. Following an approach similar to that of Lee (1990), the fruit receives a daily solution flow from the plant (F, g day−1) and loses water by transpiration (E, g day−1) and carbon by respiration (R, g day−1). Thus growth (dw/dt) is expressed as:
dw
dt = F − R − E. (1)
We ignored fruit photosynthesis because Pavel and DeJong (1993) showed that it contributes only slightly to the total requirement of the peach fruit for matter (water and carbohy-drates) and because chlorophyll in the fruit skin is quickly degraded during Stage III. Water stress was assumed to be proportional to the maximum daily trunk shrinkage (MDS), measured by the micromorphometric method (Huguet 1985, Garnier and Berger 1986). This method measures diurnal changes in trunk diameter, which closely parallel changes in tree water content (Simonneau et al. 1993) and are functionally related to tree water potential (Chalmers and Wilson 1978).
Climate, initial fruit size, which is indicative of growth during Stage I, and MDS are the model inputs. The time-step in the model is one day. In the model, a fruit stops growing when losses by transpiration and respiration are equal to the solution flow received from the plant.
Respiration
Maintenance respiration Rm (g day−1) is calculated as a func-tion of fruit dry mass and a Q10 funcfunc-tion of the mean daily temperature:
Rm= K DMC WQ10
(T − 20)
10 , (2)
where W is the fresh weight of the fruit (g), T is temperature (°C), K is the maintenance respiration coefficient, and DMC is the mean dry matter content, assumed to be 15%.
Growth respiration Rg (g day−1) is computed as a function of absolute growth rate in terms of dry matter:
Rg= G DMC
dw
dt , (3)
where G is the growth respiratory coefficient.
When x grams of CO2 are lost, the real matter loss is only αx because the water produced during respiration can be used by the fruit (α = atomic weight of C/molecular weight of CO2). Thus, matter loss is
R =α(Rm+ Rg). (4)
Transpiration
Water loss per unit area through the fruit skin is computed hourly (Eh) because of its high dependence on changes in climatic conditions, especially irradiance, during the day (cf. Jones and Higgs 1982). Stomata of young peach fruits are able to regulate tissue water loss (Chalmers et al. 1983); however, peach stomata become dysfunctional during Stage III of growth (Chalmers et al., 1983). Thus, we assumed that fruit stomata were unable to regulate transpiration in our model. Nguyen-The et al. (1989) showed that cuticular microcracks are sometimes plentiful on peach skin. Their number increases with fruit size, increasing the skin’s permeability to water (Nguyen-The, personal communication). Walsh et al. (1989) showed that skin permeability to water increases markedly during the final swelling of peach fruit. The model uses fruit weight as a surrogate term to account for this size--permeabil-ity relationship. The hourly transpiration per unit area of skin was computed as a function of fruit mass and global solar radiation (GR in MJ h−1 m−2) defined as the solar irradiance received on a horizontal surface at a height of 2 m:
Eh= Ehmax(1 − e−βWGR), (5)
where Ehmax and β are parameters that were statistically esti-mated by Huguet and Génard (1995). The parameter Ehmax can be interpreted as the maximum hourly transpiration per unit Figure 1. Relational diagram illustrating water and carbon partitioning
area of skin and β is the relative hourly transpiration when GR is close to 0 (W is always greater than zero).
Daily transpiration (E, g day−1) was computed as:
E =A
∑
Eh, (6)where A is the skin area (cm2) of a spherical fruit, computed from:
The model assumes the existence of a maximal flow (Fmax ) that is determined by the restricted cross-sectional area of the peduncle vasculature supplying the fruit. Solution flow is considered to increase with increasing plant water potential and to decrease with increasing fruit water potential, as has been found for xylem flow, although it is recognized that phloem flow toward the fruits is a more complicated process than xylem flow (Lang et al. 1986).
According to Bussières (1994), fruit water potential depends on both the osmotic potential of its cells, which is usually inversely related to fruit sugar concentration, and pressure potential caused by the resistance of tissues to deformation. The sugar concentration increases with fruit transpiration per unit weight and with fruit weight (cf. Chapman et al. 1991, Génard et al. 1991, Pavel and DeJong 1993), whereas the pressure potential seems to increase with fruit size (Bussières 1994). The plant water potential is assumed to be inversely proportional to MDS.
Thus, the model assumed that solution flow: (1) has a maxi-mal value Fmax, (2) increases with fruit weight (W) and with transpiration per unit weight (Ew), because W and Ew cause a decrease in the osmotic potential of the fruit, (3) plateaus when fruit size is large, when the fruit pressure potential compen-sates for the decrease in osmotic potential, and (4) decreases with MDS.
Based on the foregoing assumptions, the flow was computed by means of the following empirical equation:
F= A11 − e−A2(WEw)
where Ai are empirical functions of the effect of water stress on daily solution flow (F), ai, bi and Fmax are parameters esti-mated statistically, and MDSo is a calibration parameter re-lated to the trunk characteristics of the tree and calcure-lated as the mean MDS at the beginning of Stage III during sunny days when water supply is unlimited. The product WEw is equal to fruit transpiration (E), which is an important stimulator of fruit growth in the model (cf. Chalmers et al. 1983).
Materials and methods
Data used to set the model parameters and test the model were obtained from five four-year-old ‘‘Dixired’’ peach trees grow-ing in containers at Montfavet INRA Centre in Southern France. The experimental design has been described by Huguet and Génard (1995). Briefly, the fruits on the trees were thinned to about 20 per tree. Three trees were well watered by trickle outlets from May 28 to June 30 and the other two trees were subjected to water stress by withholding water from June 8 to 11, and then limiting the water supply to 25% of the quantity supplied the well-watered trees from June 16 to 30. Five fruits were selected on a tree from each treatment and their initial diameters measured and the changes in diameters continuously recorded from May 28 to June 27 by means of a linear variable differential transformer and converted to fresh fruit weight (g) using the equation W =p1D
1⁄p
2 (Huguet and
Génard 1995). These data were used to calculate mean daily growth rate and mean weight of the fruit in the well-watered and water-stressed treatments. The MDS/MDSo ratios of the two trees studied were obtained from trunk measurements made with a specific linear variable differential transformer. Air temperature and global radiation were obtained from the weather station located near the experimental plot. These data, except the last four measurements of daily growth of fruit in the well-watered treatment when growth had stopped, were used to estimate the adjustable parameters (θ) in Equation 8 linking F to E and MDS/MDSo.
Let fi be a nonlinear equation, we have
Parameter values used for model construction are presented in Table 1. Parameters required for computing respiration were deduced from the results of DeJong and Goudrian (1989), and the parameters required for the estimation of transpiration were obtained from data presented in Huguet and Génard (1995). The daily growth rate curve was fitted with the non-lin-ear procedures of the Splus statistical package (Chambers and Hastie 1992).
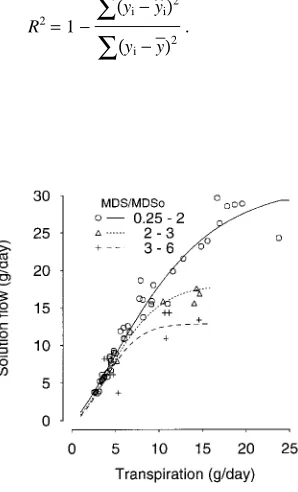
The model was tested by comparing growth simulated by the model to: (1) the mean growth of the five fruits used for model parameterization; (2) the mean growth per tree of the fruit not used for parameterization; and (3) the individual growth of fruit not used for parameterization. The goodness-of-fit of the model was measured as recommended by Kvålseth (1985) by:
R2= 1 −
∑
(yi− y^i)2∑
(yi− y_
)2 .
Results
Solution flow parameterization
Climatic inputs, fruit weight and the MDS/MDSo ratio were all good predictors of daily growth rate of fruits (R2 = 0.77). Solution flow computed by the model was similar to solution flow calculated from the data (R2 = 0.95). Solution flow in-creased with calculated transpiration and leveled off at differ-ent transpiration rates depending on the value of the MDS/MDSo ratio (Figure 2). Solution flow was less sensitive to water stress at low transpiration rates than at high transpira-tion rates (Figure 2).
Simulations
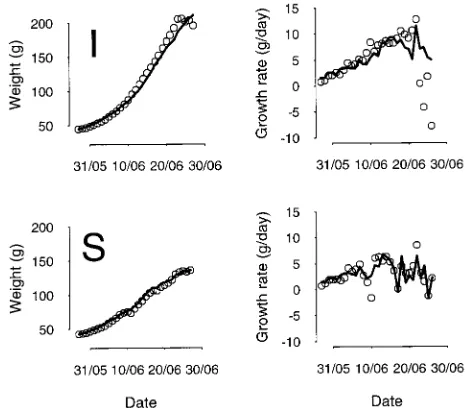
Fruits used for parameterization There was close agreement between measured fruit weights and the model outputs (Fig-ure 3, R2 = 0.98 and 0.99 in the well-watered and water-stress treatments, respectively). The model correctly simulated the differences between water-stressed and well-watered condi-tions, but the simulated fruit weight in the well-watered treat-ment did not level off as quickly as the observed values. The variations in simulated growth rate of fruit in the water-stressed treatment followed the observed data fairly well (R2 = 0.6), but discrepancies were noted when stress occurred early (Fig-ure 3). When the last 4 days of meas(Fig-urements were excluded because fruit senescence had begun, the variation in simulated growth rate of fruit on well-watered trees followed the observed data fairly well (R2 = 0.63).
Fruits not used for parameterization The model simulated the mean fruit growth curves per tree fairly well both for trees Table 1. Model parameters definition and values
Parameter Description Value Units
Respiration
K Maintenance respiration coefficient 0.0024 g CO2 gDW−1 d−1
Q10 Temperature response coefficient 1.9
G Growth respiratory coefficient 0.309 g CO2 gDW−1
DMC Dry matter content of fruit 0.15 gDW gFW−1
α Carbon lost by CO2 produced 0.27 g C g CO2−1
Transpiration
Ehmax Maximum hourly transpiration per unit 0.012 g H2O h−1 cm−2
area of fruit skin
β Relative hourly transpiration per unit area 0.005 m2 h MJ−1 g−1
of fruit skin when GR is close to 0
p1 Weight-diameter conversion parameter 0.945
p2 Weight-diameter conversion parameter 0.392
Solution flow
Fmax Maximal solution flow 29.33 g day−1
a1 Coefficient for the solution flow equation 32.5 g day−1
a2 Coefficient for the solution flow equation 0.037
a3 Coefficient for the solution flow equation 1.347
b1 Coefficient for the solution flow equation −0.644
b2 Coefficient for the solution flow equation 0.208
b3 Coefficient for the solution flow equation 0.208
used for the model development and for independent trees (Figure 4). The model distinguished between growth curves of fruits from well-watered and water-stressed trees, except for the tree having the lowest initial fruit mass. These differences between trees agreed with field measurements (Figure 4). The agreement between observed and simulated growth of individ-ual fruit was reasonable for fruit from trees used for the model development and for fruit from independent trees (Figure 5). The coefficient of determination calculated from individual size measurements made on the populations of fruits grown in the well-watered and water-stress treatments, both on trees used for model development and for independent trees, were close to each other (0.78 to 0.85). These coefficients computed for each individual fruit were higher than 0.5 for 74% of the
Figure 3. Observed (points) and simulated (lines) values of mean weight and growth rate for fruits used for parameterization from well-watered (I) and water-stressed (S) trees.
Figure 4. Observed (points) and simulated (lines) values of mean fruit growth for the three well-watered (I) and the two water-stressed (S) trees. The stars indicate the trees used for model development.
Table 2. Mean and variance of observed and simulated fruit weight (g) at harvest for well-watered and water-stressed trees. (A) Trees used for model development, and (B) independent trees.
Well-watered Water-stressed
A B A B
Observed
Mean 185 164 122 115
Variance 1730 2744 526 647
Simulated
Mean 188 171 113 95
Variance 1035 3133 1084 1879
fruits. Classifying growth curves with respect to the mean value for the treatment (above, around and below the mean) was accurate for 90% of fruits. There was reasonable agreement between observations and simulations for mean, variance and distribution of fruit weight at harvest (considered to occur when weights were maximum during the period of simulation) (Ta-ble 2 and Figure 6).
Sensitivity analysis
In each of the sensitivity analysis simulations, only one input variable was changed at a time. The reference condition corre-sponds to June with uniform climatic conditions. Global radia-tion was set to 1.5 MJ h−1 m−2 throughout the day and to 0 MJ h−1 m−2 during the night. The temperature and the initial peach weight were set to 21 °C and to 50 g, respectively. A high rate of water supply was chosen with an MDS/MDSo ratio equal to 1.
The variation in solution flow and its partitioning to transpi-ration, respiration and growth is presented in Figure 7 for the reference condition. The solution flow increased gradually and leveled off at 29 g day−1. Absolute growth rate first increased with transpiration, then decreased when the solution flow reached its maximum and transpiration continued to increase.
Fruit growth respiration was more important than fruit mainte-nance respiration. The rate of total fruit respiration was negli-gible compared with the rates of fresh weight growth and fruit transpiration.
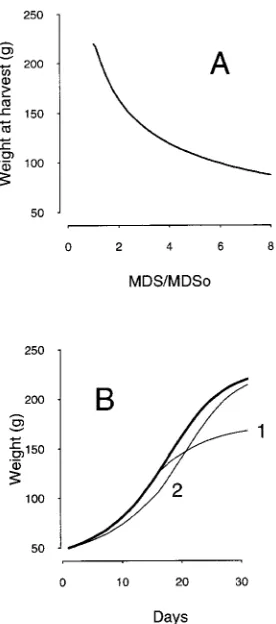
Initial fruit weight
Simulations performed with different initial fruit weights em-phasized the importance of this value in determining the pat-tern of the growth curve and fruit weight at harvest (Figure 8). When the initial fruit weight was high or average, the solution flow quickly reached its maximum and cumulative growth leveled off at 230 g. When the initial weight was low, the growth rate increased constantly because the solution flow increased faster than transpiration, but the fruit never grew very large because solution flow was limited (Figure 8). Global radiation
We simulated the effect of global radiation on fruit growth. Fruit weight at harvest increased with global radiation up to 1.5 MJ h−1 m−2, and decreased gradually with higher global radiation (Figure 9). At low global radiation the solution flow was too low, and at high global radiation losses to transpiration were too high to enable full fruit growth. We also simulated the effect of global radiation change during Stage III of fruit Figure 6. Observed and simulated probability densities of fruit weight
at harvest for well-watered (I) and water-stressed (S) trees. Trees used for model development and independent trees are denoted as (A) and (B), respectively.
Figure 7. Daily solution flow (F), transpiration (E), maintenance respiration (Rm), growth respiration (Rg) and growth rate (G) of a fruit growing under reference conditions (see text). Maintenance and growth respiration were multiplied by 50.
Figure 9. Fruit growth simulated according to global radiation (MJ h−1 m−2). A constant global radiation was used throughout the 30 days of each simulation.
growth. A low global radiation early in the third stage de-creased the growth rate (−81% for a decrease in global radia-tion from 1.5 to 0.5 MJ h−1 m−2). Conversely, a high global radiation increased the growth rate (+65% for an increase of global radiation from 1.5 to 2.5 MJ h−1 m−2). Late in Stage III, the effect of global radiation on growth rate was inverted (+200 versus −140%, respectively, for the above changes in global radiation). Early in Stage III, the fruit was small and the flow increased with global radiation faster than water losses by transpiration. Late in Stage III, the fruit was large and flow reached its maximum but transpiration still increased with global radiation.
Severity of water stress and time of occurrence
Fruit weight at harvest decreased with increasing values of the MDS/MDSo ratio, with a drop from 1.1 to 3 corresponding to a large decrease in solution flow. An increase in the MDS/MDSo ratio above 3 had less effect on fruit growth (Figure 10). During the early stages of fruit development, water stress had little effect on fruit growth, whereas late in Stage III when transpiration was high a drought-induced de-crease in solution flow had a dramatic effect on fruit growth (Figure 10).
Discussion
We used a classical physical approach to water flow as a framework to construct a semi-mechanistic model of fruit growth. Although our model was more sophisticated than that of Judd and McAneney (1987), in which kiwifruit either ex-pand at a maximum rate if plants are well watered or not at all if water is limiting, it was based on crude assumptions for representing the fruit and the solution transfers into and out of the fruit. As in Lee’s model (Lee 1990), we considered the fruit as a single compartment receiving a solution flow by its pedun-cle and losing water by transpiration through its skin. Although respiration is physiologically important, the loss of matter by respiration is negligible compared with water losses by tran-spiration. Unlike Lee’s model (Lee 1990), we considered that the solution flow received by the fruit and water loss per unit surface area varied in time. Although our model does not account for xylem back-flow, the process by which water is withdrawn from the fruit to other parts of the plant (Lang and Thorpe 1989, Lang 1990), the daily solution flow calculated in the model is the balance between the daily flow into the fruit and the daily back-flow. This balance was positive for peach fruit over a large range of intensities of water stress (Huguet and Génard 1995), as implicitly considered in Equation 8. The close agreement between simulated and field data indicates that the model was able to account for the observed variation in growth among fruits. However, the robustness of the model has not been rigorously tested because the validation data and the data used to set the parameters were collected under similar environmental conditions.
In our model, variation in daily solution flow into the fruit appeared to be controlled by the water potentials of the fruit and the plant. The model assumed that the variation in fruit water potential was partly determined by fruit transpiration and, thus, that the demand for water and soluble matter by the fruit was partly generated by fruit transpiration. This hypothe-sis is inconhypothe-sistent with the results of Johnson et al. (1992) who found that tomato fruit water potential remains relatively con-stant, and concluded that transpiration does not affect fruit water potential significantly. However, the physiology of to-mato fruit is probably different from that of peach fruit, be-cause peach cuticle is ten times more permeable than that of tomato (Nobel 1975). Johnson et al. (1992) estimated that the water transpired by tomato fruit represented 10.5% of the volume flow into the fruit, whereas the value was 70% for our peach fruit. Flow into the fruit is probably regulated differently depending on what fraction of the volume flow is used for transpiration. Our hypotheses are consistent with the observa-tions of Creasy and Lombard (1993) who found no change in fruit growth when transpiration was reduced by bagging the fruits. Thus, for well-watered trees (MDS/MDSo = 1), the model predicted almost no variation in fruit growth when transpiration decreased from 20 to 10 g fruit−1 day−1; i.e., a decrease in transpiration induced an equivalent decrease in solution flow into the fruit. Fruit often reacts this way in the field on cloudy days.
Our simulations indicated that there was an optimal global irradiance (1.5 MJ h−1 m−2≅ 1000 µmol s−1 m−2) for fruit Figure 10. Simulated fruit weight at harvest for MDS/MDSo values
growth, below which solution flow into the fruit is too slow, and above which water losses by transpiration are too high for the fruit to grow large. In the model, the reduction in solution flow with decreasing global radiation is the result of a decrease in transpiration. However, low global radiation can also impair fruit growth by restricting assimilate availability. The optimum global radiation corresponds approximately to the saturating irradiance below which peach leaf photosynthesis increases and above which it levels off (DeJong 1983, Higgins et al. 1992). Thus, global radiation might act on solution flow by affecting fruit transpiration and leaf photosynthesis, the former acting on fruit demand (through regulation of water potential) and the latter on fruit supply by the tree. Because our experi-ments were performed under fairly high global radiation on trees having a high leaf to fruit ratio, photosynthesis probably did not restrict fruit growth. Increasing the global radiation early in the season increased solution flow more than transpi-ration rate resulting in an increased growth rate. The opposite behavior was noted late in the season when fruit skin area was large enabling a high rate of transpiration, and the solution flow was restricted to Fmax. The effects of global radiation on fruit growth varied with the growing season because they were fundamentally related to the nonlinear relationship between the solution flow and fruit transpiration.
According to our simulations, a slight limitation of water supply (MDS/MDSo ≈ +1.1 to 2) had a strong impact on fruit growth, which might be the result of the high sensitivity to water stress during Stage III of peach fruit growth (Li et al. 1989). The negative effect of drought on fruit growth was small during the early stages of fruit development and large during the later stages of fruit development. A drought during the later stages of fruit development had a strong impact because water stress greatly decreased solution flow into large fruit. At the end of fruit development, most of the growth is due to cell enlargement (Scorza et al. 1991), which is very susceptible to inhibition by water stress (Hsiao 1973, Begg and Turner 1976). The simulated growth curves were sensitive to initial fruit weight (cf. Davis and Davis 1948, Batjer and Westwood 1958). These authors found a good correlation between the weight of peach fruit measured early and at harvest in well tended or-chards. Simulated fruits with low initial weight levelled off later than fruits with a high intial weight as has often been observed in the field for slow growing fruits.
The sensitivity analysis showed that in the range of com-monly encountered values of initial weight and global radia-tion, there is weak variation in fruit weight predicted at harvest. Nevertheless, the model predicts a large decrease in fruit weight at harvest only for fruit having a low initial weight (40 g) and receiving low global radiation (1 MJ h−1 m−2). In contrast, small differences in water stress had a large effect on fruit weight, especially when applied during the two weeks before harvest.
We conclude that fruit growth can be simulated by simple laws of solution transfer into and out of the fruit without reference to requirements for metabolic inputs by the develop-ing fruit or to hormonal regulation. Our model could be applied to other species with fleshy fruits having high transpiration
rates, whereas fruit growth of species having low transpiration rates, e.g., in tomato, may be better simulated by resistance models in which water import into the fruit is mainly control-led by the resistances along the transfer pathway, which de-pends on fruit radius (Bussières 1994).
Acknowledgments
This research was supported by INRA grant AIP EAU 93/49431. The authors thank R. Laurent for technical assistance, F. Lescourret for helpful comments on this paper, and Ph. Butler for improving the English translation.
References
Batjer, L.P. and M.N. Westwood. 1958. Size of Elberta and J.H. Hale peaches during the thinning period as related to size at harvest. Proc. Am. Soc. Hortic. Sci. 72:102--105.
Begg J.E. and N.C. Turner. 1976. Crop water deficits. Adv. Agron. 28:161--217.
Bussières, P. 1994. Water import in tomato fruit: a resistance model. Ann. Bot. 73:75--82.
Buwalda, J.G. 1991. A mathematical model of carbon acquisition and utilization by kiwifruit vines. Ecol. Model. 57:43--64.
Chalmers, D.J. and I.B. Wilson. 1978. Productivity of peach trees: tree growth and water stress in relation to fruit growth and assimilate demand. Ann. Bot. 42:285--294.
Chalmers, D.J., P.D. Mitchell and P.H. Jerie. 1985. The relation be-tween irrigation, growth and productivity of peach trees. Acta Hor-tic. 173:283--288.
Chalmers, D.J., K.A. Olsson and T.R. Jones. 1983. Water relations of peach trees and orchards. In Water Deficit and Plant Growth, Vol 7. Ed. T.T. Kozlowski. Academic Press, New York, pp 197--232. Chambers, J.M. and T.J. Hastie. 1992. Statistical models. S.
Wads-worth and Brooks/Cole Advanced Books & Software, Pacific Grove, CA, 608 p.
Chapman, Jr. G.W., J. Horvat. and W.R. Forbus, Jr. 1991. Physical and chemical changes during the maturation of peaches (Cv. Majestic). J. Agric. Food Chem. 39:867--870
Creasy, G.L. and P.B. Lombard. 1993. Vine water stress and peduncle girdling effects on pre- and post-veraison grape berry growth and deformability. Am. J. Enol. Viticult. 44:193--197.
Davis, L.D. and M.M. Davis. 1948. Size in canning peaches. The relation between the diameter of cling peaches early in season and at harvest. Proc. Am. Soc. Hortic. Sci. 51:225--230.
DeJong, T.M. 1983. CO2 assimilation characteristics of five Prunus tree fruit species. J. Am. Soc. Hortic. Sci. 108:303--307.
DeJong, T.M. and J. Goudriaan. 1989. Modeling peach fruit growth and carbohydrate requirements: reevaluation of the double-sigmoid growth pattern. J. Am. Soc. Hortic. Sci. 114:800--804.
DeJong, T.M. and E.F. Walton. 1989. Carbohydrate requirements of peach fruit growth and respiration. Tree Physiol. 5:329--335. van Die, J. and C.M. Willemse. 1980. The supply of water and solutes
by phloem and xylem to growing fruits of Yucca flaccida Haw. Ber. Dtsch. Bot. Ges. 93:327--337.
Gage, J. and G. Stutte. 1991. Developmental indices of peach: an anatomical framework. HortScience 26:459--463.
Génard, M. and C. Bruchou. 1993. A functional and exploratory approach to studying growth: the example of the peach fruit. J. Am. Soc. Hortic. Sci. 118:217--223.
Génard, M., C. Bruchou and C. Souty. 1991. Variabilité de la crois-sance et de la qualité chez la pêche (Prunus persica L. Batsch) et liaison entre croissance et qualité. Agronomie 11:829--845. Grossman, Y.L. and T.M. DeJong. 1994. PEACH: A simulation model
of reproductive and vegetative growth in peach trees. Tree Physiol. 14:329--345.
Gutierrez, A.P., D.W. Williams and H. Kido. 1985. A model of grape growth and development: the mathematical structure and biological considerations. Crop Sci. 25:721--728.
Hardie, W.J. and J.A. Considine. 1976. Response of grapes to water-deficit stress in particular stages of development. Am. J. Enol. Viticult. 27:55--61.
Harpaz, A., S. Gal, E.E. Goldschmidt, D. Rabber and E. Gelb. 1990. A model of the annual cycle of dry matter production and partition in citrus and other evergreen fruit trees. Acta Hortic. 276:149--155. Higgins, S.S., F.E. Larsen, R.B. Bendel, G.K. Radamaker, J.H. Bass-man, W.R. Bidlake and A. Wir. 1992. Comparative gas exchange characteristics of potted, glasshouse-grown almond, apple, fig, grape, olive, peach and Asian pear. Sci. Hortic. 52:313--329. Ho, L.C., R.I. Grange and A.J. Picken. 1987. An analysis of the
accumulation of water and dry matter in tomato fruit. Plant Cell Environ. 10:157--162.
Hsiao, T.C. 1973. Plant responses to water stress. Annu. Rev. Plant Physiol. 24:519--570.
Huguet, J.G. 1985. Appréciation de l’état hydrique d’une plante à partir des variations micrométriques de la dimension des fruits ou des tiges au cours de la journée. Agronomie 5:733--741.
Huguet, J.G. and M. Génard. 1995. Effet d’une contrainte hydrique sur le flux pédonculaire massique et la croissance de la pêche. Agrono-mie 15:97--107.
Jackson, J.E. 1966. Variability in fruit size and colour within individ-ual trees. East Malling Res. Stn, Annu. Rep., East Malling, UK, pp 110--115.
Johnson, R.W., M.A. Dixon and D.R. Lee. 1992. Water relations of the tomato during fruit growth. Plant Cell Environ. 15:947--953. Jones, H.G. and K.H. Higgs. 1982. Surface conductance and water
balance of developing apple (Malus pumila Mill.) fruits. J. Exp. Bot. 33:67--77.
Judd, M.J. and K.J. McAneney. 1987. Economic analysis of kiwifruit irrigation in a humid climate. In Advances in Irrigation, Vol. 4. Ed. D. Hilley. Academic Press, New York, pp 307--329.
Kvålseth, T.O. 1985. Cautionary about R2. Am. Stat. 39:279--285.
Lang, A. 1990. Xylem, phloem and transpiration flows in developing apple fruits. J. Exp. Bot. 41:645--651.
Lang, A. and M.R. Thorpe. 1989. Xylem, phloem and transpiration flows in a grape: application of a technique for measuring the volume of attached fruits to high resolution using Archimedes’ principle. J. Exp. Bot. 40:1069--1078.
Lang, A., M.R. Thorpe and W.R.N. Edwards. 1986. Plant water poten-tial and translocation. In Phloem Transport. Ed. J. Cronshaw, W.J. Lucas and R.T. Giaquinta, Alan R. Liss, Inc., New York, pp 193--194.
Lee, D.R. 1990. A unidirectional water flux model of fruit growth. Can. J. Bot. 68:1286--1290.
Lee, D.R., M.A. Dixon and R.W. Johnson. 1989. Simultaneous meas-urements of tomato fruit and stem water potential using in situ stem hygrometers. Can. J. Bot. 67:2352--2355.
Li, S.H., J.G. Huguet, P.G. Schoch and P. Orlando. 1989. Response of peach tree growth and cropping to soil water deficit at various phenological stages of fruit development. J. Hortic. Sci. 64:541--552.
Nguyen-The, C., R. Hugheney and M. Arnoux. 1989. Contribution à l’étude des voies de pénétration de parasites fongiques des nectar-ines Monilia laxa et Rhizopus stolonifer. Agronomie 9:271--276. Nobel, P.S. 1975. Effective thickness and resistance of the air
bound-ary layer adjacent to spherical plant parts. J. Exp. Bot. 26:120--130. Pavel, E.W. and T.M. DeJong. 1993. Estimating the photosynthetic contribution of developing peach (Prunus persica) fruits to their growth and maintenance carbohydrate requirements. Physiol. Plant. 88:331--338.
Schroeder, C.A. and P.A. Wieland. 1956. Diurnal fluctuations in size in various parts of the avocado tree and fruit. Proc. Am. Soc. Hortic. Sci. 68:253--258.
Scorza, R., L.G. May, B. Purnell and B. Upchurch. 1991. Differences in number and area of mesocarp cells between small- and large-fruited peach cultivars. J. Am. Soc. Hortic. Sci. 116:861--864. Selles, G. 1988. Effet de la contrainte hydrique sur la variation
jour-nalière du diamètre des troncs et des fruits. Application au déclenchement de l’irrigation du pêcher. Thesis Dissertation, Ecole Nationale Supérieure d’Agronomie, Montpellier, France 162 p. Simmoneau, T., R. Habib, J.P. Goutouly and J.G. Huguet. 1993.
Diurnal changes in stem diameter depend upon variations in water content: direct evidence in peach trees. J. Exp. Bot. 44:615--621. Walsh, C.S., D. Chalmers, A.N. Miller and A. Saunders. 1989.