Contact:
Equity & Index Valuation Division Phone: (6221) 7278 2380
“Disclaimer statement in the last page is an integral part of this report”
Source: Bloomberg, PEFINDO Equity & Index Valuation Division
Stock Information IDR
Ticker code SMSM
Market price as of August 18, 2014 4,505 Market price – 52 week high 4,905
Source: PT Selamat Sempurna Tbk, PEFINDO Equity & Index Valuation Division
“Disclaimer statement in the last page is an integral part of this report”
Selamat Sempurna, Tbk
Target price adjustment
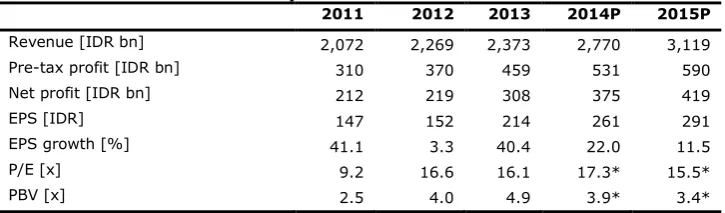
We have made several adjustments to our previous forecast and adjusted our target price to IDR4,835–IDR5,525 per share, based on the following considerations:
SMSM benefitted from a weakening Rupiah and the positive development of the global automotive market. Its exports contribution to net revenue rose from 59% in FY2012 to 62% in FY2013 and 68% in 1H2014. Export net revenue rose 11% in FY2013 and 37% during 1H2014, while domestic net revenue slightly declined, mainly due to weakening carrosserie sales.
Export sales to almost all major countries grew by double digit in 1H2014, indicating the strong demand of the global automotive market. Sales to the US, its largest export destination, jumped 33% year-on-year (YoY) in line with the improving automotive market there. Accordingly, we are revising up our revenue projections in the previous report, particularly for FY2014 and FY2015 by 7% and 5%, respectively.
We expect SMSM’s gross margin to stay at more than 26%, thanks to declining steel prices, improving export markets, and a weakening Rupiah, while the performance of its subsidiary, Hydraxle Perkasa, is still unfavorable.
As SMSM maintains modest capex, if we assume going forward its dividend payout ratio at 60%, and there are no plans for large cash acquisitions, it will be a net-cash company in 2016, based on our estimates. Further, we expect
SMSM’s return on equity (ROE) will remain thick at more than 30% with a stronger balance sheet, and its EBITDA will continue to climb.
In June 2014, SMSM acquired PT Cahaya Mitra Gemiliang through its subsidiary PT Prapat Tunggal Cipta (PTC), its sole distributor for the local market. CMG is
SMSM’s distributor in the aftermarket for North Sumatra and Aceh. The
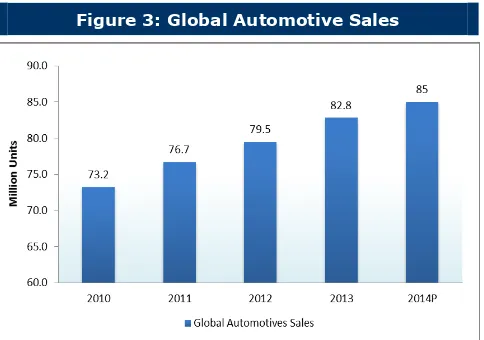
Global automotive sales in 2013 hit a new record, exceeding 80 million vehicles on the back of encouraging sales in China and the US. China recorded 21.9 million new vehicles sales and grew 15% YoY, while the US market booked sales of 15.6 million vehicles, the highest in six years. It is estimated that global automotive sales will hit 85 million vehicles this year, and 100 million in 2018, with China forecasted to contribute one-third. Emerging markets such as India, Russia, Brazil, Indonesia, Argentina, and Chile will be the growth drivers for global sales. Indonesia is the second largest car market in ASEAN after Thailand, with sales reaching 1.23 million in 2013. Indonesian automotive products have been exported to more than 80 countries
worldwide. Low cost green cars (LCGC) will be the booster for Indonesia’s automotive
industry, particularly in the ASEAN Economic Community (AEC) era which will come into play in 2015, by helping issues such as increasing gasoline consumption and pollution. There is a great opportunity for SMSM to grow in the future, and we believe it will actively utilize the momentum.
Source: PT Selamat Sempurna Tbk, PEFINDO Equity & Index Valuation Division Estimates
* Based on SMSM’s share price as of August 18, 2014 – IDR4,505/share
“Disclaimer statement in the last page is an integral part of this report” www.pefindo.com
Selamat Sempurna, Tbk
Positive development of domestic automotive industry
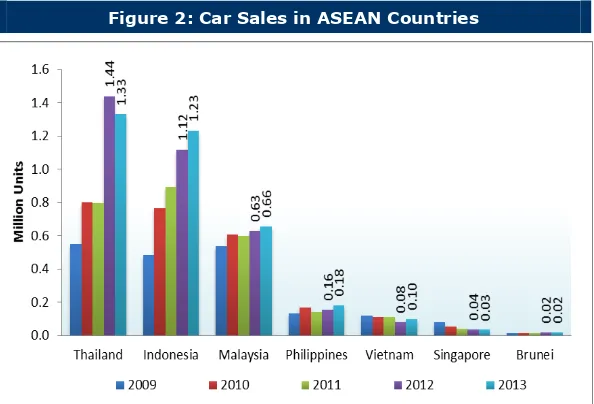
Indonesia is the second largest car market in ASEAN after Thailand, with sales reaching 1.23 million in 2013, only slightly behind Thailand’s 1.33 million. This year, as the Thai market is shrinking due to political instability, Indonesia is estimated to take over as the top position. Domestic car sales growth is estimated to stay positive, but there are challenges in the domestic market such as the weakening foreign exchange, a high interest rate environment, an increasing electricity tariff, and uncertainty over the minimum wage rise. Meanwhile, in the export market, the competitiveness of Indonesia’s automotive products is rising, and export destinations have reached more than 80 countries worldwide. Four-wheel (4W) completely build up (CBU) or readily made exports in 2013 reached 170,000 units while completely knock down (CKD) or ready to assemble accounted for 105,000 units. This year, it is expected to hit 200,000 units and 110,000 units for CBU and CKD exports, respectively.
Figure 1: Car Production in ASEAN Countries
Source: ASEAN Automotive Federation, Kontan, PEFINDO Equity & Index Valuation Division
LCGC to boost automotive industry in the AEC era
With an increasing number of cars on the road, demand for environmentally friendly cars is on the rise, with increasing gasoline consumption and pollution the main issues. Therefore low cost green cars (LCGCs) will boost Indonesia’s automotive industry, particularly for the ASEAN Economic Community (AEC) which will begin in 2015. In 2013, sales of environmentally friendly cars in ASEAN reached 275,000 units, and it is estimated that they will grow 15%-20% with a market share of 11%-12% within the next 2-3 years.
Figure 2: Car Sales in ASEAN Countries
Source: ASEAN Automotive Federation, Kontan, PEFINDO Equity & Index Valuation Division
“Disclaimer statement in the last page is an integral part of this report”
Selamat Sempurna, Tbk
Global auto market: a new record
In 2013, global automotive sales exceeded 80 million vehicles for the first time, reaching 82.8 million vehicles, a rise of 4.2% YoY, based on IHS Automotive research. China, the fastest growing automotive market, recorded 21.9 million new sales, growing 15% YoY. The US market booked sales of 15.6 million, up 7.6% YoY and the highest for six years, due to strong sales of large vehicles in the midst of a low interest rates environment.
Figure 3: Global Automotive Sales
Source: IHS Automotive, PEFINDO Equity & Index Valuation Division
It is estimated that global automotive sales will hit 85 million vehicles in 2014. The US market is expected to grow 4% as last year’s sales were high, while the European market will have a modest rebound due to a lingering price war. In Japan, as the third largest automotive market, there will be decreasing sales due to the consumption-tax rise from 5% to 8%. China and India will be the main drivers of sales growth, with the markets expected to expand 10%-11% this year. Looking forward, it is estimated that the global automotive market will record sales of 100 million vehicles in 2018 with China forecasted to contribute one-third. Emerging markets such as India, Russia, Brazil, Indonesia, Argentina, and Chile will be the growth driver for global sales.
New acquisition
In June 2014, SMSM acquired PT Cahaya Mitra Gemilang through its subsidiary PT Prapat Tunggal Cipta (PTC), its sole distributor for the local market. CMG is SMSM’s distributor in the aftermarket for North Sumatra and Aceh. With an acquisition value of IDR10.5 billion, the Company expects to strengthen its vertical integration particularly in the downstream sector. Although the acquisition is small in terms of price, we believe it will have a positive impact on SMSM’s performance, particularly in the domestic market.
Source: PT Selamat Sempurna Tbk, PEFINDO Equity & Index Valuation Division
Acknowledgement
“Disclaimer statement in the last page is an integral part of this report” www.pefindo.com
Selamat Sempurna, Tbk
Benefits of weakening Rupiah, improving global automotive market
SMSM’s revenue in 2013 was in line with our estimate in our previous report. Based on net revenue, it saw an increasing export contribution from 59% in FY2012 to 62% in FY2013 and 68% in 1H2014, benefitting from the weakening Rupiah and the positive development of the global automotive market. Export net revenue rose 11% YoY in FY2013 and 37% YoY during 1H2014, while domestic net revenue fell 7% YoY. Domestic sales were mainly influenced by carrosserie sales that fell 33% YoY for FY2013 and 19% YoY for 1H2014, in line with the mining and crude palm oil (CPO) industries that remained week due to low commodity prices. The weakening Rupiah benefitted exporters as it meant the average selling price in Rupiah was higher.
Figure 4: Net Revenue Figure 5: Domestic and Export Market
Contribution to Net Revenue
Source: PT Selamat Sempurna Tbk, PEFINDO Equity & Index Valuation Division Estimates
Strong export market improvement
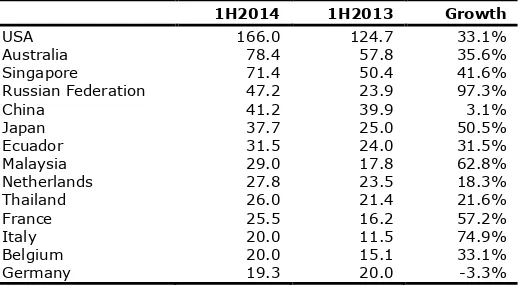
SMSM’s export markets are showing strong improvement, as shown by an export sales rise of 37% YoY in 1H2014. Export sales to almost all major countries grew by double digits, indicating the strong demand in the global automotive market. Sales to the US, the largest export destination, jumped 33% YoY in line with the improving US automotive market. Other countries that will be the main drivers of the export market are Australia, Singapore (as a trading hub), Russia, Japan, and Ecuador. For the European market, sales to Germany declined in accordance with the country’s developing automotive industry, but countries such as the Netherlands, France, Italy, and Belgium rose, giving hope for a stronger export market in Europe.
Table 3: Top Export Destinations
Source: PT Selamat Sempurna Tbk, PEFINDO Equity & Index Valuation Division
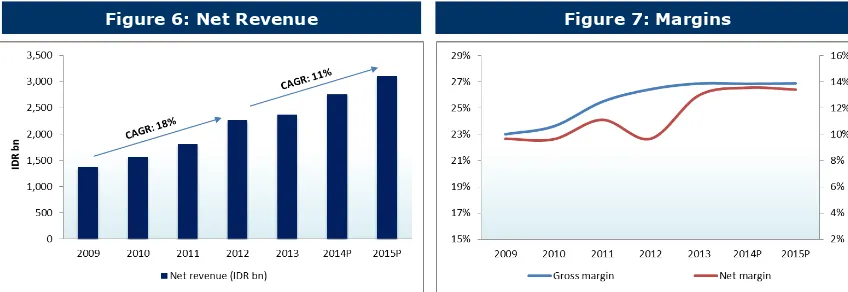
Revising revenue up, solid margins
Looking at the encouraging export market, we are revising up our revenue projections in the previous report, particularly for FY2014 and FY2015 by 7% and 5%, and expect SMSM will maintain its consecutive growth. Despite increasing raw material prices, SMSM has the power to bargain to raise the selling prices to its distributors. Some 30%-40% of SMSM’s cost of goods sold (COGS) comes from imported raw materials. However, currently it is benefiting from declining steel prices, an improving export market, and a weakening Rupiah. We expect these factors will support SMSM’s gross margin to stay at more than 26%, as it was in FY2012 and FY2013, while the performance of its subsidiary, Hydraxle Perkasa, is still unfavorable.
“Disclaimer statement in the last page is an integral part of this report”
Selamat Sempurna, Tbk
Figure 6: Net Revenue Figure 7: Margins
Source: PT Selamat Sempurna Tbk, PEFINDO Equity & Index Valuation Division Estimates
Stronger balance sheet
SMSM is still a dividend paying company and for FY2013, its payout ratio was 54%. We expect it will continue to distribute the dividend with a payout ratio of 60% or more in the future. It will also maintain modest capex at IDR100 billion. With such conditions, and if there are no acquisition plans requiring a large level of cash, it will be a cash rich company within several years. It has only an IDR80 billion outstanding bond that will mature in July 2015. Therefore, based on our calculations, SMSM will be a net-cash company in 2016. We also expect its ROE will remain heavy at more than 30% with a stronger balance sheet, and its EBITDA will continue to climb.
Figure 8: Net Cash Figure 9: EBITDA-to-Debt and ROE
“Disclaimer statement in the last page is an integral part of this report” www.pefindo.com
Selamat Sempurna, Tbk
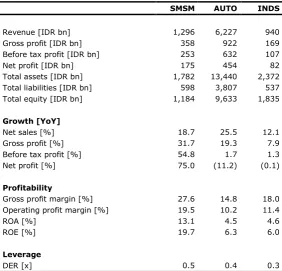
Table 4: Performance of SMSM and Its Peers in 1H2014
SMSM AUTO INDS
Revenue [IDR bn] 1,296 6,227 940
Gross profit [IDR bn] 358 922 169
Before tax profit [IDR bn] 253 632 107
Net profit [IDR bn] 175 454 82
Total assets [IDR bn] 1,782 13,440 2,372
Total liabilities [IDR bn] 598 3,807 537
Total equity [IDR bn] 1,184 9,633 1,835
Growth [YoY]
Net sales [%] 18.7 25.5 12.1
Gross profit [%] 31.7 19.3 7.9
Before tax profit [%] 54.8 1.7 1.3
Net profit [%] 75.0 (11.2) (0.1)
Profitability
Gross profit margin [%] 27.6 14.8 18.0
Operating profit margin [%] 19.5 10.2 11.4
ROA [%] 13.1 4.5 4.6
ROE [%] 19.7 6.3 6.0
Leverage
DER [x] 0.5 0.4 0.3
Source: Bloomberg, PT Selamat Sempurna Tbk, PEFINDO Equity & Index Valuation Division
“Disclaimer statement in the last page is an integral part of this report”
Selamat Sempurna, Tbk
VALUATION
Methodology
We applied the discounted cash flow (DCF) method as the main valuation approach considering that income growth is the value driver for SMSM, instead of asset growth.
Furthermore, we also applied the guideline company method (GCM) as a comparison method.
This valuation is based the price of 100% of shares as of August 18, 2014, using SMSM’s Financial Report of June 30, 2014 as the basis for the fundamental analysis.
Value estimation
We used a cost of capital and cost of equity of 9.9% and 10.4% based on the following assumptions:
Table 5: Assumptions
Risk free rate [%]* 8.3
Risk premium [%]* 3.0
Beta [x]** 0.7
Cost of equity [%] 10.4
Marginal tax rate [%] 23.5
WACC [%] 9.9
Source: Bloomberg, PEFINDO Equity & Index Valuation Division Estimates * as of August 18, 2014
** PEFINDO Beta as of August 14, 2014
The target price for 12 months, based on the valuation as per August 18, 2014, is as follows:
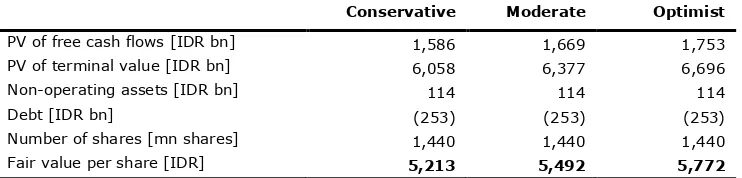
Using the DCF method with a discount rate assumption of 9.9%, it is IDR5,213–IDR5,772 per share.
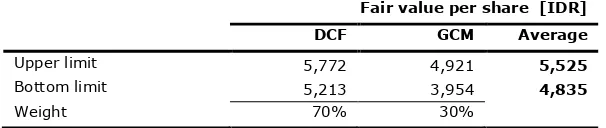
Using the GCM method (P/E 18.9x and P/Sales 2.1x), it is IDR3,954– IDR4,921 per share.
In order to obtain a value which represents both value indications, we have weighted both the DCF and the GCM methods by 70%:30%.
Based on the above calculation, the target price of SMSM for 12 months is IDR4,835–IDR5,525 per share.
Table 6: Summary of DCF Method Valuation
Conservative Moderate Optimist
PV of free cash flows [IDR bn] 1,586 1,669 1,753
PV of terminal value [IDR bn] 6,058 6,377 6,696
Non-operating assets [IDR bn] 114 114 114
Debt [IDR bn] (253) (253) (253)
Number of shares [mn shares] 1,440 1,440 1,440
Fair value per share [IDR] 5,213 5,492 5,772
Source: PEFINDO Equity & Index Valuation Division Estimates
“Disclaimer statement in the last page is an integral part of this report” www.pefindo.com
Selamat Sempurna, Tbk
Table 7: GCM Comparison
SMSM AUTO Average
P/E [x] 17.4 20.3 18.9
P/Sales [x] 2.5 1.6 2.1
Source: Bloomberg, PEFINDO Equity & Index Valuation Division
Table 8: Summary of GCM Method Valuation
Multiple [x] Est. EPS [IDR] Est. sales/share [IDR] Value [IDR]
P/E 18.9 261 - 4,921
P/Sales 2.1 - 1,924 3,954
Source: Bloomberg, PEFINDO Equity & Index Valuation Division Estimates
Table 9: Fair Value Reconciliation
Fair value per share [IDR]
DCF GCM Average
Upper limit 5,772 4,921 5,525
Bottom limit 5,213 3,954 4,835
Weight 70% 30%
Source: PEFINDO Equity & Index Valuation Division Estimates
“Disclaimer statement in the last page is an integral part of this report”
Selamat Sempurna, Tbk
Table 10: Consolidated Statement of Comprehensive Income
Source: PT Selamat Sempurna Tbk, PEFINDO Equity & Index Valuation Division Estimates
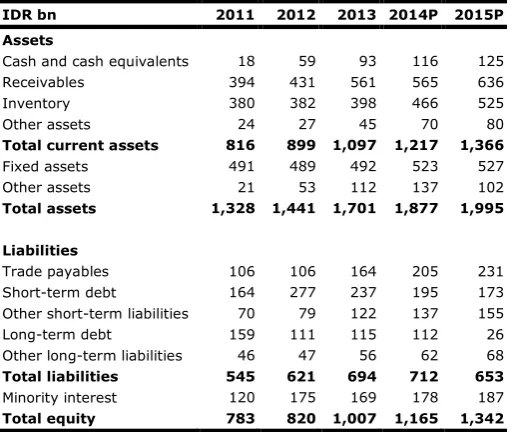
Table 11: Consolidated Statement of Financial Position
IDR bn 2011 2012 2013 2014P 2015P
Source: PT Selamat Sempurna Tbk, PEFINDO Equity & Index Valuation Division Estimates
Figure 10: P/E and P/BV
Source: PT Selamat Sempurna Tbk, PEFINDO Equity & Index Valuation Division
Figure 11: ROA, ROE and Total Assets Turnover
Source: PT Selamat Sempurna Tbk, PEFINDO Equity & Index Valuation Division
Table 12: Key Ratios
“Disclaimer statement in the last page is an integral part of this report” www.pefindo.com
Selamat Sempurna, Tbk
DISCLAIMER
This report was prepared based on trusted and reliable sources. Nevertheless, we do not guarantee its completeness, accuracy and adequacy. Therefore, we are not responsible for any investment decisions made based on this report. All assumptions, opinions and predictions were solely our internal judgments as of the reporting date, and those judgments are subject to change without further notice.
We are not responsible for any mistakes or negligence that occur by using this report. Recent performance cannot always be used as a reference for future outcome. This report does not offer a recommendation to purchase or hold particular shares. This report might not be suitable for some investors. All opinions in this report have been presented fairly as of the issuing date with good intentions; however, they could change at any time without further notice. The price, value or income of each share of the Company stated in this report might be lower than investor expectations, and in vestors may obtain returns lower than the invested amount. Investment is defined as the probable income that will be received in the future; nonetheless such returns may fluctuate. As for companies whose shares are denomi nated in a currency other than Rupiah, foreign exchange fluctuation may reduce their share value, price or the returns for investors. This report does not contain any information for tax considerations in investment decision -making.
The share price target in this report is a fundamenta l value, not a fair market value or a transaction price reference required by regulations.
The share price target issued by the PEFINDO Equity & Index Valuation Division is not a recommendation to buy, sell or hold particular shares. It should not be cons idered as investment advice from the PEFINDO Equity & Index Valuation Division and its scope of service to some parties, including listed companies, financial advisors, brokers, investment banks, financial institutions and intermediaries, does not correlat e with receiving rewards or any other benefits from such parties.
This report is not intended for any particular investor and cannot be used as part of an objective investment analysis of particular shares, an investment recommendation, or an investment s trategy. We strongly recommend investors to consider the suitability of the situation and conditions before making a decision in relation with the figures in this report. If necessary, consult with your financial advisor.
PEFINDO keeps the activities of the Equity Valuation Division separate from its Ratings Division to preserve the independence and objectivity of its analytical processes and products. PEFINDO has established policies and procedures to maintain the confidentiality of non -public information received in connection with each analytical process. The entire process, methodology and the database used in the preparation of the Reference Share Price Target Report as a whole are different from the processes, methodologies and databases used by PEFINDO in issuing ratings.
This report was prepared and composed by the PEFINDO Equity & Index Valuation Division with the objective of enhancing the transparency of share prices of listed companies in the Indonesia Stock Exchange (IDX). This report is also free of influence from any other party, including pressure or force either from the IDX or the listed company reviewed. PEFINDO Equity & Index Valuation Division earns a reward amounting to IDR20 million from the IDX and the reviewed company for issuing this report twice a year. For further information, please visit our Website at http://www.pefindo.com