To: Shareholders
The DBS Group Holdings Ltd (“DBSH” or “the Company”) Board of Directors report audited financial results for the year ended December 31, 2003.
The Directors have recommended a gross final dividend of 16 cents for each DBSH non-voting convertible preference share (“CPS”), each DBSH non-voting redeemable CPS, and for each DBSH ordinary share. All final dividends will be paid less 22% Singapore income tax. Details of the proposed dividends in respect of the financial year ended December 31 are as follows:
In S$millions 2003 2002
DBSH Non-voting CPS
Interim dividend* of 14 cents less 22% tax (2002: 14 cents less 22% tax) 2 2 Final dividend of 16 cents less 22% tax (2002: 16 cents less 22% tax) 3 3
5 5
DBSH Non-voting redeemable CPS
Interim dividend* of 14 cents less 22% tax (2002: 14 cents less 22% tax) 7 7 Final dividend of 16 cents less 22% tax (2002: 16 cents less 22% tax) 8 8
15 15
DBSH Ordinary share
Interim dividend* of 14 cents less 22% tax (2002: 14 cents less 22% tax) 161 161 Final dividend of 16 cents less 22% tax (2002: 16 cents less 22% tax) 183 183
344 344
* Interim dividends were paid to entitled shareholders on August 28, 2003.
The proposed final dividends will be payable on May 19, 2004, subject to shareholders’ approval at the Annual General Meeting to be held on April 30, 2004. Notice is hereby given that the Share Transfer Books and Register of Members of the Company for ordinary shares will be closed from May 7, 2004 to May 10, 2004, both dates inclusive. Duly completed transfers received by the Company's Registrar, Barbinder & Co Pte Ltd of 8 Cross Street #11-00 PWC Building, Singapore 048424 up to 5.00 p.m. on May 6, 2004 will be registered to determine shareholders' entitlement to the proposed final dividends. In respect of ordinary shares in the securities accounts with The Central Depository (Pte) Limited (“CDP”), the final dividends will be paid by DBSH to CDP, which will in turn distribute the dividend entitlements to shareholders.
Contents
Page
Financial Highlights 2
Financial Review 3
Net Interest Income and Net Interest Margin 5
Non-Interest Income 6
Operating Expenses 7
Goodwill 7
Provision Charge 8
Asset Quality 8
Balance Sheet 9
Customer Deposits 10
Customer Loans 10
Capital Adequacy Ratio 11
Unrealised Valuation Surpluses 11
Geographical Segment Analysis 12
Business Segment Analysis 13
Subsequent Event 15
Comparatives 15
Appendix I: Audited Consolidated Profit and Loss Account Appendix II: Audited Consolidated Balance Sheet
Appendix III: Audited Balance Sheet of DBS Group Holdings Ltd
Appendix IV: Audited Consolidated Statement of Changes in Shareholders’ Equity
Appendix V: Audited Statement of Changes in Shareholders’ Equity of DBS Group Holdings Ltd Appendix VI: Audited Consolidated Cash Flow Statement
Appendix VII: Changes in Accounting Policy Appendix VIII: Selected Notes to the Accounts
1. Issuance of Ordinary Shares 2. Earnings Per Ordinary Share
3. Loan and Investment Exposures to Malaysia, Indonesia, Thailand, Korea, The Philippines (Regional Countries), Hong Kong and China
4. Non-Performing Loans and Provisions 5. Financial Derivatives
Financial Highlights
DBS Group Holdings Ltd (“DBSH”) prepares its consolidated DBSH Group (“Group”) financial statements in accordance with Singapore Financial Reporting Standards (“FRS”).
S$millions
Year 2003
Year 20021/
4th Qtr 2003
4th Qtr 20021/
3rd Qtr 20031/ For the period
Income before operating expenses 4,198 4,146 1,053 1,054 1,113
Operating profit before goodwill amortisation and
provisions 2,357 2,295 571 583 655
Operating profit before provisions 1,927 2,017 461 510 548
Net profit before taxation 1,437 1,518 397 335 405
Net profit attributable to members 1,025 1,097 292 287 291
Net profit attributable to members (excluding
goodwill amortisation) 1,455 1,375 402 360 398
At period-end
Shareholders' funds 14,896 14,237 14,896 14,237 14,614
Interest bearing assets 133,451 125,132 133,451 125,132 135,268
Customer loans 2/ 64,335 60,709 64,335 60,709 63,902
Customer deposits 108,041 101,315 108,041 101,315 107,056
Total assets 159,595 149,445 159,595 149,445 160,231
Per share (in S$)
Basic earnings excluding goodwill amortisation 3/ 0.98 0.93 1.08 0.97 1.07
Basic earnings 3/ 0.68 0.74 0.78 0.77 0.78
Diluted earnings 3/ 0.66 0.71 0.75 0.74 0.75
Net asset value at period-end
(i) based on existing ordinary share capital 9.75 9.30 9.75 9.30 9.56
(ii) assuming non-voting convertible preference shares (“CPS”) and non-voting redeemable CPS
are converted to ordinary shares 9.58 9.16 9.58 9.16 9.39
Net tangible asset value at period-end 4/ 4.73 4.07 4.73 4.07 4.46
Performance ratios
(%)
Year 2003
Year 20021/
4th Qtr 2003
4th Qtr 20021/
3rd Qtr 20031/ On a GAAP basis
Return on assets 3/ 0.66 0.73 0.73 0.77 0.73
Return on equity 3/ 7.04 7.94 7.93 8.14 8.00
Excluding goodwill amortisation
Return on assets 3/ 0.94 0.91 1.01 0.97 1.00
Return on equity 3/ 9.99 9.95 10.91 10.20 10.93
Return on tangible equity 3/ 5/ 20.68 18.75 21.98 18.34 22.49
Efficiency and revenue mix ratios
Cost-to-income ratio (excluding goodwill
amortisation) 43.9 44.6 45.8 44.7 41.2
As a percentage of total operating income:
- net interest income 56.6 63.8 59.6 60.9 52.8
- non-interest income 43.4 36.2 40.4 39.1 47.2
BIS Capital ratios (at period-end)
- Tier 1 capital 10.5 10.3 10.5 10.3 10.5
- Total capital 15.1 15.5 15.1 15.5 15.2
Financial Review
DBSH Group’s operating profit before goodwill amortisation and provisions for 2003 was S$2.357 billion, a 2.7% increase over 2002. The improved year-on-year performance was principally due to an increase in non-interest income, driven by higher fee and commission income, stronger sales of treasury investment products and better trading income. At the same time, net interest income was lower, due to a decline in interest margins. After deducting S$430 million goodwill amortisation and S$541 million provision charge, net profit attributable to members (“NPAM”) was 6.6% lower, at S$1.025 billion. The cost-to-income ratio (excluding goodwill amortisation) improved to 43.9% compared to 44.6% for 2002.
Compared to fourth quarter 2002 (“4th Qtr 2002”), fourth quarter 2003 (“4th Qtr 2003”) operating profit before goodwill amortisation and provisions was 2.1% lower, at S$571 million. This was mainly due to lower net interest income and higher operating expenses. The reduction in net interest income to S$628 million was a result of intense competition in the loan market and a low interest rate environment. Operating expenses increased 2.3% to S$482 million, mainly attributable to higher revenue-related expenses as a result of increased business activities. After deducting S$110 million goodwill amortisation and S$82 million provision charge, NPAM showed a 1.7% increase over 4th Qtr 2002 and a marginal 0.3% increase over third quarter 2003 (“3rd Qtr 2003”). The cost-to-income ratio (excluding goodwill amortisation) was 45.8% in 4th Qtr 2003, 44.7% in 4th Qtr 2002 and 41.2% in 3rd Qtr 2003.
DBSH Group adopted accounting policy changes during the year, relating mainly to the measurement of trading and investment securities (as detailed in Appendix VII). If these accounting policies had not been adopted, 2003 NPAM would have been S$1.018 billion, compared to the S$1.017 billion previously reported for 2002.
Profit and Loss Account
S$millions
Year 2003
Year 20021/
4th Qtr 2003
4th Qtr 20021/
3rd Qtr 20031/
Net interest income 2,375 2,645 628 642 588
Non-interest income 1,823 1,501 425 412 525
Income before operating expenses 4,198 4,146 1,053 1,054 1,113
Operating expenses (1,841) (1,851) (482) (471) (458)
Operating profit before goodwill amortisation and
provisions 2,357 2,295 571 583 655
Goodwill amortisation (430) (278) (110) (73) (107)
Operating profit before provisions 1,927 2,017 461 510 548
Provisions (541) (544) (82) (181) (154)
Operating profit 1,386 1,473 379 329 394
Share of profits less losses of associated and joint venture
companies 51 45 18 6 11
Net profit before taxation 1,437 1,518 397 335 405
Taxation (349) (311) (85) (26) (99)
Minority interests (63) (110) (20) (22) (15)
Net profit attributable to members (“NPAM”) 1,025 1,097 292 287 291
NPAM excluding goodwill amortisation 1,455 1,375 402 360 398
Note:
DBS Bank (Hong Kong) Limited
The acquisition of 71.6% of Dao Heng Bank Group Limited (“DHG”) through DBS Diamond Holdings Limited (“DDH”), a subsidiary of DBS Bank Ltd, was completed on June 29, 2001. DBS Bank Ltd exercised its call option to acquire the remaining 28.4% of the DDH shares on January 10, 2003 following which DHG became a wholly-owned subsidiary of DBS Bank Ltd. Pursuant to the Hong Kong legislative and regulatory requirements, the legal merger of Dao Heng Bank Limited, Overseas Trust Bank Limited and DBS Kwong On Bank Limited was completed on July 21, 2003. The merged entity was named DBS Bank (Hong Kong) Limited on the same date.
Operating profit for 2003 showed a 38.1% year-on-year increase, mainly due to higher non-interest income and lower impairment charges for fixed assets. Non-interest income rose 40.7%, due to higher sales of treasury investment products and better trading income. Net interest income, however, was lower, and provisions were higher. The reduction in net interest income was mainly attributable to sluggish loan demand. Provisions were 9.8% higher than that for 2002, when there was a significant write-back in loan provisions. Operating expenses declined 2.9%, mainly through the streamlining of operations.
Compared to 4th Qtr 2002, operating profit in 4th Qtr 2003 was 143.5% higher due to higher operating income and lower provisions. Net interest income increased 8.2% mainly due to the wider spread between the Prime rate and HIBOR1/. Non-interest income increased 49.3% mainly due to higher sales of treasury investment products. Provision charge was 58.1% lower due to improving economic conditions and property prices.
Profit and Loss Account (Based on Hong Kong Generally Accepted Accounting Principles)2/ 3/
S$millions
Year 2003
Year 2002
4th Qtr 2003
4th Qtr 2002
3rd Qtr 2003
Net interest income 800 812 211 195 199
Non-interest income 384 273 106 71 113
Income before operating expenses 1,184 1,085 317 266 312
Operating expenses (476) (490) (123) (125) (118)
Impairment of fixed assets (6) (53) - (10) (3)
Operating profit before provisions 702 542 194 131 191
Provisions (180) (164) (26) (62) (51)
Operating profit 522 378 168 69 140
Net profit before taxation 523 384 168 68 139
Net profit after taxation 440 330 146 70 116
Notes:
1/ HIBOR: Hong Kong Interbank Offer Rate
2/ The exchange rate used for all comparative periods is HK$1 = S$0.2190519.
3/ In the preparation of the consolidated DBSH Group accounts, appropriate adjustments were made to bring DBS Bank (Hong Kong) Limited accounts in line with Singapore Financial Reporting Standards (“FRS”). Under FRS, the contribution from DBS Bank (Hong Kong) Limited was as follows:
S$millions
Year 2003
Year 2002
4th Qtr 2003
4th Qtr 2002
3rd Qtr 2003
Net profit before taxation 530 392 179 84 148
Exhibit 1
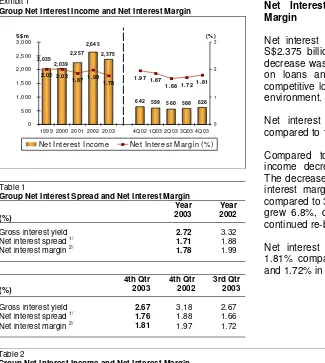
Group Net Interest Income and Net Interest Margin
2,375
599 560 588 628 642 2,645 2,257 2,039 2,035 2.02
1.87 1.991.78 1.97 1.87
1.68 1.72 1.81
2.02 0 500 1,000 1,500 2,000 2,500 3,000
1999 2000 2001 2002 2003 4Q02 1Q03 2Q03 3Q03 4Q03
S$m 0 1 2 3 (% )
[image:8.595.67.548.59.694.2]Net Interest Income Net Interest Margin (% )
Table 1
Group Net Interest Spread and Net Interest Margin
(%)
Year 2003
Year 2002
Gross interest yield 2.72 3.32
Net interest spread 1/
1.71 1.88
Net interest margin 2/
1.78 1.99 (%) 4th Qtr 2003 4th Qtr 2002 3rd Qtr 2003
Gross interest yield 2.67 3.18 2.67
Net interest spread 1/
1.76 1.88 1.66
Net interest margin 2/
1.81 1.97 1.72
Net Interest Income and Net Interest Margin
Net interest income for 2003 fell 10.2% to S$2.375 billion, as compared to 2002. The decrease was mainly due to narrower spread on loans and debt securities in a highly competitive loan market and low interest rate environment.
Net interest margin was 1.78% for 2003 compared to 1.99% for 2002.
[image:8.595.74.399.73.436.2]Compared to 4th Qtr 2002, net interest income decreased 2.2% to S$628 million. The decrease was mainly due to a decline in interest margin from mortgages. However, compared to 3rd Qtr 2003, net interest income grew 6.8%, due to lower funding costs and continued re-balancing of asset composition. Net interest margin for 4th Qtr 2003 was 1.81% compared to 1.97% in 4th Qtr 2002 and 1.72% in 3rd Qtr 2003.
Table 2
Group Net Interest Income and Net Interest Margin
Year 2003 Year 2002
S$millions Avg4/ balance Interest Avg rate (%) Avg balance Interest Avg rate (%)
Customer loans and advances 62,593 2,342 3.74 64,221 2,705 4.21
Interbank items 38,323 398 1.04 45,055 766 1.70
Securities 3/
32,883 900 2.74 23,375 935 4.00
Total interest bearing assets 133,799 3,640 2.72 132,651 4,406 3.32
Net interest income/margin 2,375 1.78 2,645 1.99
4th Qtr 2003 4th Qtr 2002 3rd Qtr 2003
S$millions Avg balance Interest Avg rate (%) Avg balance Interest Avg rate (%) Avg balance Interest Avg rate (%)
Customer loans and advances 63,965 575 3.57 61,735 647 4.16 63,593 571 3.56
Interbank items 34,542 88 1.01 41,354 167 1.60 37,018 97 1.04
Securities 3/
38,876 262 2.67 25,418 216 3.36 34,761 243 2.77
Total interest bearing assets 137,383 925 2.67 128,507 1,030 3.18 135,372 911 2.67
Net interest income/margin 628 1.81 642 1.97 588 1.72
Notes:
1/ Net interest spread is the difference between the average interest rate earned on average interest-earning assets and the average interest rate paid on average interest-bearing funds. For the quarters, it is computed on an annualised basis.
2/ Net interest margin is net interest income expressed as a percentage of average interest-earning assets. For the quarters, it is computed on an annualised basis.
Table 3
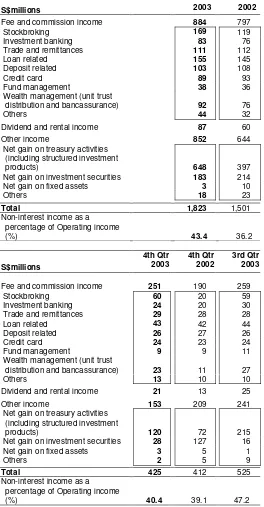
Group Non-Interest Income
S$millions
Year 2003
Year 2002
Fee and commission income 884 797
Stockbroking 169 119
Investment banking 83 76
Trade and remittances 111 112
Loan related 155 145
Deposit related 103 108
Credit card 89 93
Fund management 38 36
Wealth management (unit trust
distribution and bancassurance) 92 76
Others 44 32
Dividend and rental income 87 60
Other income 852 644
Net gain on treasury activities (including structured investment
products) 648 397
Net gain on investment securities 183 214
Net gain on fixed assets 3 10
Others 18 23
Total 1,823 1,501
Non-interest income as a percentage of Operating income
(%) 43.4 36.2
S$millions 4th Qtr 2003 4th Qtr 2002 3rd Qtr 2003
Fee and commission income 251 190 259
Stockbroking 60 20 59
Investment banking 24 20 30
Trade and remittances 29 28 28
Loan related 43 42 44
Deposit related 26 27 26
Credit card 24 23 24
Fund management 9 9 11
Wealth management (unit trust
distribution and bancassurance) 23 11 27
Others 13 10 10
Dividend and rental income 21 13 25
Other income 153 209 241
Net gain on treasury activities (including structured investment
products) 120 72 215
Net gain on investment securities 28 127 16
Net gain on fixed assets 3 5 1
Others 2 5 9
Total 425 412 525
Non-Interest Income
Fee and commission income in 2003 increased 10.9% to S$884 million over 2002. The increase was due to higher stockbroking fees following a buoyant equity market in the second half of 2003, improved wealth management sales and loan related earnings from increased syndicated loan activities. Compared to 4th Qtr 2002, fee and commission income rose 32.1% due to increases in various categories of fee income, reflecting stronger economic activity. Fee and commission income was 3.1% lower than 3rd Qtr 2003 due to lower fees from investment banking and wealth management products. Compared to 2002, other income for 2003 increased 32.3% to S$852 million, due to higher gains from interest rate trading and sale of investment products.
Other income in 4th Qtr 2003 was lower than 4th Qtr 2002 due to the one-off S$96 million profit from the sale of NatSteel Ltd shares in 2002. Compared to 3rd Qtr 2003, other income was lower due to lower gains from interest rate and bonds trading.
With the change in accounting policy (see Appendix VII), realised gains from Singapore Government securities held as investments were included in “Net gain on investment securities”.
Non-interest income as a percentage of Operating income
Table 4
Group Operating Expenses
S$millions
Year 2003
Year 2002
Staff costs 865 911
Occupancy expenses 203 219
Technology-related expenses 287 228
Revenue-related expenses 183 140
Others 303 353
Total 1,841 1,851
Cost-to-income ratio (%) (excluding goodwill
amortisation) 43.9 44.6
Staff headcount number (at
period-end) 12,144 12,035
S$millions 4th Qtr 2003 4th Qtr 2002 3rd Qtr 2003
Staff costs 217 225 219
Occupancy expenses 54 58 48
Technology-related expenses 74 66 68
Revenue-related expenses 53 32 48
Others 84 90 75
Total 482 471 458
Cost-to-income ratio (%) (excluding goodwill
amortisation) 45.8 44.7 41.2
Staff headcount number (at
period-end) 12,144 12,035 12,026
Operating Expenses
Excluding goodwill amortisation, year-on-year (“YOY”) operating expenses declined 0.5%. Staff costs showed a 5% decrease to S$865 million, largely due to staff reduction resulting from the outsourcing of certain technology-related functions in the Group. The increase in technology-related expenses was mainly due to investments in new systems, capacity enhancements to meet customer demands and payment of outsourcing fees. Revenue-related expenses, which include commission paid to remisiers and brokerage expenses, increased as a result of higher transaction volumes.
YOY, the Group’s cost-to-income ratio (excluding goodwill amortisation) was 43.9% for 2003 compared to 44.6% for 2002.
Fourth quarter 2003 operating expenses (excluding goodwill amortisation) rose 2.3% and 5.2% compared to 4th Qtr 2002 and 3rd Qtr 2003 respectively. The increase over 4th Qtr 2002 was attributable to higher revenue-related expenses as a result of improved equity market activities. Compared to 3rd Qtr 2003, the increase was due to higher professional fees incurred for technology-related projects, relocation and advertising expenses.
Cost-to-income ratio (excluding goodwill amortisation) was 45.8% in 4th Qtr 2003. Table 5 Goodwill S$millions Year 2003 Year 2002
Unamortised balance at January 1 7,693 5,205 Acquisition of subsidiary companies 108 2,767
Amortisation for the year (430) (278)
Unamortised balance at December 31 7,371 7,693
Goodwill
On January 10, 2003, DBS Bank Ltd exercised its call option on the minority shareholders of DBS Diamond Holdings Limited (“DDH”) to acquire the remaining 28.4% issued share capital of DDH. DDH owns 100% of Dao Heng Bank Group Limited (“DHG”). Goodwill arising from this acquisition was reflected in 2002 financial statements and is amortised over a period of 19 years from January 2003. As a result, goodwill amortisation in 2003 increased when compared to 2002.
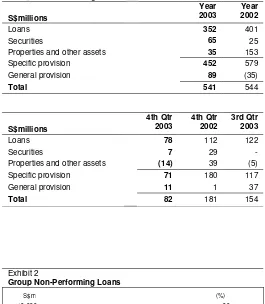
Table 6
Group Provision Charge
S$millions
Year 2003
Year 2002
Loans 352 401
Securities 65 25
Properties and other assets 35 153
Specific provision 452 579
General provision 89 (35)
Total 541 544
S$millions 4th Qtr 2003 4th Qtr 2002 3rd Qtr 2003
Loans 78 112 122
Securities 7 29
-Properties and other assets (14) 39 (5)
Specific provision 71 180 117
General provision 11 1 37
Total 82 181 154
Provision Charge
Total provision charge was S$541 million for 2003. Approximately 71% of the total charge was related to non-bank loans.
Higher general provisions were made in 2003 following an increase in customer loans and investment securities. This increase contrasts with 2002 where customer loans declined and general provision reserves were released. Total provision charge in 4th Qtr 2003 fell S$99 million and S$72 million compared to 4th Qtr 2002 and 3rd Qtr 2003 respectively. The decrease in provision charge was due to lower provision for loans as well as write-backs from properties and other assets.
Exhibit 2
Group Non-Performing Loans
4 , 4 1 1 8 , 1 4 9 7 , 0 8 6
4 , 2 2 4
4 , 1 3 3 4 , 1 6 3 4 , 1 4 3 3 , 7 8 0 4 , 5 1 2
5 . 7 5 . 9 5.9
7.6 1 3 . 0 11.8
5.2 5.7 6.1
0 2 , 0 0 0 4 , 0 0 0 6 , 0 0 0 8 , 0 0 0 1 0 , 0 0 0
D e c 9 8
D e c 9 9
D e c 0 0
D e c 0 1
D e c 0 2
M a r 0 3
J u n 0 3
S e p 0 3
D e c 0 3 0 5 1 0 1 5 2 0
S ' p o r e H o n g K o n g 5 R C ( e x c l D T D B ) DTDB O t h e r C o u n t r i e s N P L / L o a n s
Note:
1/ NPL rate is computed based on total non-bank customer NPLs (excluding non-performing debt securities and contingent items) divided by total gross non-bank customer loans. Table 7
Group Geographical NPL Rate (Based on MAS standard)
(%)
Dec 31 2003
Dec 31 2002
Singapore 3.3 4.2
Hong Kong 2.9 3.5
Regional countries1/
(excl. DTDB2/
) 19.0 40.6
DTDB 28.8 27.0
Other countries 8.5 8.7
Notes:
1/ Regional countries (RC) include Malaysia, Indonesia, Thailand, Korea and the Philippines 2/ DTDB : DBS Thai Danu Bank Public Company Limited
Asset Quality
The volume of non-performing loans (“NPLs”) declined to S$3.8 billion at the end of December 2003. Approximately S$1.4 billion of restructured NPLs continues to be included in the total volume of NPLs.
The ratio of NPLs to the total non-bank loans (“NPL rate”) decreased from 6.1% at the end of December 2002 to 5.2% at the end of December 2003. The NPL rates for Singapore, Hong Kong and regional countries operations improved to 3.3%, 2.9% and 19% respectively at the end of December 2003 due to reduction in non-bank NPLs and higher loan base.
The Group’s Hong Kong credit card business recorded a 1.5% delinquent loan rate for 90 days past due, down from 1.8% in 3rd Qtr 2003. The net charge-off rate for 2003 was 10.8%, down from the 11.8% rate for the first 9 months of 2003. The lower charge-off rate reflects the improving economic condition in Hong Kong.
Exhibit 3
Group Non-Performing Loans – by Loan Grading
S$m
2,336 2,576 258
3,799 5,121
3,607 3,411 3,114 3,077 3,017
799 891 851 816 858 819 546 204 951 452
282 252 240 295 316
2,936 2,777 4,143 4,163 4,133 4,224 4,512 4,411 8,149 7,086 3,780 0 2,000 4,000 6,000 8,000 10,000
Dec 98 Dec 99 Dec 00 Dec 01 Dec 02 Mar 03 Jun 03 Sep 03 Dec 03
Substandard Doubtful Loss
Loan Grading
As at end December 2003, the percentage classification of non-performing loans into substandard, doubtful and loss categories remains relatively unchanged compared to end December 2002 and end September 2003.
Of the total S$3.8 billion NPLs as at the end of December 2003, 73% were classified as substandard, 5% as doubtful and the remaining 22% in the loss category.
Exhibit 4
Group Cumulative Specific and General Provisions
2,605 2,387 3,147 4,286 2,286 2,719 2,500 2,477 2,496 102.7118.4
129.9142.5120.7 120.9 118.8 121.7 124.0
44.4 52.6 51.8 60.3 59.2 59.9 60.0 62.9 63.2
0 1,000 2,000 3,000 4,000 5,000
Dec 98 Dec 99 Dec 00 Dec 01 Dec 02 Mar 03 Jun 03 Sep 03 Dec 03
S$m 0 100 200 300 (%)
SP GP SP+GP/Unsecured NPLs SP+GP/NPLs
Cumulative Specific and General
Provisions
[image:12.595.56.326.67.632.2]Total cumulative specific and general provisions at the end of December 2003 was 124% of unsecured NPLs, and 63.2% of total NPLs.
Table 8
Group Key Balance Sheet Items
S$millions
Dec 31 2003
Dec 31 2002
Total assets 159,595 149,445
Customer loans 1/
64,335 60,709
Customer deposits 108,041 101,315
Loan-to-deposit ratio (%) 59.5 59.9
Loan and non-trading debt
securities-to-deposit ratio (%) 79.7 73.2
Note:
1/ After deducting cumulative provisions.
Balance Sheet
Table 9
Group Customer Deposits
S$millions
Dec 31 2003
Dec 31 2002
Analysed by Currency
Singapore dollar 56,641 53,655
US dollar 23,309 20,096
Hong Kong dollar 17,241 18,731
Thai Baht 3,539 3,164
Others 7,311 5,669
Total 108,041 101,315
Analysed by Product
Savings accounts (include S$ autosave) 48,028 43,047
Current accounts 10,486 8,975
Fixed deposits 45,130 46,026
Other deposits 4,397 3,267
Total 108,041 101,315
Table 10
Group Customer Loans
S$millions
Dec 31 2003
Dec 31 2002
Gross 66,414 62,901
Less:
Specific provisions 1,151 1,288
General provisions 928 904
Net total 64,335 60,709
Including:
Bills receivable 1,481 1,574
Loans 62,854 59,135
Net total 64,335 60,709
Industry Breakdown
Manufacturing 6,434 5,856
Building & Construction 7,682 8,057
Housing Loans 22,289 21,910
General Commerce 6,634 5,707
Transportation, Storage & Communications 4,821 4,617
Financial Institutions, Investment & Holding Companies 5,559 3,626
Professionals & Private Individuals (except Housing Loans) 7,393 7,784
Others 5,602 5,344
Total (Gross) 66,414 62,901
Analysed by Currency and Fixed / Variable Rates Fixed rate 1/
Singapore dollar 8,867 8,359
Hong Kong dollar 262 460
US dollar 4 1
Thai Baht 945 862
Others 96 1
Sub-total 10,174 9,683
Variable rate 2/
Singapore dollar 21,026 21,673
Hong Kong dollar 20,089 20,238
US dollar 8,658 7,333
Thai Baht 2,393 2,128
Others 4,074 1,846
Sub-total 56,240 53,218
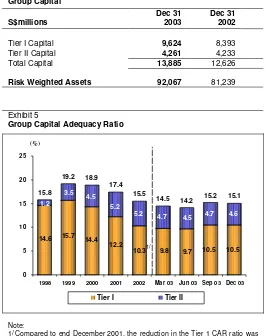
Table 11 Group Capital S$millions Dec 31 2003 Dec 31 2002
Tier I Capital 9,624 8,393
Tier II Capital 4,261 4,233
Total Capital 13,885 12,626
Risk Weighted Assets 92,067 81,239
Exhibit 5
Group Capital Adequacy Ratio
10.5 10.5
4.7 4.7 4.6
14.6 15.7 10.3 12.2 14.4 9.8 9.7 3.5 4.5 5.2 5.2 1.2 4.5 15.8 19.2 18.9 17.4 15.5
14.5 14.2 15.2 15.1
0 5 10 15 20 25
1998 1999 2000 2001 2002 Mar 03 Jun 03 Sep 03 Dec 03
Tier I Tier II
Note:
1/ Compared to end December 2001, the reduction in the Tier 1 CAR ratio was primarily due to the deduction of additional goodwill with DBS' purchase of the DBS Diamond Holdings Limited minority interest.
Capital Adequacy Ratio
At end of December 2003, the total Capital Adequacy Ratio (“CAR”) for the DBSH Group, measured according to the Bank for International Settlements (“BIS”) guidelines was 15.1%, of which Tier I CAR was 10.5%.
Exhibit 6
Group Unrealised Valuation Surpluses
692
347 358 442 436
827
487 483 409 425 424
324 337 498 589 729 677 568 860 749 1,421 1,416 1,175 905
834 841 851
0 400 800 1,200 1,600
1998 1999 2000 2001 2002 Mar 03 Jun 03 Sep 03 Dec 03
Quoted Investments Properties
S$m
Unrealised Valuation Surpluses
Unrealised valuation surpluses in properties and quoted investment securities not recognised in the accounts amounted to S$860 million at the end of December 2003.
Note:
1/ Unrealised valuation surpluses for 1998 to 2000 were not adjusted for the change in accounting policy on valuation of trading securities.
1/
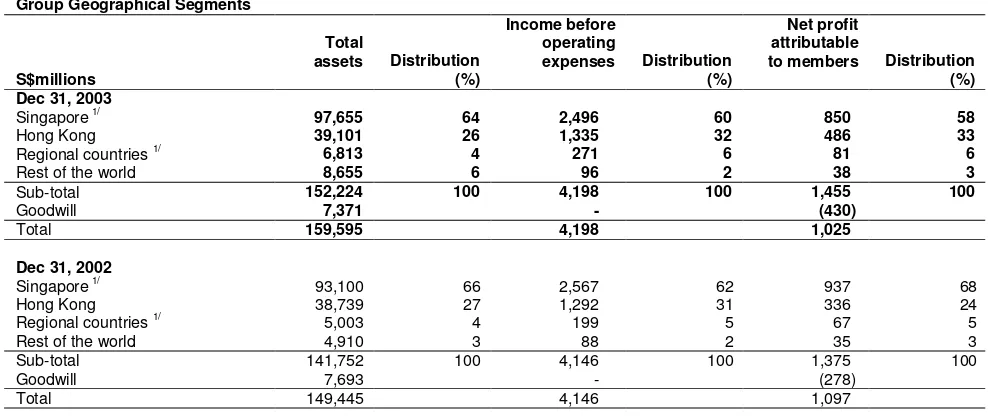
Geographical Segment Analysis
[image:15.595.56.550.160.368.2]The following table analyses total assets, income before operating expenses and NPAM by geographical segments. Unless otherwise stated, the analysis of geographical segments are generally based on the location of the office recording the transactions.
Table 12
Group Geographical Segments
S$millions
Total
assets Distribution (%)
Income before operating
expenses Distribution (%)
Net profit attributable
to members Distribution (%) Dec 31, 2003
Singapore 1/ 97,655 64 2,496 60 850 58
Hong Kong 39,101 26 1,335 32 486 33
Regional countries 1/
6,813 4 271 6 81 6
Rest of the world 8,655 6 96 2 38 3
Sub-total 152,224 100 4,198 100 1,455 100
Goodwill 7,371 - (430)
Total 159,595 4,198 1,025
Dec 31, 2002
Singapore 1/
93,100 66 2,567 62 937 68
Hong Kong 38,739 27 1,292 31 336 24
Regional countries 1/
5,003 4 199 5 67 5
Rest of the world 4,910 3 88 2 35 3
Sub-total 141,752 100 4,146 100 1,375 100
Goodwill 7,693 - (278)
Total 149,445 4,146 1,097
Note:
1/ Special general provisions for regional exposures and additional provisions for DTDB's loans are booked in Singapore.
DBSH Group operates in four main geographical areas :
• “Singapore”, which includes the operations of the Asian Currency Unit.
• “Hong Kong”, which includes branch and subsidiary operations in Hong Kong.
• "Regional countries", which includes branch and subsidiary operations in Malaysia, Indonesia, Thailand, Korea and the Philippines.
• “Rest of the world”, which are mainly branch operations in China, India, Taiwan, United States and United Kingdom.
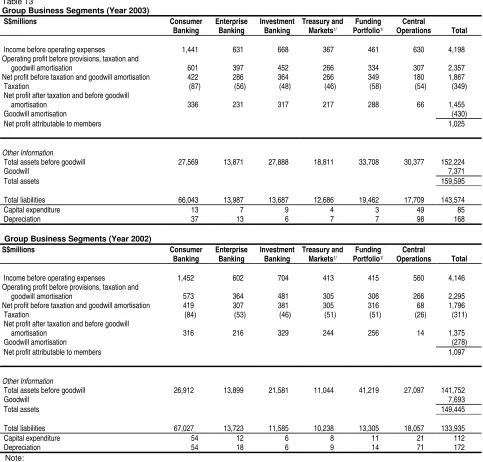
Business Segment Analysis
The business segment results represent the customer segments of the respective businesses and are determined by:
• Income and direct expenses attributable to each customer and other segment; and
• Management accounting policies relating to the allocation of indirect expenses and funds transfer pricing between the central treasury unit and the customer/other segments.
The various customer segments are described below, along with a description of the change in net profit after taxation for 2003 over 2002.
• Consumer Banking
Consumer Banking focuses on providing products and services to individual customers. The products and services offered to customers include credit facilities (mortgage, personal loans, etc.), credit cards, deposit collection, remittance services and asset management products.
The increase in net profit after taxation (S$20 million, 6.3%) was largely due to lower expenses, offset in part by lower net interest income and higher provisions.
• Enterprise Banking
Enterprise Banking focuses on providing products and services to small and medium enterprises. The products and services offered to customers include credit facilities (overdraft, factoring/accounts receivable purchase, trade financing, commercial/industrial property financing, hire purchase and government financing and assistance schemes), deposit, payment and collection services and treasury products.
The increase in net profit after taxation (S$15 million, 6.9%) was mainly attributable to higher net interest income and fee income from payment, collection services and capital market activities.
• Investment Banking
Investment Banking caters to the business needs of large corporate customers and financial institutions. The products and services offered to customers include direct lending, advisory banking services, bond issuance, equity financing, syndicated financing, mergers and acquisitions advisory services, debt restructuring advisory services, private equity, nominee and trustee services and cash management services.
The decrease in net profit after taxation (S$12 million, 3.6%) was due to the non-recurring gain in 2002, from the sale of equity investment in NatSteel Ltd, offset in part by lower provisions.
• Treasury and Markets
Treasury and Markets is primarily involved in market making, structuring and trading of financial products including foreign exchange, securities and interest rate/ credit/ equity/ foreign exchange derivatives. Income from treasury products and services relating to customers of other segments is reflected in the respective customer segments.
The decrease in net profit after taxation (S$27 million, 11.1%) was mainly due to lower marked to market gains on trading securities in 2003.
The other segments of the analysis are:
• Funding Portfolio
The Funding Portfolio managed by Treasury and Markets is the net aggregate of the Group’s interest earning assets and interest bearing liabilities. The income generated from this portfolio is predominantly interest in nature.
• Central Operations
Central Operations encompasses a range of activities resulting from central corporate decisions and the related income and expenses not attributed to business segments. These include the central treasury unit, funding costs of DBSH Group’s associated and subsidiary companies and gains/losses on properties as well as certain subsidiaries including stock brokerage and asset management.
[image:17.595.67.550.178.640.2]The following table analyses the results, total assets and total liabilities by business segments:
Table 13
Group Business Segments (Year 2003)
S$millions Consumer
Banking
Enterprise Banking
Investment Banking
Treasury and Markets1/
Funding Portfolio1/
Central
Operations Total
Income before operating expenses 1,441 631 668 367 461 630 4,198
Operating profit before provisions, taxation and
goodwill amortisation 601 397 452 266 334 307 2,357
Net profit before taxation and goodwill amortisation 422 286 364 266 349 180 1,867
Taxation (87) (56) (48) (46) (58) (54) (349)
Net profit after taxation and before goodwill
amortisation 336 231 317 217 288 66 1,455
Goodwill amortisation (430)
Net profit attributable to members 1,025
Other Information
Total assets before goodwill 27,569 13,871 27,888 18,811 33,708 30,377 152,224
Goodwill 7,371
Total assets 159,595
Total liabilities 66,043 13,987 13,687 12,686 19,462 17,709 143,574
Capital expenditure 13 7 9 4 3 49 85
Depreciation 37 13 6 7 7 98 168
Group Business Segments (Year 2002)
S$millions Consumer
Banking
Enterprise Banking
Investment Banking
Treasury and Markets1/
Funding Portfolio1/
Central
Operations Total
Income before operating expenses 1,452 602 704 413 415 560 4,146
Operating profit before provisions, taxation and
goodwill amortisation 573 364 481 305 306 266 2,295
Net profit before taxation and goodwill amortisation 419 307 381 305 316 68 1,796
Taxation (84) (53) (46) (51) (51) (26) (311)
Net profit after taxation and before goodwill
amortisation 316 216 329 244 256 14 1,375
Goodwill amortisation (278)
Net profit attributable to members 1,097
Other Information
Total assets before goodwill 26,912 13,899 21,581 11,044 41,219 27,097 141,752
Goodwill 7,693
Total assets 149,445
Total liabilities 67,027 13,723 11,585 10,238 13,305 18,057 133,935
Capital expenditure 54 12 6 8 11 21 112
Depreciation 54 18 6 9 14 71 172
Note:
Subsequent Event
On January 28, 2004, Thai Military Bank PCL (“TMB”), DBS Bank Ltd (“DBS”) and DBS Thai Danu Bank PCL (“DTDB”) announced that a Memorandum of Understanding (“MoU”) was signed to combine TMB and DTDB in a strategic merger to create the 6th largest banking group in Thailand by assets. The MoU sets out, among others, the principles and structure of the merger, management and areas of governance and business cooperation. The proposed structure is a tender offer by TMB for all the shares of DTDB in consideration for new TMB shares. The parties have also agreed to explore incorporating The Industrial Finance Corporation of Thailand (“IFCT”) in a three-way merger to create Thailand's 5th largest bank. The proposed merger is subject to approvals from the Thai Minister of Finance, the Bank of Thailand, the Stock Exchange of Thailand, the Securities and Exchange Commission of Thailand, the Thai Ministry of Commerce, the Monetary Authority of Singapore and the shareholders.
The effect of the proposed merger of TMB, DTDB and IFCT on the DBSH Group's financials will depend on finalisation of the details. It is expected to have a positive non-cash accounting impact on DBSH Group’s financials and capital adequacy ratios.
Comparatives
DBS GROUP HOLDINGS LTD AND ITS SUBSIDIARY COMPANIES
Audited Consolidated Profit and Loss Account
In S$millions
Year 2003
Year 20021/
4th Qtr 2003 #
4th Qtr 20021/ #
3rd Qtr 20031/ #
Interest income 3,640 4,406 925 1,030 911 Less: Interest expense 1,265 1,761 297 388 323 Net interest income 2,375 2,645 628 642 588
Fee and commission income 884 797 251 190 259
Dividends 51 28 10 5 16
Rental income 36 32 11 8 9
Other income 852 644 153 209 241
Income before operating expenses 4,198 4,146 1,053 1,054 1,113
Less: Staff costs 865 911 217 225 219
Depreciation 168 172 40 42 44
Other operating expenses 808 768 225 204 195 Goodwill amortisation 430 278 110 73 107
Operating expenses 2,271 2,129 592 544 565
Operating profit before provisions 1,927 2,017 461 510 548
Less: Provision for possible loan losses and
diminution in value of other assets 541 544 82 181 154
Operating profit 1,386 1,473 379 329 394
Add: Share of profits less losses of associated and
joint venture companies 51 45 18 6 11
Net profit before taxation 1,437 1,518 397 335 405
Less: Taxation 337 298 80 24 96
Share of taxation of associated and joint
venture companies 12 13 5 2 3
Net profit after taxation 1,088 1,207 312 309 306
Less: Minority interests 63 110 20 22 15
Net profit attributable to members 1,025 1,097 292 287 291
Notes:
DBS GROUP HOLDINGS LTD AND ITS SUBSIDIARY COMPANIES
Audited Consolidated Balance Sheet as at
Dec 31 Dec 31
In S$millions 2003 2002 1/
SHARE CAPITAL
Share capital 1,556 1,555
RESERVES
Share premium account 2,171 2,163
Other reserve 4,271 4,271
Capital redemption reserve 28 28
Capital reserve (30) (19)
General reserve 2,230 2,044
Revenue reserve 4,670 4,195
13,340 12,682
SHAREHOLDERS' FUNDS 14,896 14,237
MINORITY INTERESTS 1,125 1,273
LIABILITIES
Deposits and balances of banks 7,497 4,877 Deposits and other accounts of
non-bank customers 108,041 101,315
Bills payable 363 522
Current taxation 500 414
Deferred tax liabilities 104 120
Other liabilities 15,772 15,992
Other borrowings and debt
securities in issue 2/ 5,604 4,909 - due within one year 1,882 1,997 - due after one year 3,722 2,912
Subordinated term debts
(unsecured) 5,693 5,786
- due within one year 25 24
- due after one year 5,668 5,762
TOTAL LIABILITIES AND
SHAREHOLDERS’ FUNDS 159,595 149,445
OFF BALANCE SHEET ITEMS
Contingent liabilities 6,984 7,276
Commitments 60,173 58,602
Financial derivatives 1,256,240 778,767
Notes:
1/ Figures for prior period have been restated to reflect the changes in accounting policy (refer to Appendix VII).
2/ Includes secured amount of S$971 million as at December 31, 2003 (December 31, 2002 : S$1,409 million). These are mainly secured by properties and securities.
Dec 31 Dec 31
In S$millions 2003 2002 1/
ASSETS
Cash, and balances and
placements with central banks 5,007 2,187 Singapore Government securities
and treasury bills 11,438 9,017
Trading securities 6,433 3,672
Balances, placements with, and
loans and advances to banks 27,472 38,767 Bills receivable from non-bank
customers 1,481 1,574
Loans and advances to non-bank
customers 62,854 59,135
Investment securities 22,828 14,591 Associated and joint venture
companies 547 521
Goodwill 7,371 7,693
Fixed assets 2,016 2,261
Deferred tax assets 129 125
Other assets 12,019 9,902
DBS GROUP HOLDINGS LTD AND ITS SUBSIDIARY COMPANIES
Audited Balance Sheet of DBS Group Holdings Ltd as at
Dec 31 Dec 31
In S$millions 2003 2002 1/
SHARE CAPITAL
Share capital 1,556 1,555
RESERVES
Share premium account 2,171 2,163
Capital redemption reserve 28 28
Revenue reserve 3,001 3,201
5,200 5,392
SHAREHOLDERS' FUNDS 6,756 6,947
LIABILITIES
Current liabilities 9 4
Deferred tax liabilities #
-TOTAL LIABILITIES AND
SHAREHOLDERS’ FUNDS 6,765 6,951
Other Information
Net asset value per ordinary share (S$) (i) Based on existing ordinary share
capital 4.53 4.66
4.34 4.47
(ii) Assuming non-voting convertible preference shares (“CPS”) and non-voting redeemable CPS are converted to ordinary shares
Note:
1/ #: Insignificant
Dec 31 Dec 31
In S$millions 2003 2002 1/
ASSETS
Trading securities - #
Balances, placements with, and loans
and advances to banks 3 4
Investment in subsidiary companies 6,762 6,947
DBS GROUP HOLDINGS LTD AND ITS SUBSIDIARY COMPANIES
Audited Consolidated Statement of Changes in Shareholders' Equity
In S$ millions
Share Capital
Share Premium
Other Reserve
Capital Redemption Reserve
Capital Reserve
General Reserve
Revenue Reserve
Total Reserves
Balance at January 1, 2003 1,555 2,163 4,271 28 (19) 2,044 4,403 12,890
Effect of changes in accounting policy (Refer to
Appendix VII) - - - - - - (208) (208)
Balance at January 1, 2003 (restated) 1,555 2,163 4,271 28 (19) 2,044 4,195 12,682
Exercise of share options pursuant to the DBSH
Share Option Scheme/DBSH Share Option Plan 1 8 - - - - - 8
Net exchange translation adjustments during the
year - - - - (11) - - (11)
Appropriation from profit and loss account - - - - - 186 (186)
-Net profit attributable to members - - - - - - 1,025 1,025
Final dividends paid on ordinary and preference
shares for the previous year - - - - - - (194) (194)
Interim dividends paid on ordinary and preference
shares for the current year - - - - - - (170) (170)
Balance at December 31, 2003 1,556 2,171 4,271 28 (30) 2,230 4,670 13,340
Balance at January 1, 2002 1,538 1,958 4,271 28 24 1,821 3,973 12,075
Effect of changes in accounting policy (Refer to
Appendix VII) - - - (288) (288)
Balance at January 1, 2002 (restated) 1,538 1,958 4,271 28 24 1,821 3,685 11,787
Issue of ordinary shares 15 196 - - - 196
Exercise of share options pursuant to the DBSH
Share Option Scheme/DBSH Share Option Plan 2 9 - - - 9
Net exchange translation adjustments during the
year - - - - (43) - - (43)
Appropriation from profit and loss account - - - 223 (223)
-Net profit attributable to members - - - 1,097 1,097
Final dividends paid on ordinary and preference
shares for the previous year - - - (194) (194)
Interim dividends paid on ordinary and preference
shares for the current year - - - (170) (170)
DBS GROUP HOLDINGS LTD AND ITS SUBSIDIARY COMPANIES
A
udited Statement of Changes in Shareholders' Equity of DBS Group Holdings Ltd
In S$ millions Share Capital
Share Premium
Capital Redemption Reserve
Revenue Reserve
Total Reserves
Balance at January 1, 2003 1,555 2,163 28 3,201 5,392
Exercise of share options pursuant to the DBSH Share Option
Scheme/DBSH Share Option Plan 1 8 - - 8
Net profit after taxation - - - 164 164
Final dividends paid on ordinary and preference shares for the
previous year - - - (194) (194)
Interim dividends paid on ordinary and preference shares for the
current year - - - (170) (170)
Balance at December 31, 2003 1,556 2,171 28 3,001 5,200
Balance at January 1, 2002 1,538 1,958 28 2,060 4,046
Issue of ordinary shares 15 196 - - 196
Exercise of share options pursuant to the DBSH Share Option
Scheme/DBSH Share Option Plan 2 9 - - 9
Net profit after taxation - - - 1,505 1,505
Final dividends paid on ordinary and preference shares for the
previous year - - - (194) (194)
Interim dividends paid on ordinary and preference shares for the
current year - - - (170) (170)
DBS GROUP HOLDINGS LTD AND ITS SUBSIDIARY COMPANIES
Audited Consolidated Cash Flow Statement for the Year Ended December 31
In S$millions 2003 20021/
Cash flows from operating activities
Net profit before taxation 1,437 1,518
Adjustments for non-cash items:
Provision for possible loan losses and diminution in value of other assets 541 534
Depreciation of fixed assets 168 172
Goodwill amortisation 430 278
Share of profits of associated and joint venture companies (51) (45)
Net gain on disposal of fixed assets (3) (10)
Net gain on disposal of investment securities (183) (214)
Operating profit before changes in operating assets & liabilities 2,339 2,233
Increase/(Decrease) in:
Deposits and other accounts of non-bank customers 6,726 (5,456)
Deposits and balances of banks 2,620 (3,569)
Other liabilities including bills payable 3,082 3,363
(Increase)/Decrease in:
Singapore Government securities and treasury bills (2,431) 168
Trading securities (2,761) 53
Accounts receivable and other assets (2,332) (4,154)
Balances, placements with, and loans and advances to other banks 11,277 2,348
Loans and advances to non-bank customers including bills receivable (4,008) 7,166
Tax paid (272) (216)
Net cash generated from operating activities (1) 14,240 1,936
Cash flows from investing activities
Disposal of subsidiary companies - 32
Acquisition of additional interest in subsidiary companies (3,654) (1)
Dividends from associated companies 32 28
Purchase of fixed assets (85) (112)
Net increase in investment securities (7,963) (3,135)
Proceeds from disposal of fixed assets 82 184
Net cash used in investing activities (2) (11,588) (3,004)
Cash flows from financing activities
Increase/(Decrease) in:
Share capital and share premium 9 11
Debt securities and borrowings 602 205
Dividends paid to shareholders of DBSH (364) (364)
Dividends paid to minority shareholders of subsidiary companies (68) (146)
Net cash generated from/(used in) financing activities (3) 179 (294)
Exchange translation adjustments (4) (11) (43)
Net change in cash, and balances and placements with central banks (1)+(2)+(3)+(4) 2,820 (1,405)
Cash, and balances and placements with central banks as at January 1 2,187 3,592
Cash, and balances and placements with central banks as at December 31 5,007 2,187
Note:
DBS GROUP HOLDINGS LTD AND ITS SUBSIDIARY COMPANIES
Changes In Accounting Policy
(a)The Monetary Authority of Singapore revised MAS Notice 605 during the third quarter of 2003, allowing for the
measurement of trading book positions at fair value. Following the revision, DBSH Group revised its classification guidelines and measurement of its trading and investment securities.
Prior to the revision, Singapore Government securities and other trading securities were separately stated at cost (adjusted for amortisation of premium or discount) less provision. Provision was made based on the shortfall between cost and market value determined on an aggregate portfolio basis and recognised as a charge to the profit and loss account as they arise.
With the revision, a security is classified as held for trading if it is acquired or incurred principally for the purpose of generating a profit from short-term fluctuations in price or dealer’s margin. A security is also classified as held for trading if it is part of a portfolio for which there is evidence of a recent actual pattern of short-term profit-taking, regardless of why it was acquired. These securities are recorded at fair value on the balance sheet, with changes in fair value recorded in 'other income' in the profit and loss account.
Securities that are not classified as held for trading are classified as investment securities. These securities are stated at cost less provision. Specific provision is made for an individual investment when there has been a diminution in value, except where such diminution is temporary, and is charged to the profit and loss account as they arise. In addition, for corporate debt securities, a general provision charge in line with the Group’s existing provisioning policies is also recorded in the profit and loss account.
The accounting policy change has been applied retroactively, and the comparable financial results for the Group have been restated to conform to the new accounting policy. The opening revenue reserves for 2002 decreased by S$9 million while the profits for 2002 increased by S$56 million. The change has also increased the current year profit by S$7 million.
(b) The minority interest in DBSH Group financial statements for DBS Thai Danu Bank Public Company Limited (“DTDB”) had been in debit balance since 1998. A debit minority interest balance arises where the losses applicable to the minority in the consolidated subsidiary company exceed the minority’s share of the equity of that company. The published financial statements of DTDB are prepared under Thai Generally Accepted Accounting Principles (“GAAP”) and show that DTDB has positive net assets. However, there are significant differences in accounting for loan
provisions1/ under Thai and Singapore regulatory guidelines and consequently, when Singapore guidelines are
applied to the minority’s share of DTDB’s net assets, a debit balance arises in the DBSH consolidated financial statements.
At December 31, 2003, the Board of Directors and management reviewed the current accounting policy with regard to
losses applicable to the DTDB minority shareholders in the light of FRS 272/. Under FRS 27, any losses in excess of
the interest in the equity of the subsidiary applicable to the minority are charged against the majority interest except to the extent that the minority has a binding obligation to, and is able to, make good the losses. Accordingly, the Board of Directors and management have decided that the losses applicable to the DTDB minority shareholders that is in excess of their interest in the equity of DTDB will be absorbed by the majority in line with FRS 27.
DBS GROUP HOLDINGS LTD AND ITS SUBSIDIARY COMPANIES
Selected Notes to the Accounts
1. Issuance of Ordinary Shares
Details of issue of new ordinary shares of S$1.00 each are as follows:
Particulars
Number of new ordinary shares issued between
October 1, 2003 and December 31, 2003
Number of new ordinary shares that would have been issued upon the conversion/exercise of all outstanding
non-voting convertible preference shares (“CPS”)/ non-voting redeemable CPS/Share
Options
Dec 31, 2003 Dec 31, 2002
Conversion of non-voting CPS 9,454 19,595,605 19,608,841
Conversion of non-voting redeemable CPS - 66,475,374 66,475,374
Exercise of Executive Share Options 210,455 46,155,436 35,437,704
2.
Earnings Per Ordinary Share
Basic earnings per ordinary share (“EPS”) is calculated by dividing the DBSH Group’s net profit attributable to members and after preference dividends by the weighted average number of ordinary shares in issue during the year.
DBSH Group
In millions 2003 2002
Weighted average number of ordinary shares in issue (a) 1,470 1,462
DBSH Group
In S$millions 2003 2002
Net profit attributable to members 1,025 1,097
Less: Preference dividends 20 20
Net profit attributable to members after adjustment of preference dividends (b) 1,005 1,077
Add: Goodwill amortisation 430 278
Net profit attributable to members after adjustment of preference dividends
and goodwill amortisation (c) 1,435 1,355
Basic Earnings Per Ordinary Share (Cents) (b)/(a) 68 74
Basic Earnings Per Ordinary Share (excluding goodwill amortisation) (Cents)
DBS GROUP HOLDINGS LTD AND ITS SUBSIDIARY COMPANIES
2. Earnings Per Ordinary Share (Continued)
For the purpose of calculating the diluted earnings per ordinary share, the weighted average number of ordinary shares in issue is adjusted to take into account the dilutive effect arising from the full conversion of DBSH non-voting CPS and DBSH non-voting redeemable CPS to ordinary shares. In addition, where applicable, the calculation would take into account the exercise of all outstanding share options granted to employees where such shares would be issued at a price lower than fair value (average share price during the year).
The effect of the exercise of DBSH share options and conversion of DBSH non-voting CPS and DBSH non-voting redeemable CPS on the weighted average number of ordinary shares in issue is as follows:
DBSH Group
In millions 2003 2002
Weighted average number of ordinary shares in issue 1,470 1,462
Full conversion of DBSH non-voting CPS 20 20
Full conversion of DBSH non-voting redeemable CPS 66 66
Weighted average number of ordinary shares in issue assuming dilution (a) 1,556 1,548
The effect of the exercise of DBSH share options and conversion of DBSH non-voting CPS and DBSH non-voting redeemable CPS on DBSH Group’s net profit attributable to members is as follows:
DBSH Group
In S$millions 2003 2002
Net profit attributable to members 1,025 1,097
Less: Preference dividends 20 20
Net profit attributable to members after adjustment of preference dividends 1,005 1,077
Adjustment to net profit arising from:
(i) Full conversion of DBSH non-voting CPS 5 5
(ii) Full conversion of DBSH non-voting redeemable CPS 15 15
Adjusted net profit attributable to members (b) 1,025 1,097
Add: Goodwill amortisation 430 278
Adjusted net profit attributable to members (excluding goodwill amortisation) (c) 1,455 1,375
Diluted Earnings Per Ordinary Share (Cents) (b)/(a) 66 71
Diluted Earnings Per Ordinary Share (excluding goodwill amortisation) (Cents)
DBS GROUP HOLDINGS LTD AND ITS SUBSIDIARY COMPANIES
3.
Loan and Investment Exposures to Malaysia, Indonesia, Thailand, Korea, The
Philippines (Regional Countries), Hong Kong and China
At December 31, 2003, DBSH Group has exposures to certain countries in the Asia Pacific Region. The exposures are determined based on the location of the credit risk of the customers and counter parties regardless of where the transactions are booked.
The DBSH Group’s exposures (assets and non-performing loans) to the Regional Countries, Hong Kong and China at December 31, 2003 are as follows:
Loans and debt securities Net Exposure
In S$millions
Assets in Bank
Central Banks &
Govt. Securities
Non-Bank 1/
Investments
Less: Intercompany
Loans/ Investments in
Financial Subsidiaries/
Overseas
Branches Amount
As a % of Total
Assets NPLs 2/
(a) (b) (c) (d) (e) (f)=(a+b (g)
+c+d-e)
Total Regional Countries 5,016 1,104 6,395 955 1,954 11,516 7.3% 1,545
Malaysia 1,280 13 1,356 90 1,034 1,705 1.1% 233
Indonesia 126 56 365 73 128 492 0.3% 55
Thailand (excluding DTDB) 231 9 221 63 214 310 0.2% 188
Korea 3,326 531 885 1 577 4,166 2.6% 17
The Philippines 46 149 103 604 1 901 0.6% 8
DTDB 3/
7 346 3,465 124 - 3,942 2.5% 1,044
Hong Kong 2,457 2,013 23,235 11,935 13,238 26,402 16.5% 643
China 965 24 692 21 393 1,309 0.8% 130
TOTAL 8,438 3,141 30,322 12,911 15,585 39,227 24.6% 2,318
The DBSH Group’s exposures (assets and non-performing loans) to the Regional Countries, Hong Kong and China at December 31, 2002 are as follows:
Loans and debt securities Net Exposure
In S$millions
Assets in Bank
Central Banks &
Govt. Securities
Non-Bank 1/
Investments
Less: Intercompany
Loans/ Investments in
Financial Subsidiaries/
Overseas
Branches Amount
As a % of Total
Assets NPLs 2/
(a) (b) (c) (d) (e) (f)=(a+b (g)
+c+d-e)
Total Regional Countries 2,753 680 4,870 813 834 8,282 5.5% 1,595
Malaysia 743 4 677 89 561 952 0.6% 329
Indonesia 109 73 247 72 79 422 0.3% 110
Thailand (excluding DTDB) 98 23 244 73 135 303 0.2% 197
Korea 1,724 249 418 4 54 2,341 1.6% 17
The Philippines 20 49 143 493 5 700 0.5% 37
DTDB 3/
59 282 3,141 82 - 3,564 2.3% 905
Hong Kong 1,830 2,372 22,303 10,346 11,074 25,777 17.3% 772
China 1,001 27 718 - 362 1,384 0.9% 167
DBS GROUP HOLDINGS LTD AND ITS SUBSIDIARY COMPANIES
4. Non-Performing Loans and Provisions
At December 31, 2003, DBSH Group’s total non-performing loans amounted to S$3.78 billion (2002: S$4.224 billion). Out of the total NPLs of S$3.78 billion, S$1.854 billion (49%) [2002: S$2.153 billion (51%)] were secured by collateral.
Details of DBSH Group’s NPLs and provisions at December 31, 2003 are as follows:
Regional Countries
In S$millions Singapore
Hong
Kong DTDB 1/ Others
Other
Countries Total
Non- Performing Loans (NPLs) 1,255 643 1,044 501 337 3,780
- Substandard 842 475 839 352 269 2,777
- Doubtful 42 66 20 49 27 204
- Loss 371 102 185 100 41 799
NPLs as a % of Group total assets 0.8% 0.4% 0.7% 0.3% 0.2% 2.4%
Non-bank NPLs as a % of non-bank loans
in the respective countries 2/ 3.3% 2.9% 28.8% 19.0% 8.5% 5.2%
Total Cumulative Provisions 851 418 561 389 168 2,387
- Specific provisions 475 190 378 193 87 1,323 - General provisions 376 228 183 196 81 1,064
Total Cumulative Provisions as a % of:
- Group total assets 0.5% 0.3% 0.4% 0.2% 0.1% 1.5% - NPLs in the respective countries 68% 65% 54% 78% 50% 63% - Unsecured NPLs in the respective countries 173% 180% 105% 111% 53% 124%
Details of DBSH Group’s NPLs and provisions at December 31, 2002 are as follows:
Regional Countries
In S$millions Singapore
Hong
Kong DTDB 1/ Others
Other
Countries Total
Non- Performing Loans (NPLs) 1,546 772 905 690 311 4,224
- Substandard 1,051 574 815 466 208 3,114
- Doubtful 23 59 7 96 67 252
- Loss 472 139 83 128 36 858
NPLs as a % of Group total assets 1.0% 0.5% 0.6% 0.5% 0.2% 2.8%
Non-bank NPLs as a % of non-bank loans
in the respective countries 2/ 4.2% 3.5% 27.0% 40.6% 8.7% 6.1%
Total Cumulative Provisions 879 449 553 458 161 2,500
- Specific provisions 527 227 372 273 112 1,511 - General provisions 352 222 181 185 49 989
Total Cumulative Provisions as a % of:
- Group total assets 0.6% 0.3% 0.4% 0.3% 0.1% 1.7% - NPLs in the respective countries 57% 58% 61% 66% 52% 59% - Unsecured NPLs in the respective countries 149% 170% 119% 95% 59% 121%
DBS GROUP HOLDINGS LTD AND ITS SUBSIDIARY COMPANIES
4. Non-Performing Loans and Provisions (Continued)
Industry Analysis Of Non-Performing Loans
The following table shows the industry breakdown of the non-performing loans of DBSH Group:
DBSH Group
2003 2002
In S$millions Outstanding Specific Provisions Outstanding Specific Provisions
Customer loans
Manufacturing 894 360 916 400
Building and Construction 414 98 427 129
Housing Loans 198 63 193 49
General Commerce 576 289 723 289
Transportation, Storage and Communications 98 25 139 35
Financial Institutions, Investment and Holding
Companies 208 66 365 113
Professionals and Private Individuals (except
Housing Loans) 399 157 413 181
Others 695 165 693 175
Sub-total 3,482 1,223 3,869 1,371
Debt securities 184 73 146 79
Contingent items 114 27 209 61
Total 3,780 1,323 4,224 1,511
5. Financial Derivatives
Financial derivatives are financial instruments whose characteristics are derived from the underlying assets, or from interest and exchange rates or indices. These include forwards, swaps, futures and options.
The following tables summarise the contractual or underlying principal amounts of derivative financial instruments held or issued for trading and non-trading purposes. The notional or contractual amounts of these instruments indicate the volume of transactions outstanding at the balance sheet date; they do not represent amounts at risk.
In the financial statements, trading derivative financial instruments are revalued on a gross position basis and the unrealised gains or losses are reflected in “Other assets” or “Other liabilities” respectively. Non-trading derivative financial instruments are accounted for on an accrual basis.
December 31, 2003
Trading Non-Trading
In S$millions
Underlying Notional
Positive Fair Value
Negative Fair Value
Underlying Notional
Positive Fair Value
Negative Fair Value
Interest Rate Derivatives 994,037 6,733 6,118 24,114 852 237
Foreign Exchange Derivatives 211,723 2,014 1,822 5,664 34 137
Equity Derivatives 8,444 36 196 544 #
-Credit Derivatives 9,292 82 109 2,422 77
-Total 1,223,496 8,865 8,245 32,744 963 374
December 31, 2002
Trading Non-Trading
In S$million
Underlying Notional
Positive Fair Value
Negative Fair Value
Underlying Notional
Positive Fair Value
Negative Fair Value
Interest Rate Derivatives 530,523 5,202 4,672 16,189 1,127 173
Foreign Exchange Derivatives 210,638 2,121 2,182 12,642 189 588
Equity Derivatives 2,981 33 40 359 # #
Credit Derivatives 2,993 27 21 2,427 63
-Commodity Derivatives 15 # # - -
-Total 747,150 7,383 6,915 31,617 1,379 761
Note:
DBS GROUP HOLDINGS LTD AND ITS SUBSIDIARY COMPANIES
6. Daily Earnings at Risk (“DEaR”) and Trading Income
The Group uses a Daily Earnings at Risk (“DEaR”) measure as one mechanism for controlling trading risk. The DEaR is calculated using a one-day time horizon and a 99% confidence interval. The following table shows the period-end, average, high and low DEaR for the trading risk exposure of the DBSH Group for the period from January 1, 2003 to December 31, 2003.
January 1, 2003 to December 31, 2003
In S$millions As