Page 1 of 6 3 May 2016
Samuel Equity Research
Please see important disclaimer on the last page of this report.
Still Sluggish
RALS telah mengeluarkan laporan keuangan 1Q16, dan pada periode ini, kinerja secara keseluruhan tercatat kurang memuaskan, dengan penjualan hanya tercatat Rp1.09 triliun (1Q15: Rp1.12 triliun) dan laba bersih juga hanya tercatat sebesar Rp9.0 miliar, di bawah eskpektasi kami dan konsensus, meskipun angka tersebut naik dari periode yang sama tahun lalu (1Q15: Rp5.5 miliar). Kami melihat, daya beli masyarakat terutama di luar pulau Jawa yang belum sepenuhnya pulih menjadi penyebab utama belum membaiknya kinerja RALS. Dengan strategi yang kurang ekspansif dan ekonomi Indonesia yang belum menunjukkan tanda-tanda perbaikan secara signifikan, kami mengurangi target rata – rata pertumbuhan penjualan untuk ‘16E menjadi 3.5%YoY (perkiraan sebelumnya: 4.5%YoY). Tetap HOLD untuk RALS dengan TP Rp700/lembar saham.
Kinerja 1Q16 di bawah estimasi. Untuk 1Q16 ini, RALS mengalami
penurunan penjualan bersih sebesar 3%YoY (1Q16: Rp1.09 triliun vs 1Q15: Rp1.12 triliun). Capaian tersebut relatif in-line, meskipun hanya mencapai 18.9% dan 19.2% dari estimasi kami dan konsensus untuk total penjualan ‘16E, karena secara historis, pada umumnya penjualan bersih pada kuartal pertama hanya mampu mencapai ±18% dari total proyeksi penjualan untuk setahun. Sementara itu, laba bersih berada di bawah estimasi kami dan konsensus (hanya 2.7% terhadap total proyeksi laba bersih ‘16E), meskipun strategi perusahaan untuk memperbesar porsi barang konsinyasi berhasil meningkatkan gross profit margin dan net profit margin sebesar 440 bps dan 30bps. Dengan strategi perusahaan yang tetap konservatif dan daya beli masyarakat yang belum sepenuhnya pulih, untuk tahun ini kami mengurangi target pertumbuhan penjualan menjadi 3.5%YoY (proyeksi sebelumnya: 4.5%YoY), sementara kami memprediksi SSSG hanya akan berkisar 0.6% pada ‘16E.
Masih mempertahankan rekomendasi HOLD. All in all, kami menilai kinerja
fundamental RALS masih belum dapat menunjukkan perbaikan yang signifikan terutama untuk tahun ini, jika dilihat dari segi: 1). Kurang agresifnya pembukaan toko baru, 2). Konversi bisnis supermarket ke bawah naungan SPAR yang membutuhkan jangka waktu yang panjang agar dapat memberikan dampak positif 3). Masih rendahnya harga komoditas di Pulau Jawa, 4). Capaian kinerja perusahaan yang kurang memuaskan sampai 1Q16. HOLD (TP: Rp700/lembar saham, 16E’PE: 13.8x, PBV: 1.4x).
Marlene Tanumihardja +62 21 2854 8387 [email protected] Target Price Rp 700 Last Price Rp 690 Potential Upside 1% JCI Index 4,812 Share isued (bn) 7.10 Market Cap. (Rp tn) 4.90 52-Weeks High/Low 490/845 Avg Daily Vol (m n) 0.00
Free Float 42.4%
Nom inal Value Rp 100 Book value/share ‘16 Rp496 Relative to JCI Chart
Com pany Background
Shareholder Structure
Ramayana Makmursentosa 55.9% Paulus Tumew u 3.7%
Public 40.5%
HOLD (Maintain)
PT Ramayana Lestari Sentosa is an Indonesian-based retail chain operator catering the needs of low er to low er-middle market. The company operates more than 100 stores know n as Ramayana, Robinson and Cahaya.
80 100 120 140 160
Sep-15 Nov-15 Jan-16 Mar-16 May-16
JCI RALS
Forecast and Valuation (at closing price Rp690 per share)
Y/E Dec (Rp Bn) 14A 15E 16E 17E
Revenue 5,861 5,533 5,729 6,025 EBITDA 490 367 387 413 Net Profit 355 335 361 387 EPS (Rp) 50 47 51 55 DPS (Rp) 30 27 24 25 Dividend Yield (%) 4.3 3.9 3.4 3.7 BV per Share (Rp) 473 470 496 525 EV/EBITDA (x) 7.3 9.2 9.2 7.8 P/E Ratio (x) 13.8 14.6 13.6 12.6 P/BV Ratio (x) 1.5 1.5 1.4 1.3
www.samuel.co.id Page 2 of 6 Tuesday, 03 May 2016
Ramayana Lestari Sentosa
RALS.IJ / RALS.JK
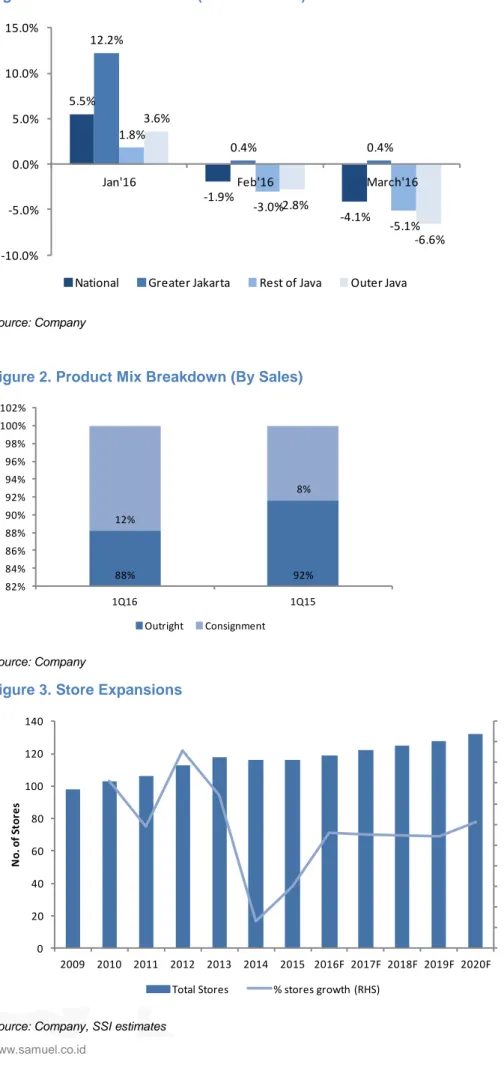
Figure 1. SSSG Performance (YTD March’16)
Source: Company
Figure 2. Product Mix Breakdown (By Sales)
Source: Company
Figure 3. Store Expansions
Source: Company, SSI estimates 5.5% -1.9% -4.1% 12.2% 0.4% 0.4% 1.8% -3.0% -5.1% 3.6% -2.8% -6.6% -10.0% -5.0% 0.0% 5.0% 10.0% 15.0%
Jan'16 Feb'16 March'16
National Greater Jakarta Rest of Java Outer Java
88% 92% 12% 8% 82% 84% 86% 88% 90% 92% 94% 96% 98% 100% 102% 1Q16 1Q15 Outright Consignment -3% -2% -1% 0% 1% 2% 3% 4% 5% 6% 7% 8% 0 20 40 60 80 100 120 140 2009 2010 2011 2012 2013 2014 2015 2016F 2017F 2018F 2019F 2020F N o. of S tor e s
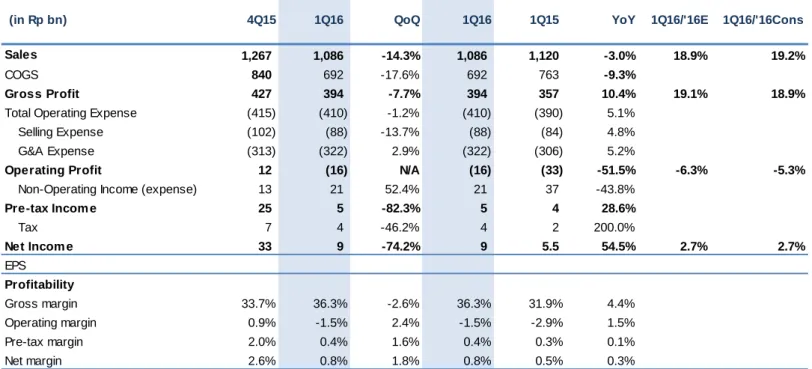
Figure 4. Quarterly Performance
Source: Company, SSI estimates
(in Rp bn) 4Q15 1Q16 QoQ 1Q16 1Q15 YoY 1Q16/'16E 1Q16/'16Cons
Sales 1,267 1,086 -14.3% 1,086 1,120 -3.0% 18.9% 19.2%
COGS 840 692 -17.6% 692 763 -9.3%
Gross Profit 427 394 -7.7% 394 357 10.4% 19.1% 18.9%
Total Operating Expense (415) (410) -1.2% (410) (390) 5.1%
Selling Expense (102) (88) -13.7% (88) (84) 4.8%
G&A Expense (313) (322) 2.9% (322) (306) 5.2%
Operating Profit 12 (16) N/A (16) (33) -51.5% -6.3% -5.3%
Non-Operating Income (expense) 13 21 52.4% 21 37 -43.8%
Pre-tax Incom e 25 5 -82.3% 5 4 28.6% Tax 7 4 -46.2% 4 2 200.0% Net Incom e 33 9 -74.2% 9 5.5 54.5% 2.7% 2.7% EPS Profitability Gross margin 33.7% 36.3% -2.6% 36.3% 31.9% 4.4% Operating margin 0.9% -1.5% 2.4% -1.5% -2.9% 1.5% Pre-tax margin 2.0% 0.4% 1.6% 0.4% 0.3% 0.1% Net margin 2.6% 0.8% 1.8% 0.8% 0.5% 0.3%
www.samuel.co.id Page 4 of 6 Tuesday, 03 May 2016
Ramayana Lestari Sentosa
RALS.IJ / RALS.JK
Key Financials
Profit and Loss Cash Flow
Rp bn 14A 15A 16E 17E Yr-end Dec (Rp bn) 14A 15A 16E 17E
Revenue 5,861 5,533 5,728 5,988 Net income 355 335 355 369
COGS (3,813) (3,537) (3,649) (3,803) Depreciation & amort. 197 133 137 144
Gross profit 2,048 1,996 2,079 2,186 Others 0 0 0 1
Gross margin (%) 34.9 36.1 36.3 36.5 Working capital 63 32 (203) (73)
Operating profit 294 234 249 267 Operating cash flow 615 499 289 441
Operating margin (%) 5.0 4.2 4.3 4.5 Net - Capital expenditure (127) (90) (332) (277)
EBITDA 490 367 386 411 Investing cash flow (53) (17) (260) (291)
EBITDA margin (%) 8.4 6.6 6.7 6.9 Net - Borrowings 0 0 0 0
Other income (expenses) 95 130 167 166 Other financing (183) (315) (133) (138)
Pre-tax profit 388 364 416 433 Financing cash flow (183) (315) (133) (138)
Income tax - net (33) (29) (61) (63) Net - Cash flow 379 175 (112) 11
Net profit 355 335 355 369 Cash at beginning 1,273 1,653 1,828 1,716
Net profit margin (%) 6.1 6.1 6.2 6.2 Cash at ending 1,652 1,828 1,716 1,727
Balance Sheet Key Ratios
Yr-end Dec (Rp bn) 14A 15A 16E 17E Yr-end Dec (Rp bn) 14A 15A 16E 17E
Cash & ST Investment 1,653 1,828 1,716 1,727 ROE (%) 11.6 10.7 9.5 9.6
Receivables 23 35 45 55 ROA (%) 7.8 7.3 7.3 7.3
Inventories 809 824 1,081 1,130 Revenue growth (%) -26.4 -5.6 3.5 4.5
Others 210 145 156 160 EBITDA growth (%) -14.9 -25.2 5.2 6.4
Total current assets 2,695 2,832 2,998 3,072 EPS growth (%) -9.1 -5.7 5.9 4.1
Net fixed assets 1,375 1,333 1,527 1,661 Interest coverage (x) n/a n/a n/a n/a
Other assets 485 411 339 353 Debt to equity (%) n/a n/a n/a n/a
Total assets 4,555 4,576 4,865 5,086 Net gearing (%) n/a n/a n/a n/a
Payables 889 900 960 951
ST. debt and curr. maturity 0 0 0 0 Major Assumptions
Other current liabilities 79 61 75 75 14A 15A 16E 17E
LT. debt 0 0 0 0 SSSG (%) -1.5 -2.8 0.6 1.7
Other long term liabilities 228 280 315 354 Store area ('000 sqm) 989 994 1,023 1,052
Total liabilities 1,195 1,241 1,350 1,380 Inventory days 79 83 68 68
www.samuel.co.id Page 6 of 6
DISCLAIMERS
Analyst Certification : The views expressed in this research accurately reflect the personal views of the analyst(s) about the subject securities or issuers and no part of the compensation of the analyst(s) was, is, or will be directly or indirectly related to the inclusion of specific recommendations or views in this research. The analyst(s) principally responsible for the preparation of this research has taken reasonable care to achieve and maintain independence and objectivity in making any recommendations.
This document is for information only and for the use of the recipient. It is not to be reproduced or copied or made available to others. Under no circumstances is it to be considered as an offer to sell or solicitation to buy any security. Any recommendation contained in this report may not be suitable for all investors. Moreover, although the information contained herein has been obtained from sources believed to be reliable, its accuracy, completeness and reliability cannot be guaranteed. All rights reserved by PT Samuel Sekuritas Indonesia.